| Param | Original file | Final file |
|---|---|---|
| Filename | modeM0/AS1A09_143T05_9000003804_26353cztM0_level2.evt | modeM0/AS1A09_143T05_9000003804_26353cztM0_level2_quad_clean.evt |
| Size (bytes) | 595,189,440 | 85,138,560 |
| Size | 567.6 MB | 81.2 MB |
| Events in quadrant A | 2,952,434 | 565,174 |
| Events in quadrant B | 3,188,400 | 567,139 |
| Events in quadrant C | 6,743,482 | 484,120 |
| Events in quadrant D | 4,724,591 | 531,942 |
| Mode M0 | |||
|---|---|---|---|
| Quadrant | BADHDUFLAG | Total packets | Discarded packets |
| A | 0 | 12741 | 0 |
| B | 0 | 13503 | 0 |
| C | 0 | 24334 | 0 |
| D | 0 | 18223 | 0 |
| Mode M9 | |||
|---|---|---|---|
| Quadrant | BADHDUFLAG | Total packets | Discarded packets |
| A | 0 | 9 | 0 |
| B | 0 | 9 | 0 |
| C | 0 | 9 | 0 |
| D | 0 | 9 | 0 |
| Quadrant | Total seconds | Saturated seconds | Saturation percentage |
|---|---|---|---|
| A | 6145 | 47 | 0.764849% |
| B | 6146 | 91 | 1.480638% |
| C | 6145 | 1147 | 18.665582% |
| D | 6145 | 490 | 7.973963% |
Noise dominated data is calculated using 1-second bins in cleaned event files. If a bin has >2000 counts, and if more than 50% of those come from <1% of pixels, then it is considered to be noise-dominated and hence unusable.
| Quadrant | # 1 sec bins | Bins with >0 counts | Bins with >2000 counts | High rate bins dominated by noise | Noise dominated (total time) | Noise dominated (detector-on time) | Marked lightcurve |
|---|---|---|---|---|---|---|---|
| A | 7060 | 6146 | 3 | 3 | 0.04% | 0.05% | 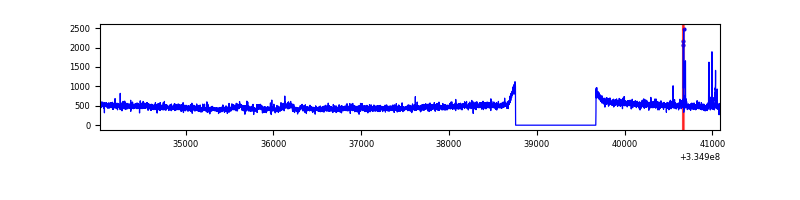 |
| B | 7061 | 6147 | 32 | 32 | 0.45% | 0.52% | 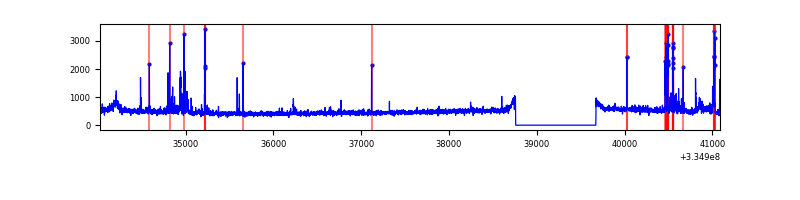 |
| C | 7060 | 6146 | 645 | 645 | 9.14% | 10.49% | 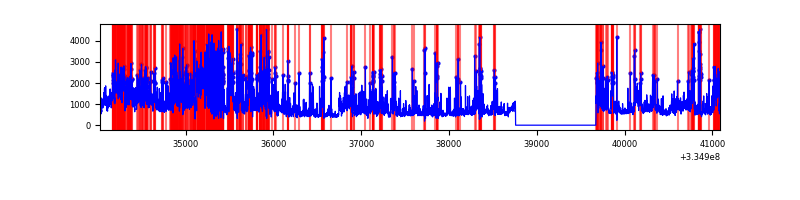 |
| D | 7060 | 6146 | 370 | 370 | 5.24% | 6.02% | 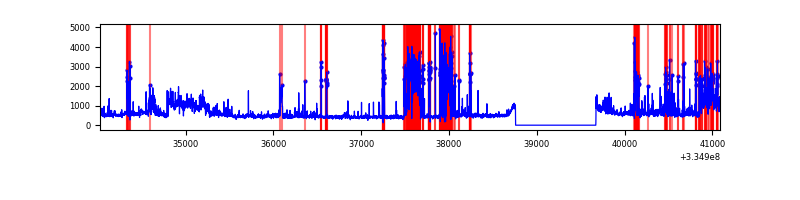 |
Top three noisy pixels from each quadrant. If the there are fewer than three noisy pixels in the level2.evt file, extra rows are filled as -1
| Pixel properties | Quadrant properties | ||||||
|---|---|---|---|---|---|---|---|
| Quadrant | DetID | PixID | Counts | Sigma | Mean | Median | Sigma |
| A | 6 | 16 | 51410 | 338.9 | 742 | 726 | 149.6 |
| A | 0 | 13 | 37728 | 247.42 | 742 | 726 | 149.6 |
| A | 13 | 254 | 10888 | 67.95 | 742 | 726 | 149.6 |
| B | 5 | 172 | 203192 | 1428.02 | 738 | 719 | 141.8 |
| B | 0 | 230 | 47474 | 329.76 | 738 | 719 | 141.8 |
| B | 0 | 186 | 37404 | 258.74 | 738 | 719 | 141.8 |
| C | 3 | 233 | 2966799 | 18640.41 | 673 | 678 | 159.1 |
| C | 0 | 239 | 1021628 | 6416.1 | 673 | 678 | 159.1 |
| C | 14 | 238 | 103840 | 648.32 | 673 | 678 | 159.1 |
| D | 1 | 52 | 1937133 | 11443.06 | 703 | 684 | 169.2 |
| D | 11 | 176 | 56211 | 328.12 | 703 | 684 | 169.2 |
| D | 2 | 234 | 26248 | 151.06 | 703 | 684 | 169.2 |
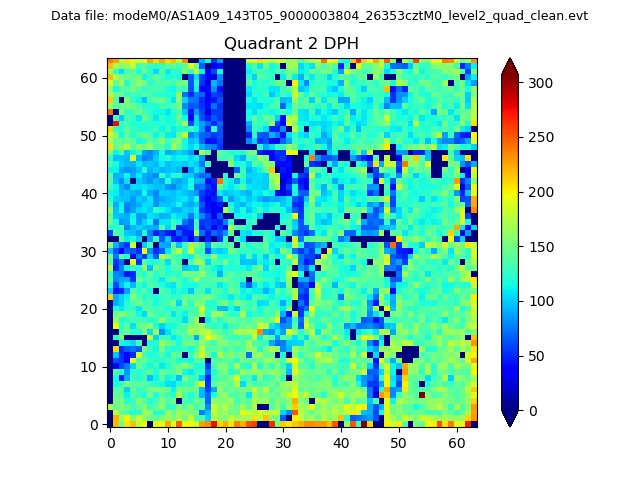
Histogram calculated using DETX and DETY for each event in the final _common_clean file
| Quadrant A | 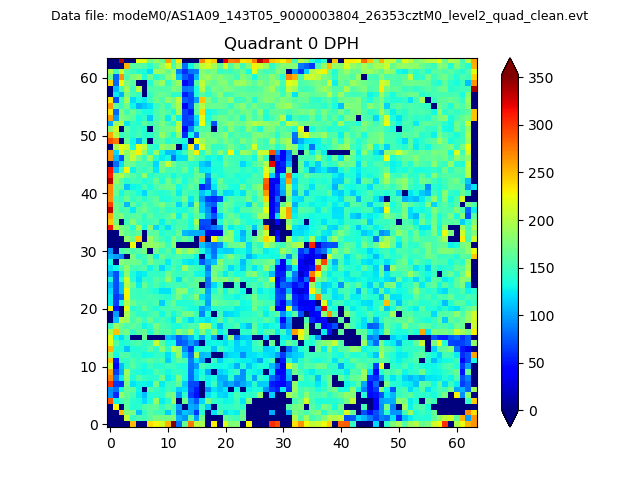 |
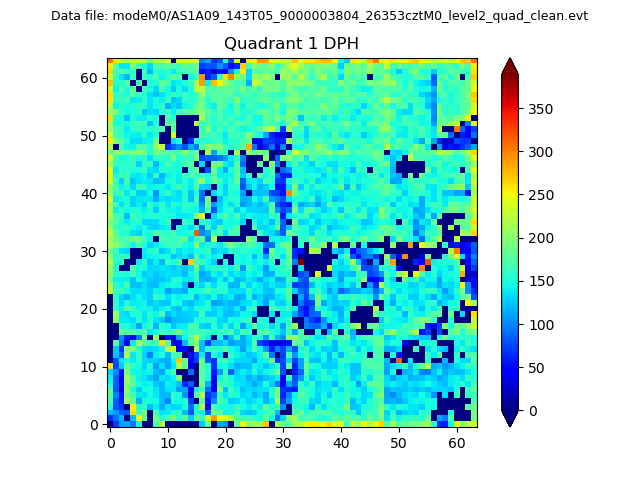 |
Quadrant B |
|---|---|---|---|
| Quadrant D | 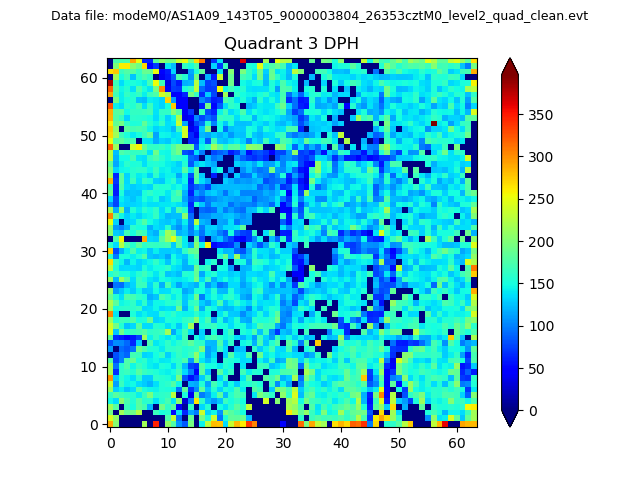 |
 |
Quadrant C |
| Plot type | Count rate plots | Images |
|---|---|---|
| Comparison with Poisson distribution Blue bars denote a histogram of data divided into 1 sec bins. Red curve is a Poisson curve with rate = median count rate of data. |
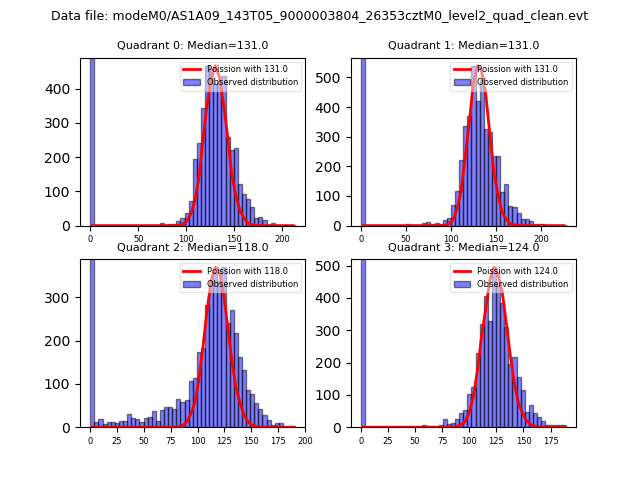 |
 |
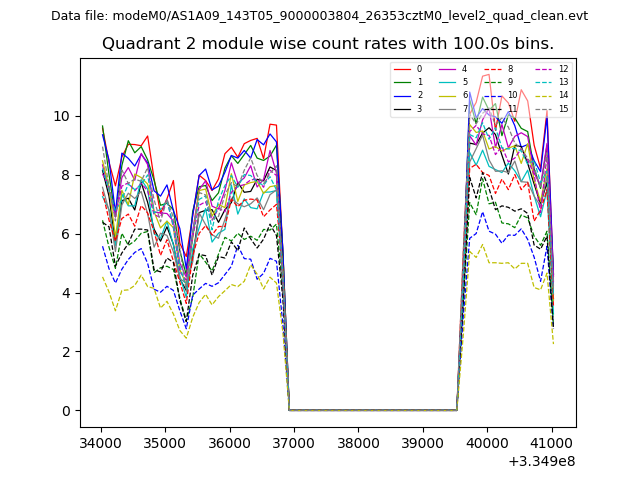
| Quadrant-wise count rates Data is divided into 100 sec bins |
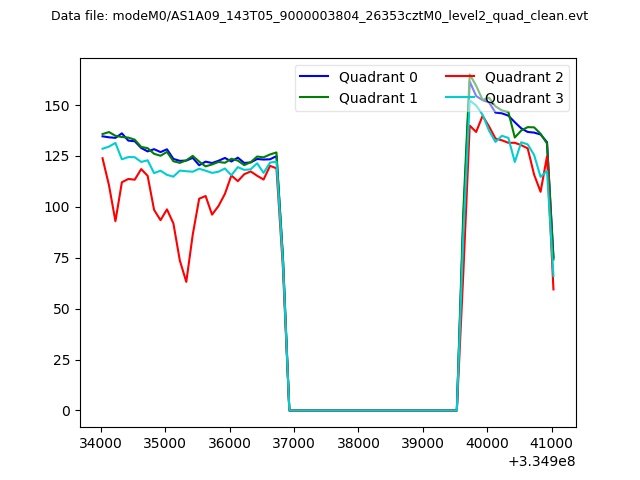 |
|
| Module-wise count rates for Quadrant A Data is divided into 100 sec bins |
 |
 |
| Module-wise count rates for Quadrant B Data is divided into 100 sec bins |
 |
 |
| Module-wise count rates for Quadrant C Data is divided into 100 sec bins |
 |
 |
| Module-wise count rates for Quadrant D Data is divided into 100 sec bins |
 |
 |
| Parameter | Plot |
|---|---|
| CZT HV Monitor | 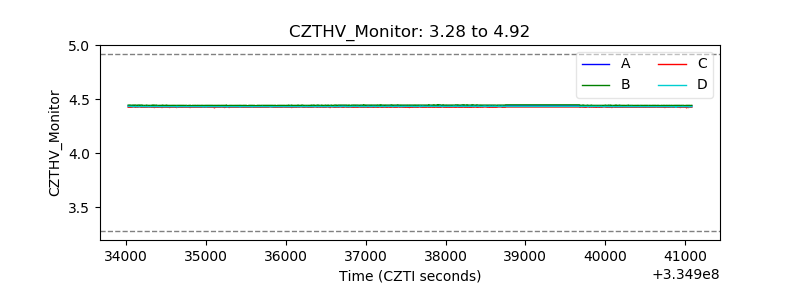 |
| D_VDD |  |
| Temperature 1 | 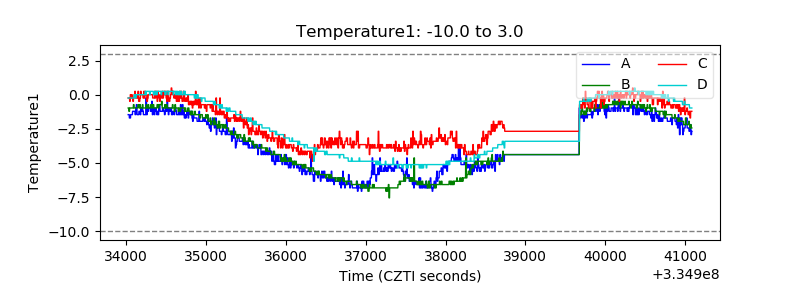 |
| Veto HV Monitor | 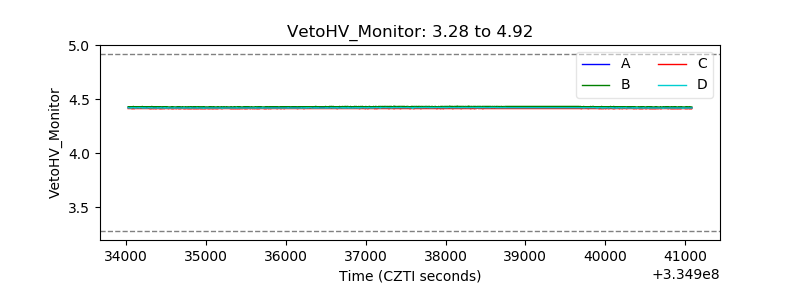 |
| Veto LLD |  |
| Alpha Counter | 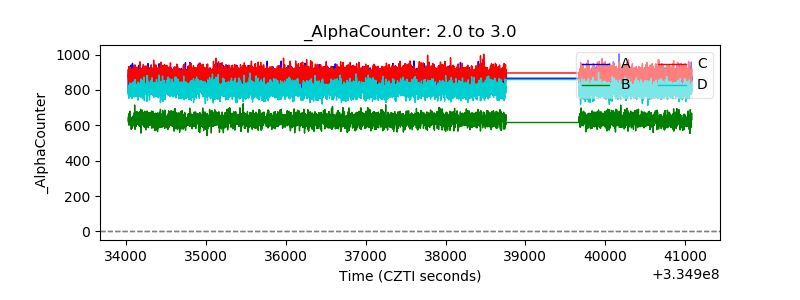 |
| _CPM_Rate | 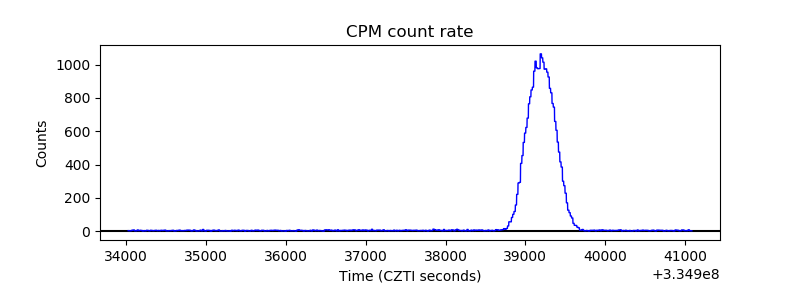 |
| CZT Counter | 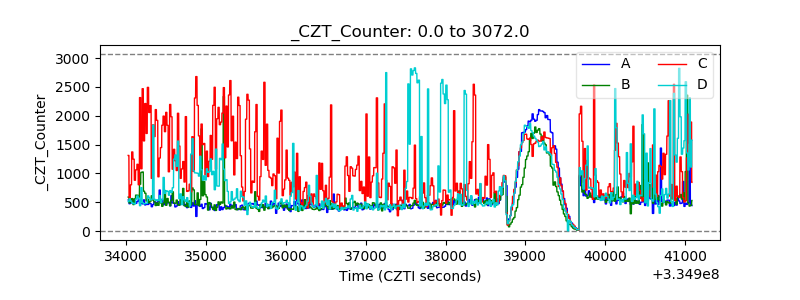 |
| +2.5 Volts monitor |  |
| +5 Volts monitor |  |
| _ROLL_ROT |  |
| _Roll_DEC | 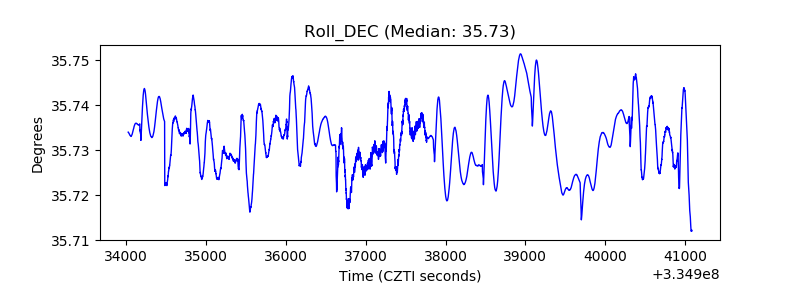 |
| _Roll_RA | 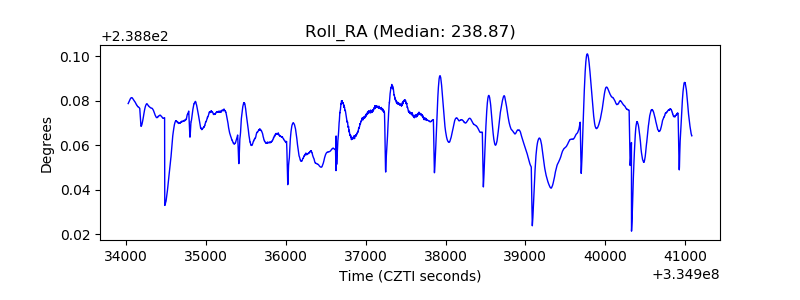 |
| Veto Counter |  |