| Param | Original file | Final file |
|---|---|---|
| Filename | modeM0/AS1A09_143T05_9000003804_26354cztM0_level2.evt | modeM0/AS1A09_143T05_9000003804_26354cztM0_level2_quad_clean.evt |
| Size (bytes) | 194,181,120 | 37,848,960 |
| Size | 185.2 MB | 36.1 MB |
| Events in quadrant A | 982,355 | 261,364 |
| Events in quadrant B | 1,220,004 | 259,110 |
| Events in quadrant C | 1,660,976 | 240,453 |
| Events in quadrant D | 1,880,250 | 240,089 |
| Mode M0 | |||
|---|---|---|---|
| Quadrant | BADHDUFLAG | Total packets | Discarded packets |
| A | 0 | 4232 | 0 |
| B | 0 | 4994 | 0 |
| C | 0 | 6316 | 0 |
| D | 0 | 6964 | 0 |
| Quadrant | Total seconds | Saturated seconds | Saturation percentage |
|---|---|---|---|
| A | 1990 | 10 | 0.502513% |
| B | 1991 | 82 | 4.118533% |
| C | 1991 | 153 | 7.684581% |
| D | 1991 | 117 | 5.876444% |
Noise dominated data is calculated using 1-second bins in cleaned event files. If a bin has >2000 counts, and if more than 50% of those come from <1% of pixels, then it is considered to be noise-dominated and hence unusable.
| Quadrant | # 1 sec bins | Bins with >0 counts | Bins with >2000 counts | High rate bins dominated by noise | Noise dominated (total time) | Noise dominated (detector-on time) | Marked lightcurve |
|---|---|---|---|---|---|---|---|
| A | 1990 | 1990 | 9 | 9 | 0.45% | 0.45% | 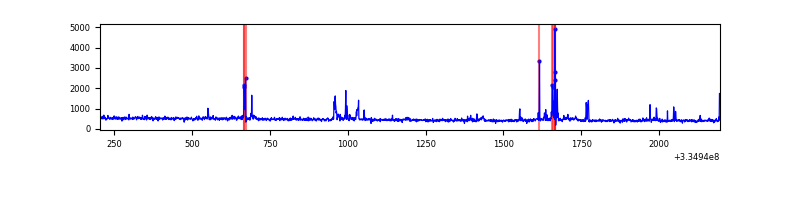 |
| B | 1991 | 1991 | 60 | 60 | 3.01% | 3.01% | 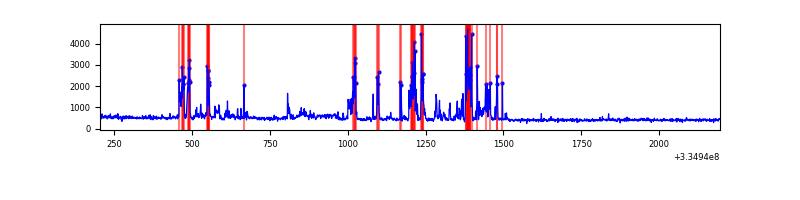 |
| C | 1991 | 1991 | 76 | 76 | 3.82% | 3.82% | 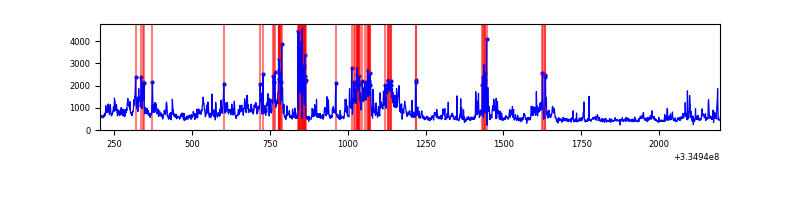 |
| D | 1991 | 1991 | 104 | 104 | 5.22% | 5.22% | 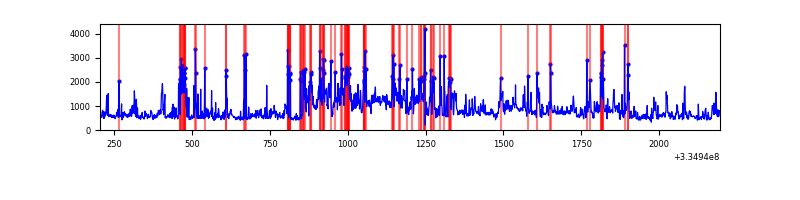 |
Top three noisy pixels from each quadrant. If the there are fewer than three noisy pixels in the level2.evt file, extra rows are filled as -1
| Pixel properties | Quadrant properties | ||||||
|---|---|---|---|---|---|---|---|
| Quadrant | DetID | PixID | Counts | Sigma | Mean | Median | Sigma |
| A | 0 | 13 | 87983 | 1848.69 | 228 | 224 | 47.5 |
| A | 6 | 16 | 13531 | 280.32 | 228 | 224 | 47.5 |
| A | 13 | 254 | 3423 | 67.39 | 228 | 224 | 47.5 |
| B | 5 | 172 | 340571 | 7639.76 | 225 | 220 | 44.5 |
| B | 12 | 111 | 4736 | 101.37 | 225 | 220 | 44.5 |
| B | 11 | 111 | 3958 | 83.91 | 225 | 220 | 44.5 |
| C | 3 | 233 | 673245 | 12925.73 | 216 | 218 | 52.1 |
| C | 0 | 239 | 97739 | 1872.93 | 216 | 218 | 52.1 |
| C | 14 | 238 | 33959 | 648.01 | 216 | 218 | 52.1 |
| D | 1 | 52 | 1010542 | 18563.43 | 222 | 217 | 54.4 |
| D | 8 | 195 | 12269 | 221.44 | 222 | 217 | 54.4 |
| D | 2 | 234 | 9180 | 164.68 | 222 | 217 | 54.4 |
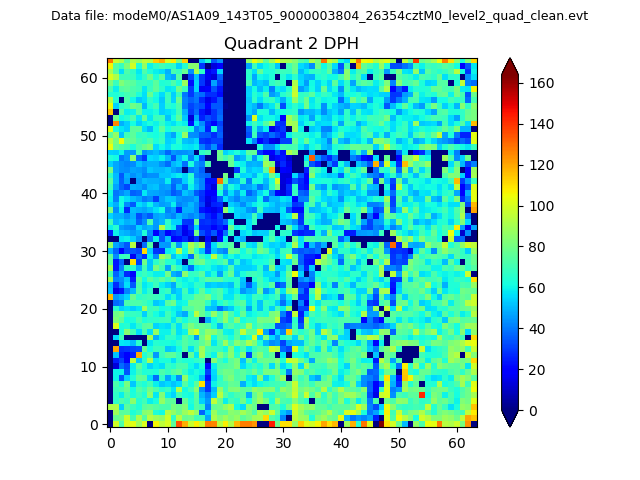
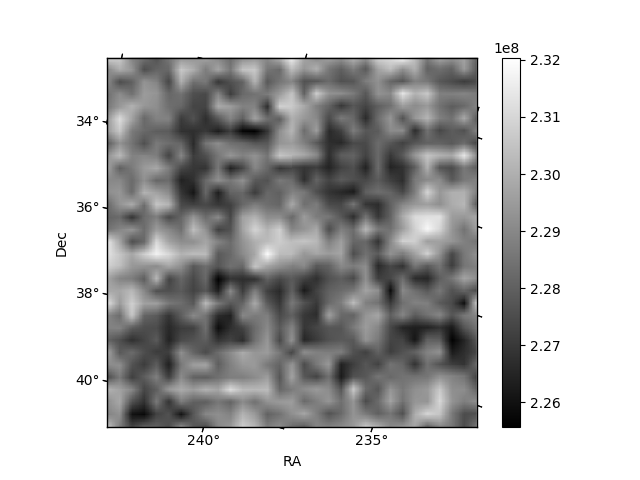
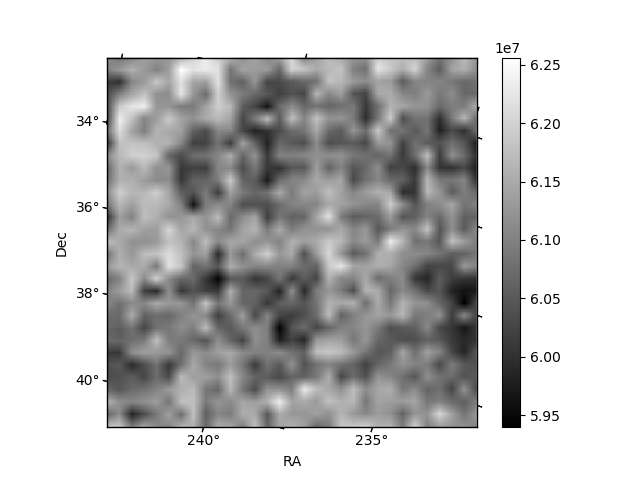
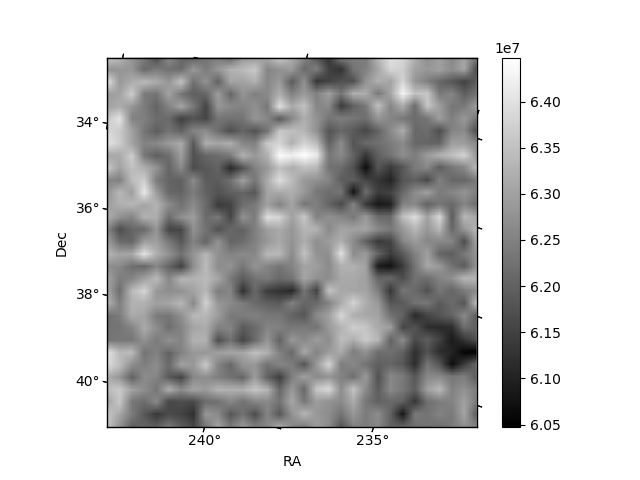
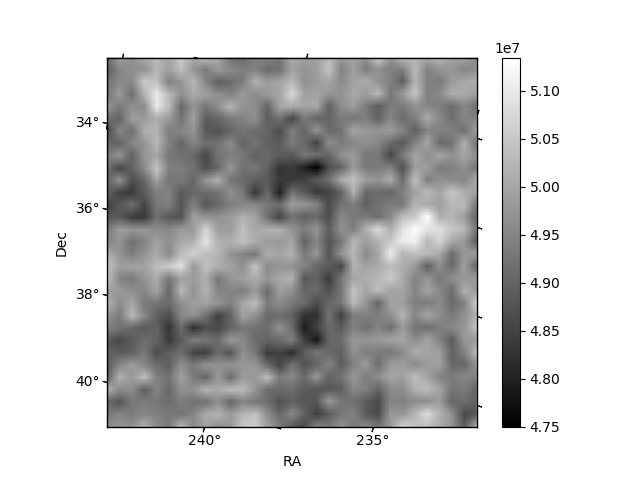
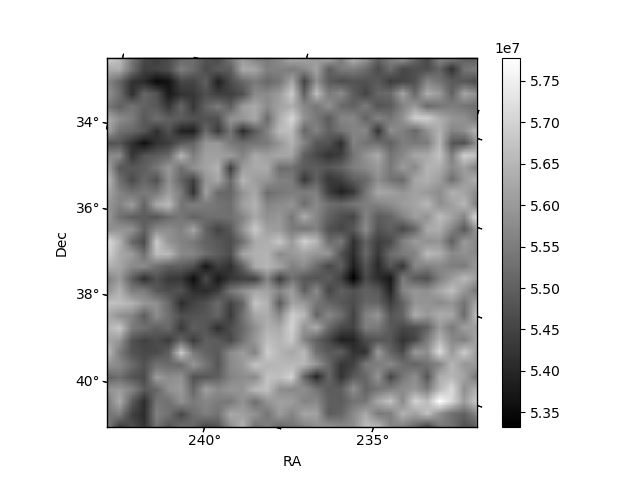
Histogram calculated using DETX and DETY for each event in the final _common_clean file
| Quadrant A | 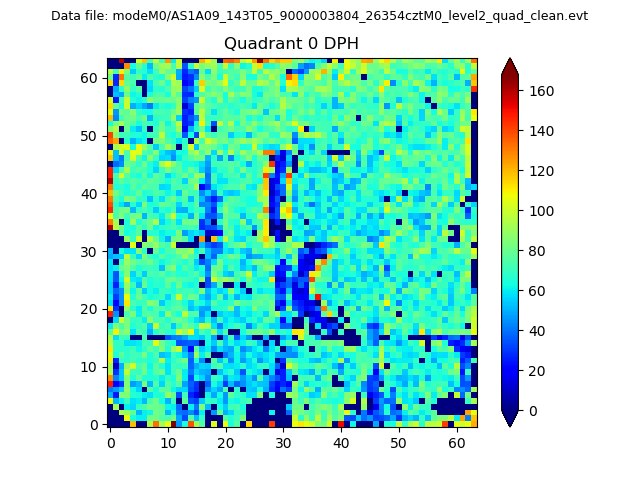 |
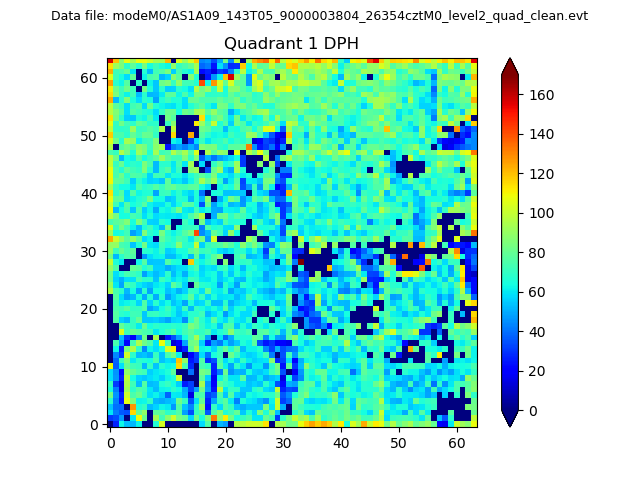 |
Quadrant B |
|---|---|---|---|
| Quadrant D | 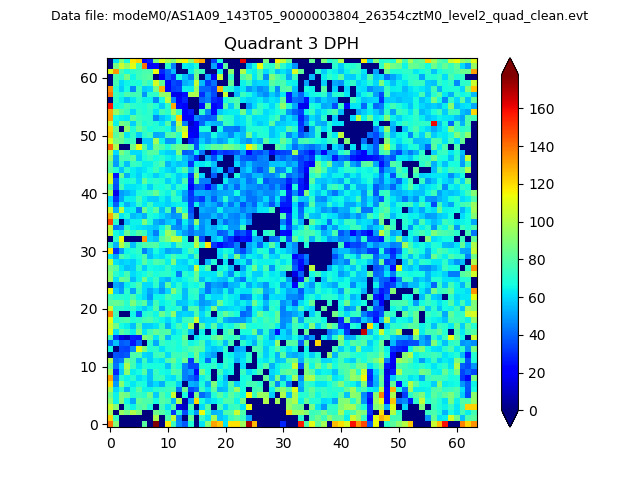 |
 |
Quadrant C |
| Plot type | Count rate plots | Images |
|---|---|---|
| Comparison with Poisson distribution Blue bars denote a histogram of data divided into 1 sec bins. Red curve is a Poisson curve with rate = median count rate of data. |
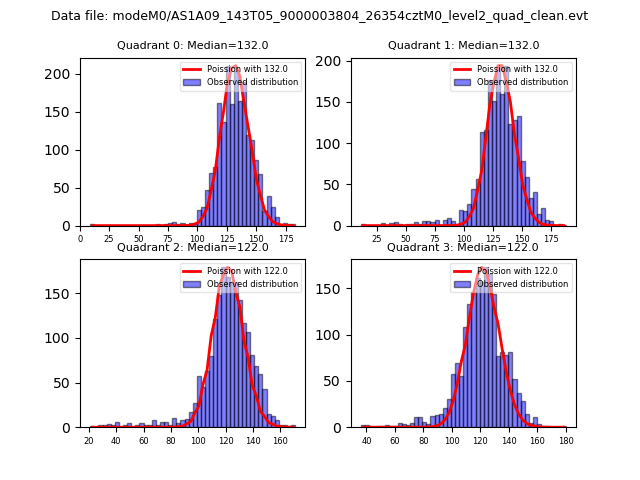 |
 |
| Quadrant-wise count rates Data is divided into 100 sec bins |
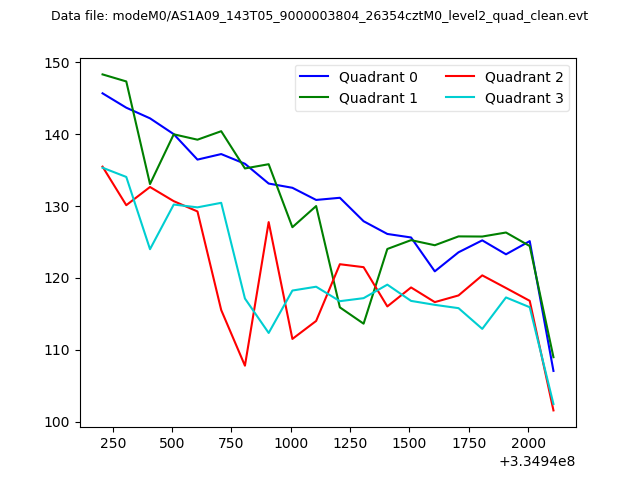 |
|
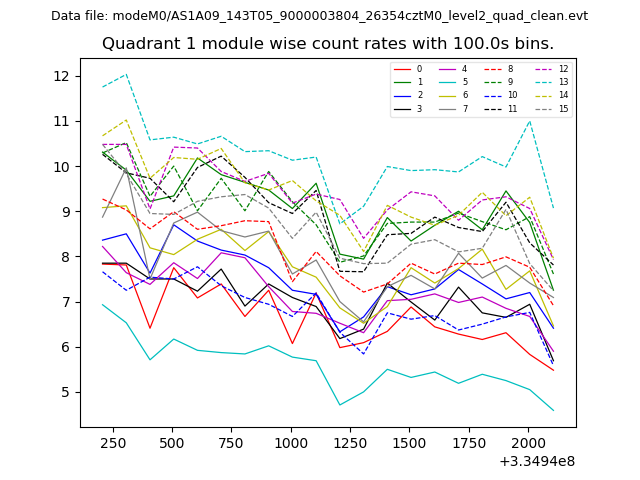
| Module-wise count rates for Quadrant A Data is divided into 100 sec bins |
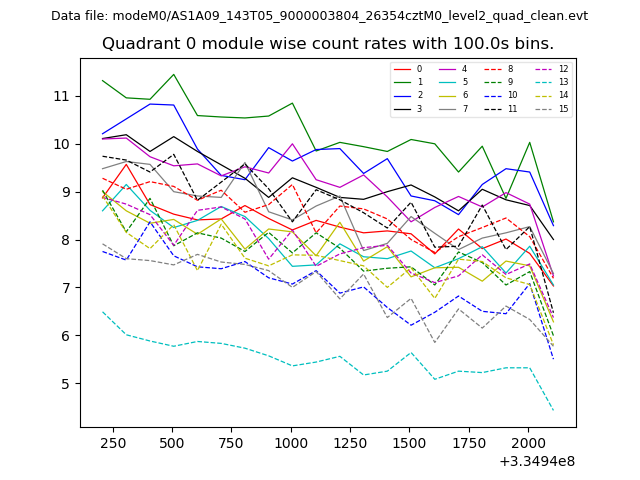 |
 |
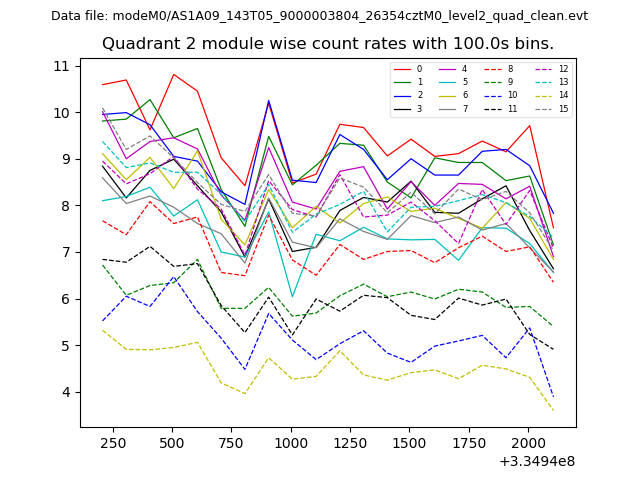
| Module-wise count rates for Quadrant B Data is divided into 100 sec bins |
 |
 |
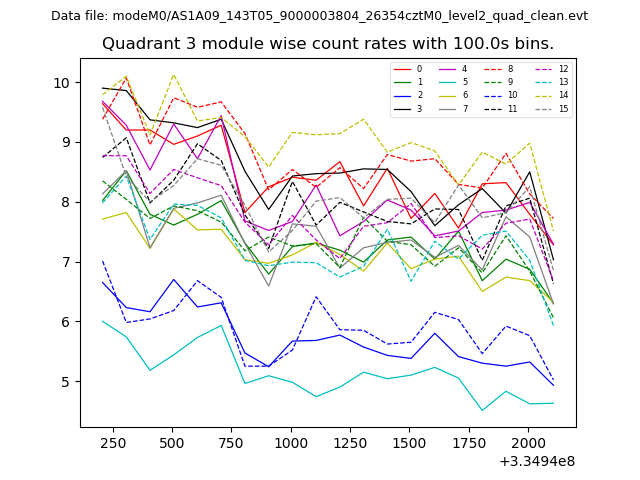
| Module-wise count rates for Quadrant C Data is divided into 100 sec bins |
 |
 |
| Module-wise count rates for Quadrant D Data is divided into 100 sec bins |
 |
 |
| Parameter | Plot |
|---|---|
| CZT HV Monitor | 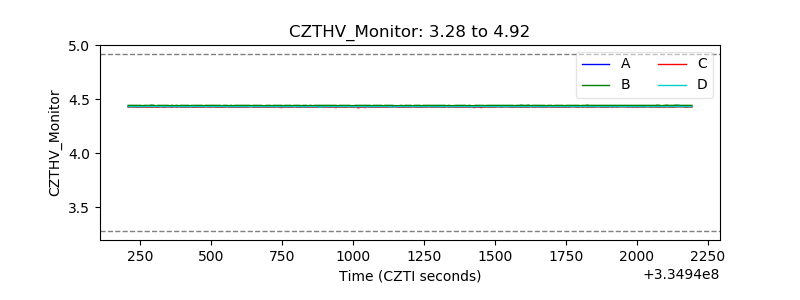 |
| D_VDD | 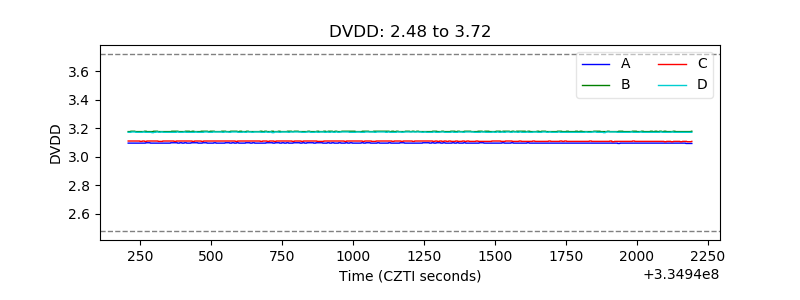 |
| Temperature 1 | 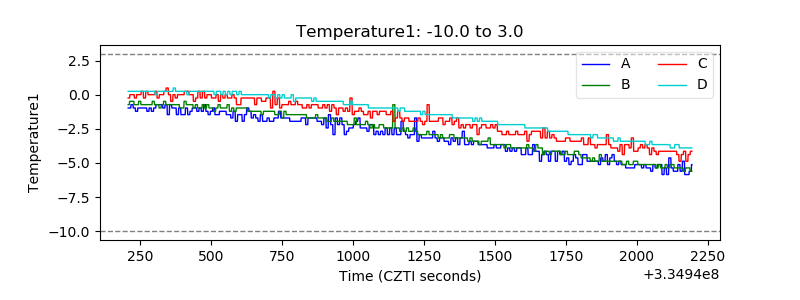 |
| Veto HV Monitor | 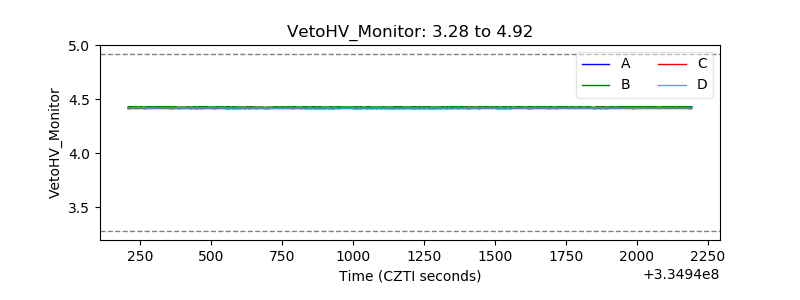 |
| Veto LLD | 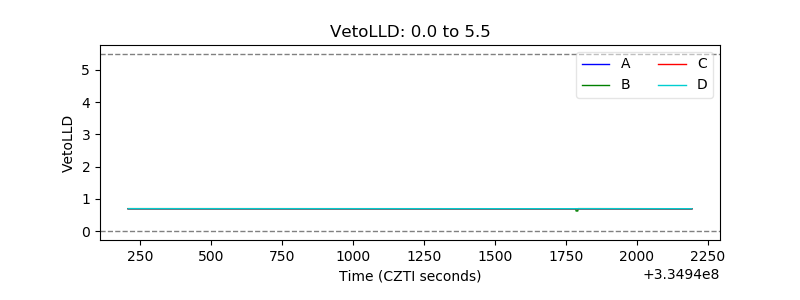 |
| Alpha Counter | 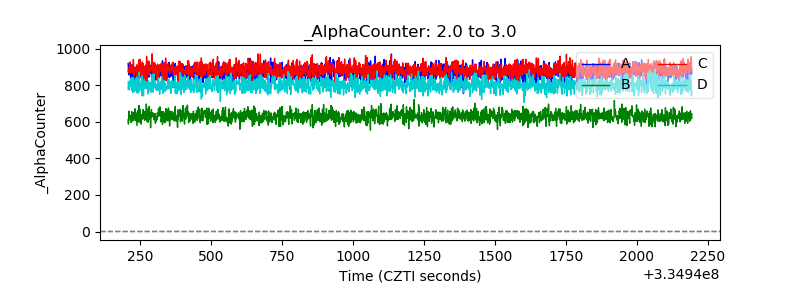 |
| _CPM_Rate | 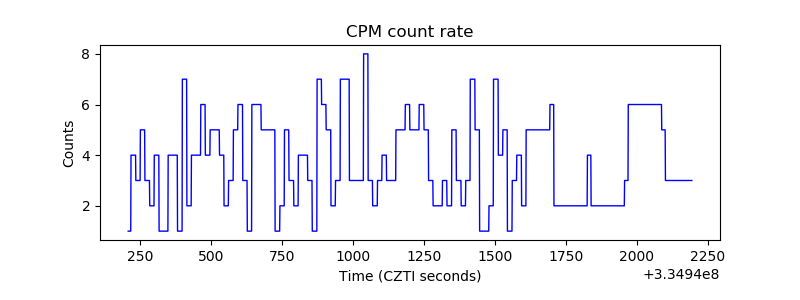 |
| CZT Counter | 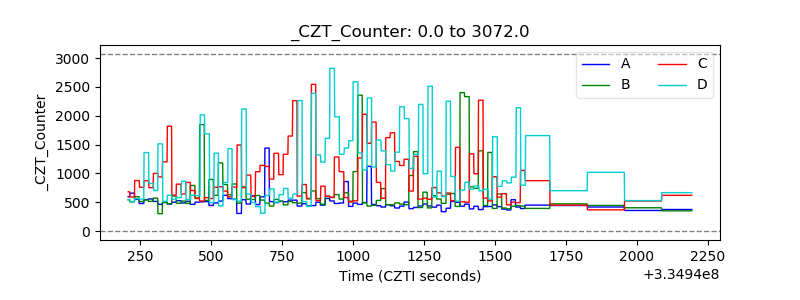 |
| +2.5 Volts monitor | 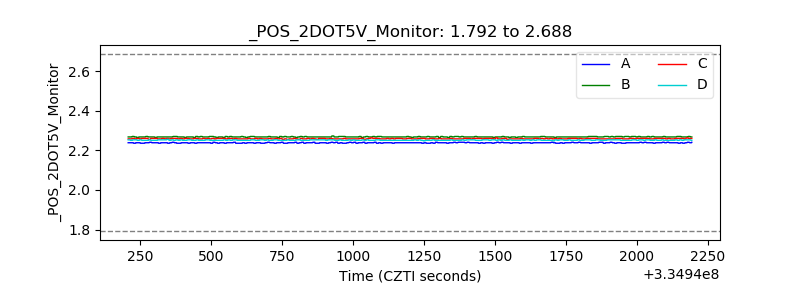 |
| +5 Volts monitor |  |
| _ROLL_ROT |  |
| _Roll_DEC | 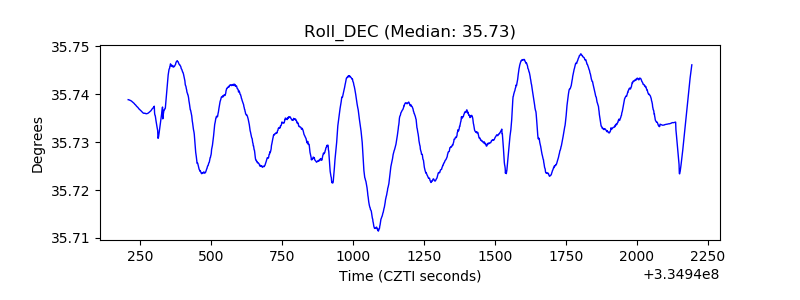 |
| _Roll_RA | 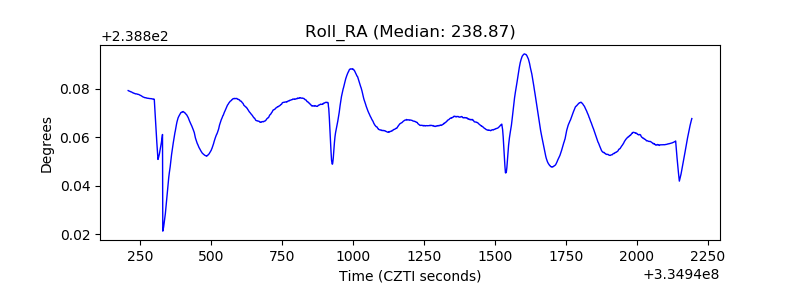 |
| Veto Counter | 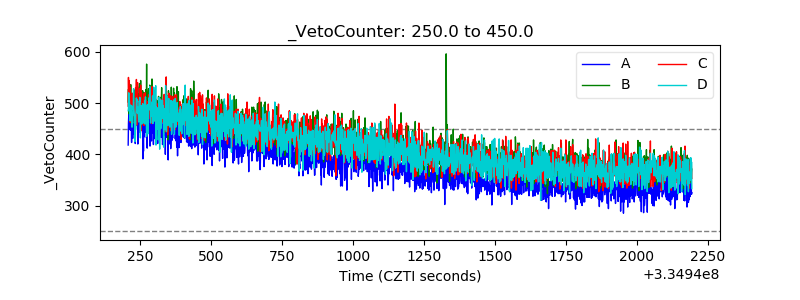 |