| Param | Original file | Final file |
|---|---|---|
| Filename | modeM0/AS1A09_143T08_9000003806cztM0_level2.fits | modeM0/AS1A09_143T08_9000003806cztM0_level2_quad_clean.evt |
| Size (bytes) | 48,191,040 | 28,776,960 |
| Size | 46.0 MB | 27.4 MB |
| Events in quadrant A | 298,218 | 141,078 |
| Events in quadrant B | 288,938 | 141,386 |
| Events in quadrant C | 286,806 | 131,698 |
| Events in quadrant D | 250,194 | 120,591 |
| Mode SS | |||
|---|---|---|---|
| Quadrant | BADHDUFLAG | Total packets | Discarded packets |
| A | 0 | 100 | 0 |
| B | 0 | 100 | 0 |
| C | 0 | 100 | 0 |
| D | 0 | 100 | 0 |
| Mode M0 | |||
|---|---|---|---|
| Quadrant | BADHDUFLAG | Total packets | Discarded packets |
| A | 0 | 10445 | 0 |
| B | 0 | 10037 | 0 |
| C | 0 | 11379 | 0 |
| D | 0 | 15265 | 0 |
| Mode M9 | |||
|---|---|---|---|
| Quadrant | BADHDUFLAG | Total packets | Discarded packets |
| A | 0 | 10 | 0 |
| B | 0 | 10 | 0 |
| C | 0 | 10 | 0 |
| D | 0 | 10 | 0 |
| Quadrant | Total seconds | Saturated seconds | Saturation percentage |
|---|---|---|---|
| A | 4770 | 58 | 1.215933% |
| B | 4770 | 33 | 0.691824% |
| C | 4770 | 117 | 2.452830% |
| D | 4770 | 154 | 3.228512% |
Noise dominated data is calculated using 1-second bins in cleaned event files. If a bin has >2000 counts, and if more than 50% of those come from <1% of pixels, then it is considered to be noise-dominated and hence unusable.
| Quadrant | # 1 sec bins | Bins with >0 counts | Bins with >2000 counts | High rate bins dominated by noise | Noise dominated (total time) | Noise dominated (detector-on time) | Marked lightcurve |
|---|---|---|---|---|---|---|---|
| A | 5855 | 4770 | 0 | 0 | 0.00% | 0.00% |  |
| B | 5855 | 4770 | 0 | 0 | 0.00% | 0.00% |  |
| C | 5855 | 4769 | 0 | 0 | 0.00% | 0.00% | 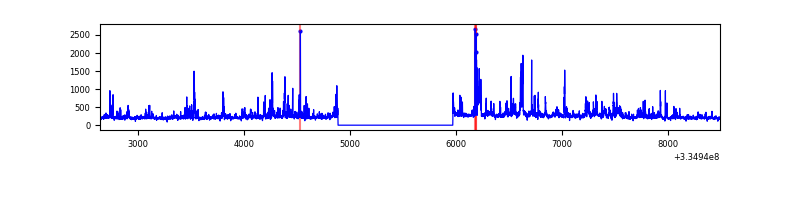 |
| D | 5855 | 4770 | 0 | 0 | 0.00% | 0.00% | 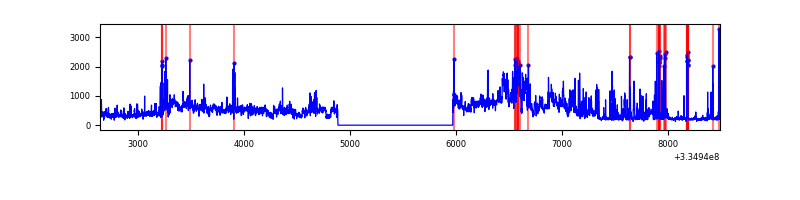 |
Top three noisy pixels from each quadrant. If the there are fewer than three noisy pixels in the level2.evt file, extra rows are filled as -1
| Pixel properties | Quadrant properties | ||||||
|---|---|---|---|---|---|---|---|
| Quadrant | DetID | PixID | Counts | Sigma | Mean | Median | Sigma |
| A | 0 | 29 | 235 | 7.77 | 77 | 73 | 20.8 |
| A | 7 | 110 | 234 | 7.72 | 77 | 73 | 20.8 |
| A | 0 | 30 | 214 | 6.76 | 77 | 73 | 20.8 |
| B | 2 | 9 | 196 | 7.21 | 76 | 73 | 17.0 |
| B | 4 | 227 | 195 | 7.16 | 76 | 73 | 17.0 |
| B | 5 | 128 | 192 | 6.98 | 76 | 73 | 17.0 |
| C | 3 | 126 | 212 | 6.65 | 75 | 71 | 21.2 |
| C | 9 | 188 | 206 | 6.36 | 75 | 71 | 21.2 |
| C | 9 | 233 | 202 | 6.18 | 75 | 71 | 21.2 |
| D | 3 | 14 | 193 | 6.2 | 71 | 64 | 20.8 |
| D | 7 | 3 | 185 | 5.82 | 71 | 64 | 20.8 |
| D | 6 | 38 | 183 | 5.72 | 71 | 64 | 20.8 |
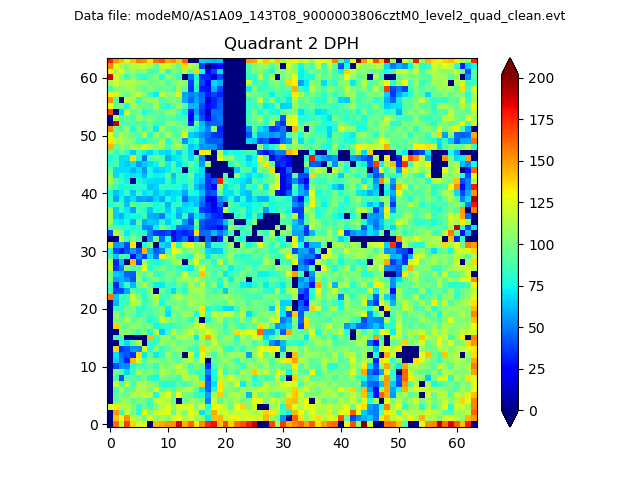
Histogram calculated using DETX and DETY for each event in the final _common_clean file
| Quadrant A | 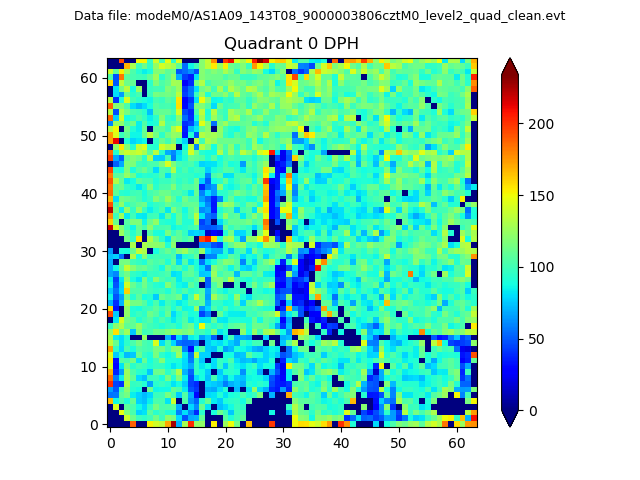 |
 |
Quadrant B |
|---|---|---|---|
| Quadrant D | 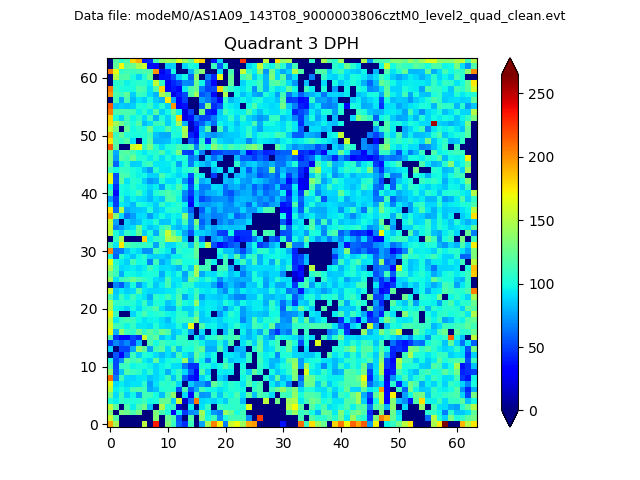 |
 |
Quadrant C |
| Plot type | Count rate plots | Images |
|---|---|---|
| Comparison with Poisson distribution Blue bars denote a histogram of data divided into 1 sec bins. Red curve is a Poisson curve with rate = median count rate of data. |
 |
 |
| Quadrant-wise count rates Data is divided into 100 sec bins |
 |
|
| Module-wise count rates for Quadrant A Data is divided into 100 sec bins |
 |
 |
| Module-wise count rates for Quadrant B Data is divided into 100 sec bins |
 |
 |
| Module-wise count rates for Quadrant C Data is divided into 100 sec bins |
 |
 |
| Module-wise count rates for Quadrant D Data is divided into 100 sec bins |
 |
 |
| Parameter | Plot |
|---|---|
| CZT HV Monitor | 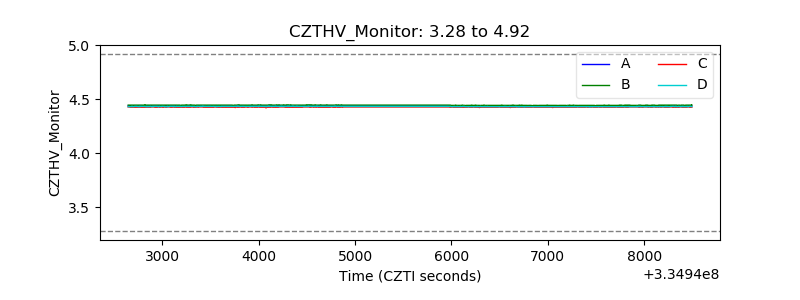 |
| D_VDD |  |
| Temperature 1 |  |
| Veto HV Monitor | 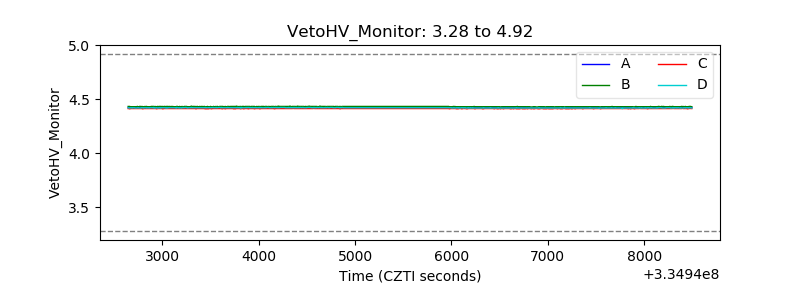 |
| Veto LLD |  |
| Alpha Counter | 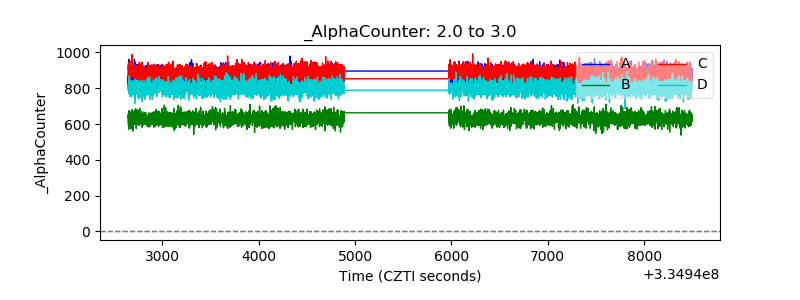 |
| _CPM_Rate |  |
| CZT Counter | 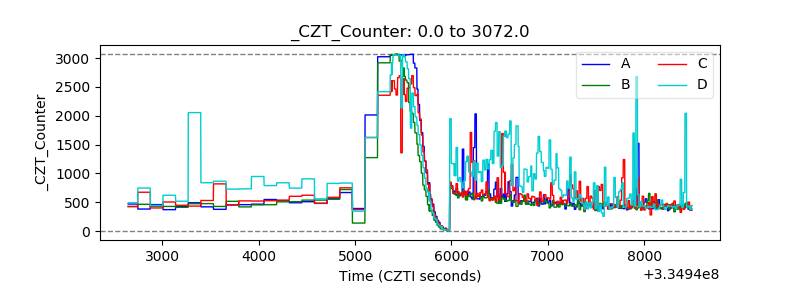 |
| +2.5 Volts monitor |  |
| +5 Volts monitor |  |
| _ROLL_ROT |  |
| _Roll_DEC | 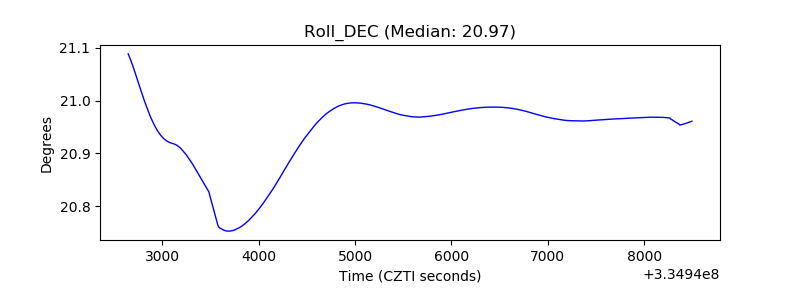 |
| _Roll_RA |  |
| Veto Counter |  |