| Param | Original file | Final file |
|---|---|---|
| Filename | modeM0/AS1A09_143T08_9000003806_26354cztM0_level2.evt | modeM0/AS1A09_143T08_9000003806_26354cztM0_level2_quad_clean.evt |
| Size (bytes) | 314,953,920 | 37,756,800 |
| Size | 300.4 MB | 36.0 MB |
| Events in quadrant A | 1,914,940 | 227,923 |
| Events in quadrant B | 1,852,603 | 234,691 |
| Events in quadrant C | 2,209,241 | 214,178 |
| Events in quadrant D | 3,313,699 | 208,467 |
| Mode M0 | |||
|---|---|---|---|
| Quadrant | BADHDUFLAG | Total packets | Discarded packets |
| A | 0 | 8029 | 0 |
| B | 0 | 7755 | 0 |
| C | 0 | 8936 | 0 |
| D | 0 | 12417 | 0 |
| Mode M9 | |||
|---|---|---|---|
| Quadrant | BADHDUFLAG | Total packets | Discarded packets |
| A | 0 | 10 | 0 |
| B | 0 | 10 | 0 |
| C | 0 | 10 | 0 |
| D | 0 | 10 | 0 |
| Quadrant | Total seconds | Saturated seconds | Saturation percentage |
|---|---|---|---|
| A | 3634 | 50 | 1.375894% |
| B | 3633 | 32 | 0.880815% |
| C | 3633 | 114 | 3.137903% |
| D | 3633 | 121 | 3.330581% |
Noise dominated data is calculated using 1-second bins in cleaned event files. If a bin has >2000 counts, and if more than 50% of those come from <1% of pixels, then it is considered to be noise-dominated and hence unusable.
| Quadrant | # 1 sec bins | Bins with >0 counts | Bins with >2000 counts | High rate bins dominated by noise | Noise dominated (total time) | Noise dominated (detector-on time) | Marked lightcurve |
|---|---|---|---|---|---|---|---|
| A | 4719 | 3635 | 12 | 12 | 0.25% | 0.33% | 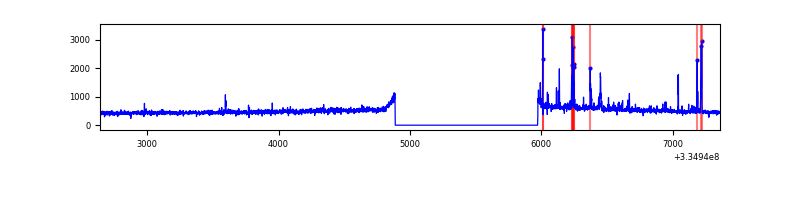 |
| B | 4718 | 3634 | 2 | 2 | 0.04% | 0.06% | 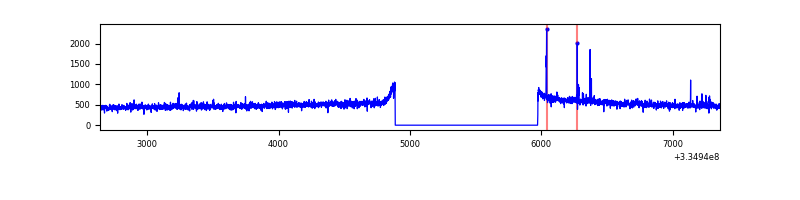 |
| C | 4718 | 3634 | 25 | 25 | 0.53% | 0.69% | 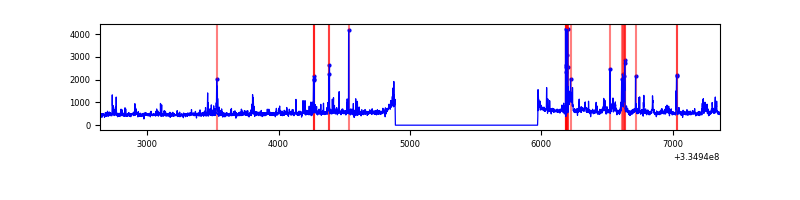 |
| D | 4718 | 3634 | 75 | 75 | 1.59% | 2.06% | 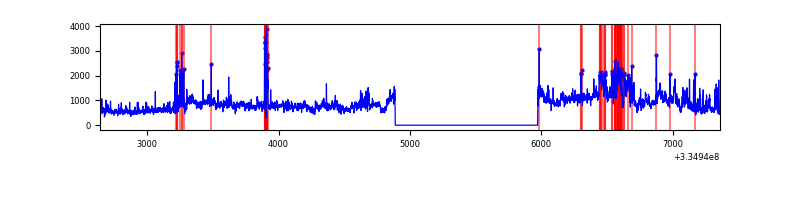 |
Top three noisy pixels from each quadrant. If the there are fewer than three noisy pixels in the level2.evt file, extra rows are filled as -1
| Pixel properties | Quadrant properties | ||||||
|---|---|---|---|---|---|---|---|
| Quadrant | DetID | PixID | Counts | Sigma | Mean | Median | Sigma |
| A | 0 | 13 | 107271 | 1125.44 | 468 | 460 | 94.9 |
| A | 13 | 254 | 5794 | 56.2 | 468 | 460 | 94.9 |
| A | 3 | 137 | 4328 | 40.76 | 468 | 460 | 94.9 |
| B | 12 | 16 | 12161 | 129.63 | 468 | 457 | 90.3 |
| B | 12 | 111 | 10610 | 112.45 | 468 | 457 | 90.3 |
| B | 11 | 111 | 9491 | 100.06 | 468 | 457 | 90.3 |
| C | 3 | 233 | 275102 | 2599.87 | 447 | 450 | 105.6 |
| C | 2 | 16 | 101663 | 958.09 | 447 | 450 | 105.6 |
| C | 14 | 238 | 71070 | 668.49 | 447 | 450 | 105.6 |
| D | 1 | 52 | 1534708 | 14122.41 | 449 | 438 | 108.6 |
| D | 7 | 80 | 35350 | 321.35 | 449 | 438 | 108.6 |
| D | 8 | 195 | 22992 | 207.6 | 449 | 438 | 108.6 |
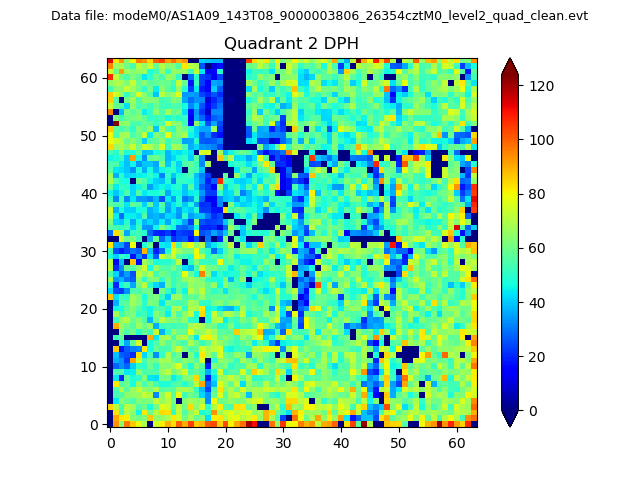
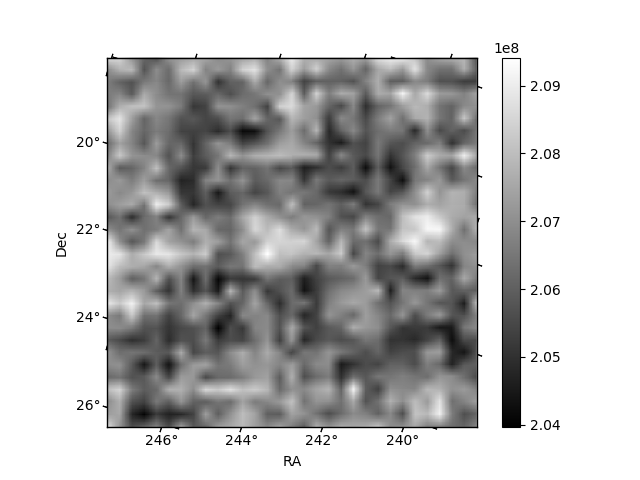
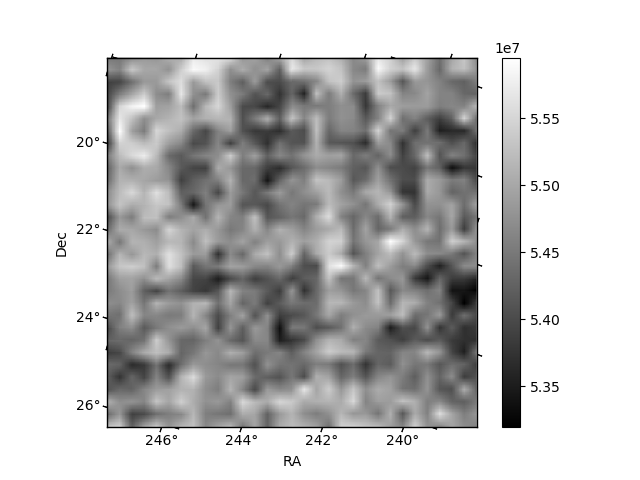
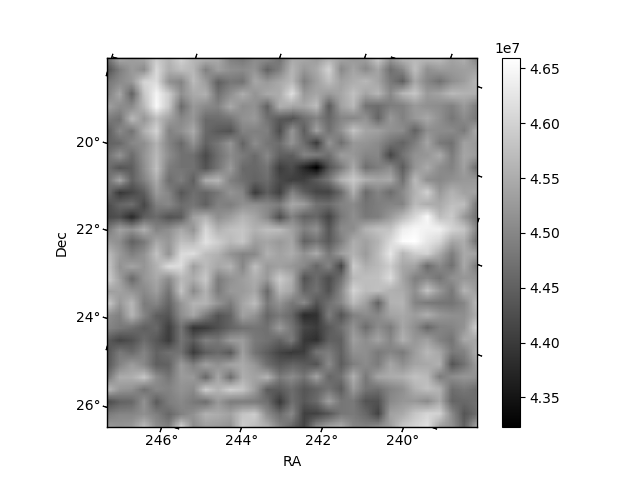
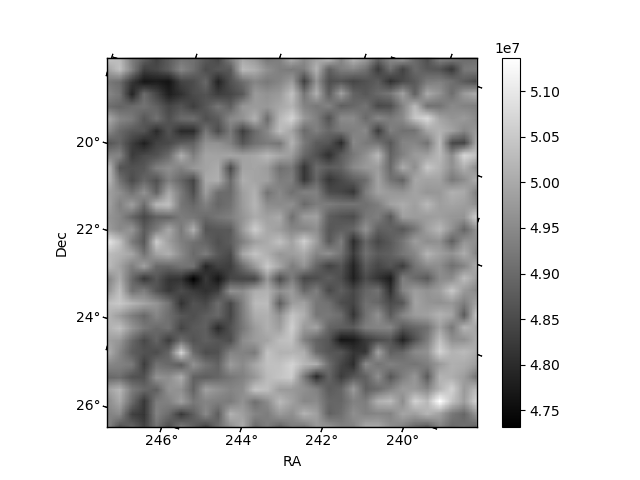
Histogram calculated using DETX and DETY for each event in the final _common_clean file
| Quadrant A | 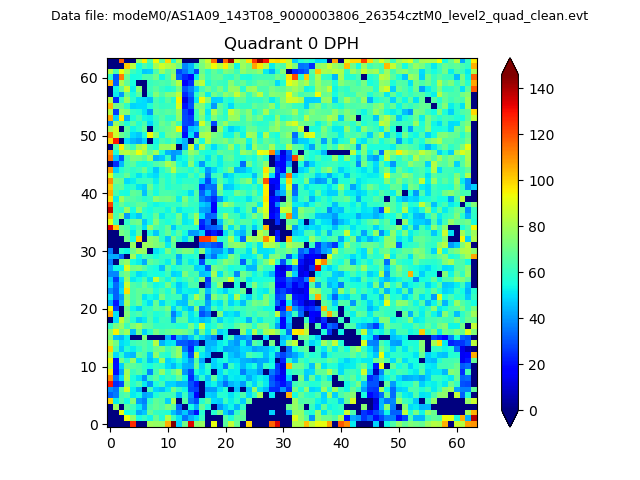 |
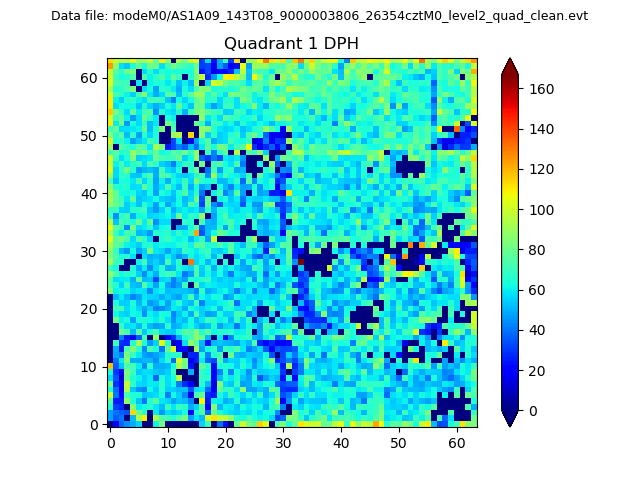 |
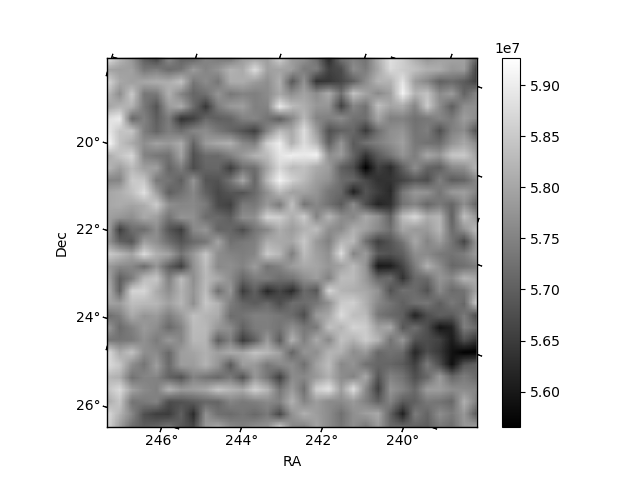
Quadrant B |
|---|---|---|---|
| Quadrant D | 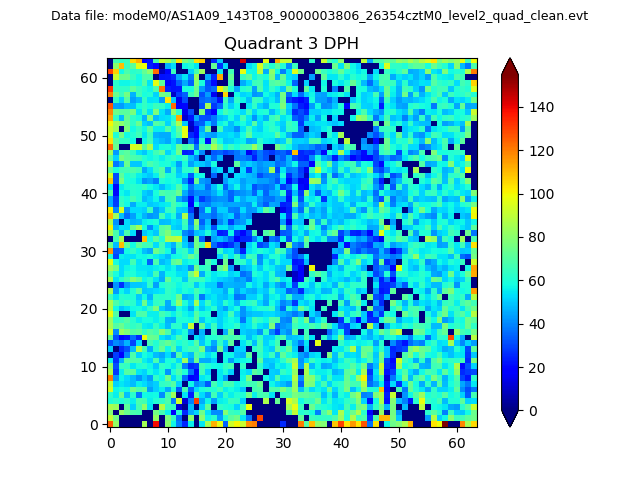 |
 |
Quadrant C |
| Plot type | Count rate plots | Images |
|---|---|---|
| Comparison with Poisson distribution Blue bars denote a histogram of data divided into 1 sec bins. Red curve is a Poisson curve with rate = median count rate of data. |
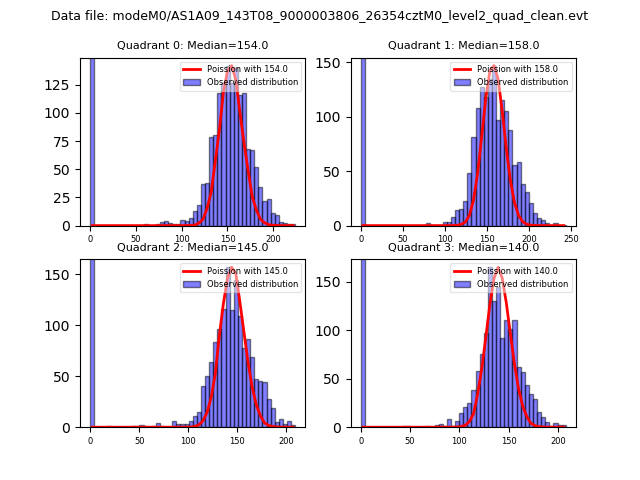 |
 |
| Quadrant-wise count rates Data is divided into 100 sec bins |
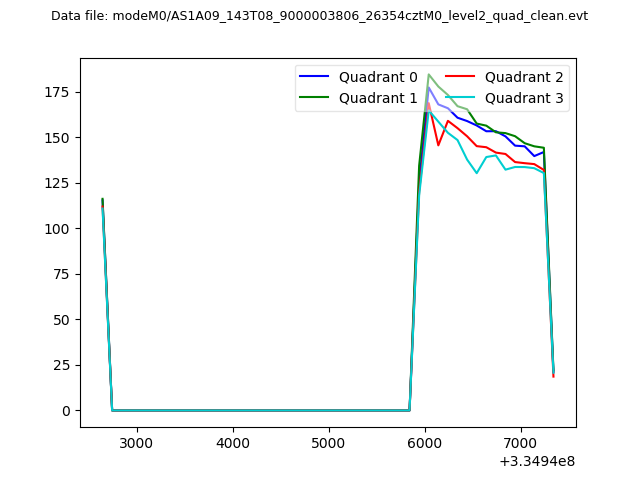 |
|
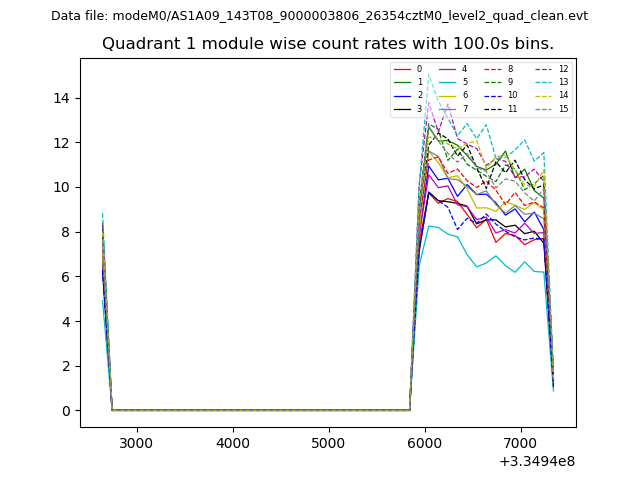
| Module-wise count rates for Quadrant A Data is divided into 100 sec bins |
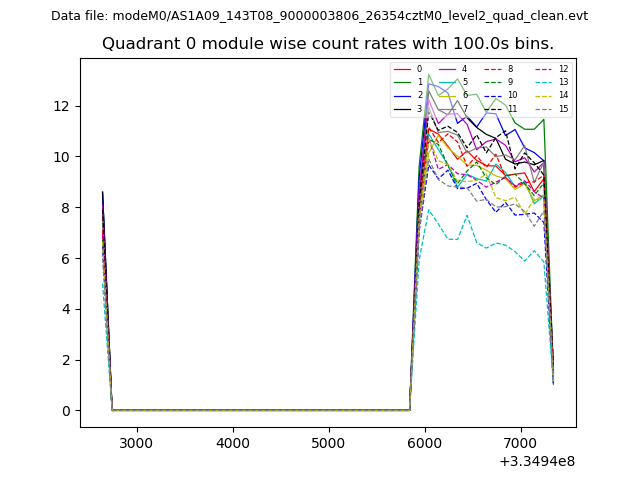 |
 |
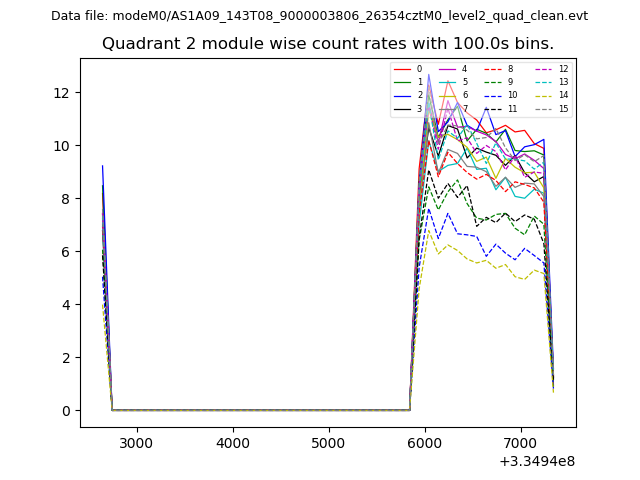
| Module-wise count rates for Quadrant B Data is divided into 100 sec bins |
 |
 |
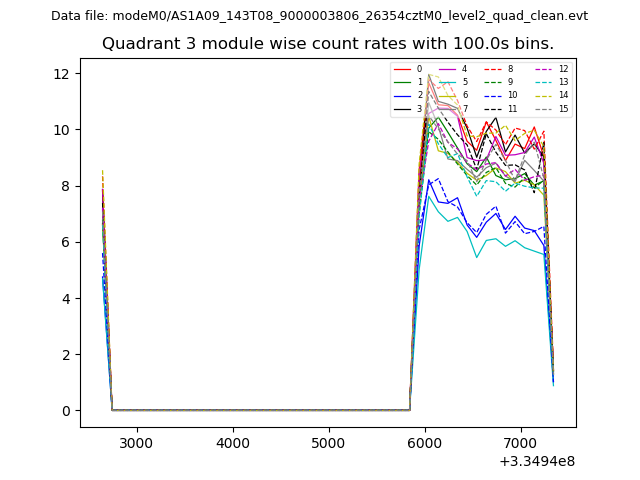
| Module-wise count rates for Quadrant C Data is divided into 100 sec bins |
 |
 |
| Module-wise count rates for Quadrant D Data is divided into 100 sec bins |
 |
 |
| Parameter | Plot |
|---|---|
| CZT HV Monitor | 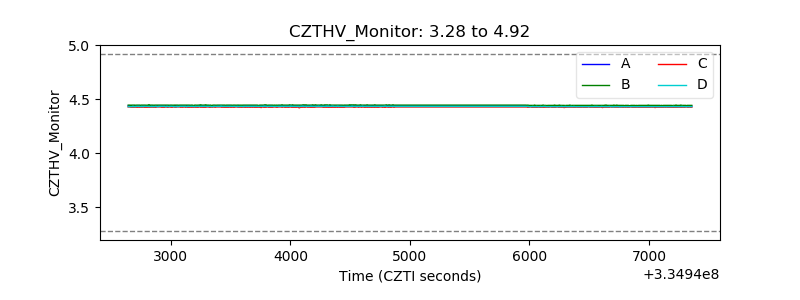 |
| D_VDD | 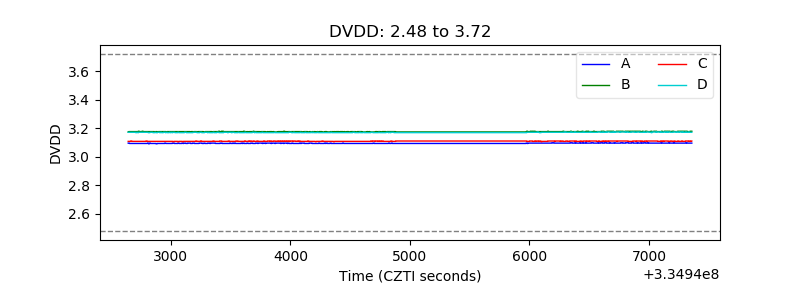 |
| Temperature 1 | 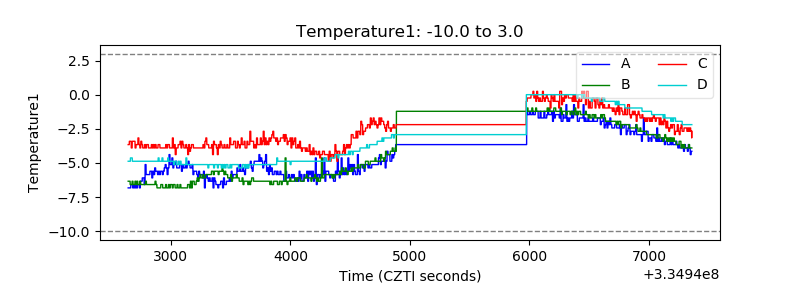 |
| Veto HV Monitor | 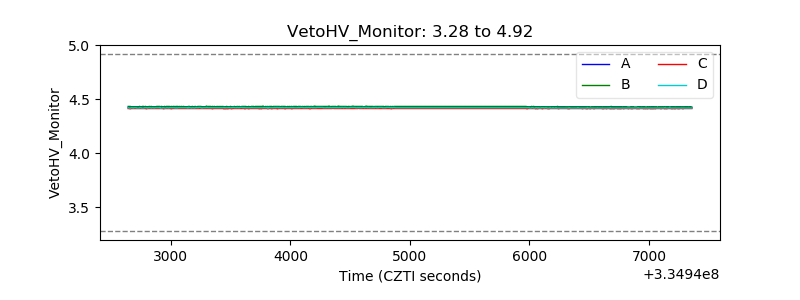 |
| Veto LLD | 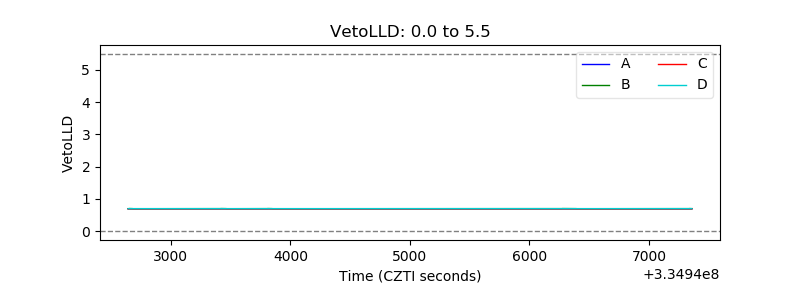 |
| Alpha Counter | 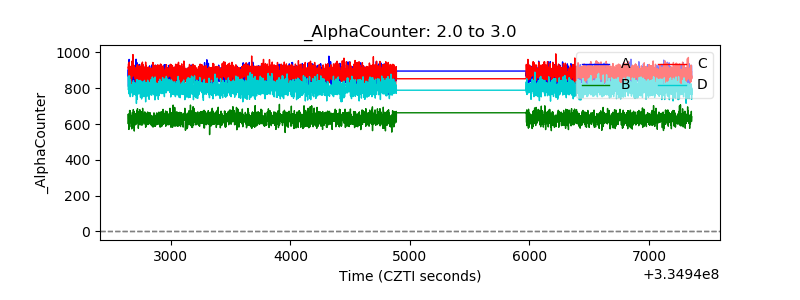 |
| _CPM_Rate | 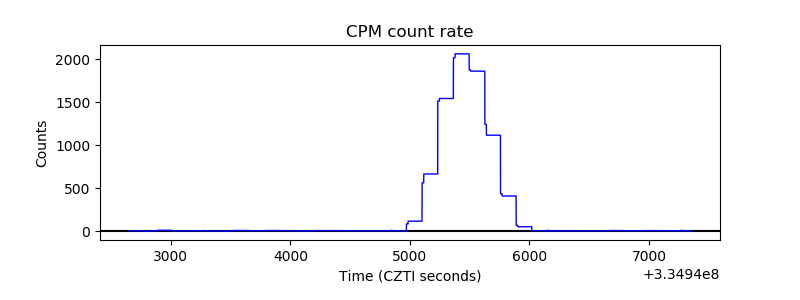 |
| CZT Counter | 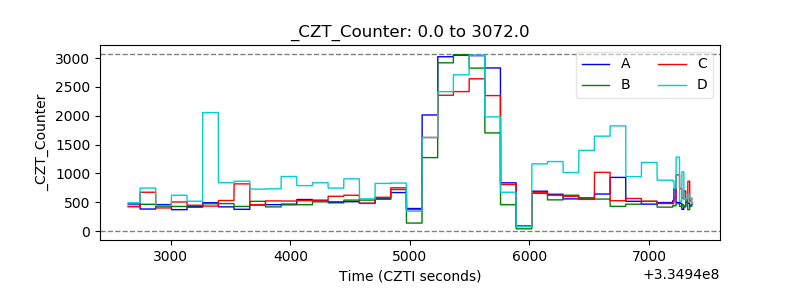 |
| +2.5 Volts monitor |  |
| +5 Volts monitor |  |
| _ROLL_ROT |  |
| _Roll_DEC | 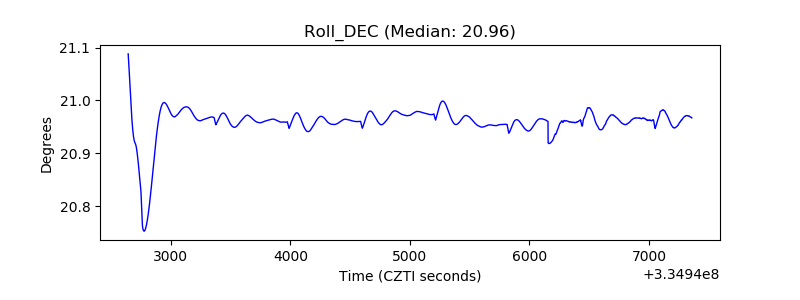 |
| _Roll_RA | 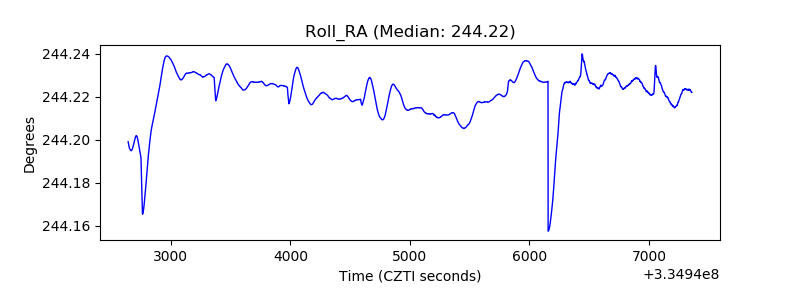 |
| Veto Counter | 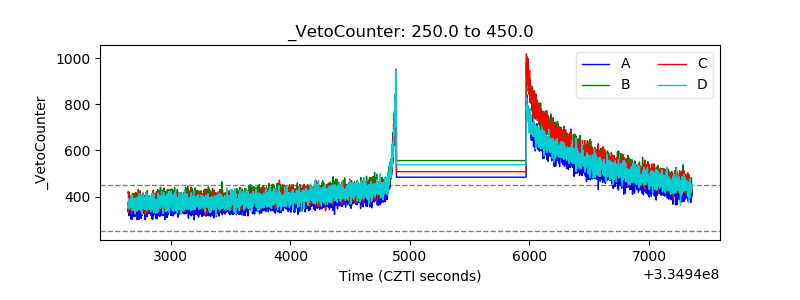 |