| Param | Original file | Final file |
|---|---|---|
| Filename | modeM0/AS1A09_143T08_9000003806_26356cztM0_level2.evt | modeM0/AS1A09_143T08_9000003806_26356cztM0_level2_quad_clean.evt |
| Size (bytes) | 217,008,000 | 53,115,840 |
| Size | 207.0 MB | 50.7 MB |
| Events in quadrant A | 1,379,496 | 366,467 |
| Events in quadrant B | 1,257,135 | 374,661 |
| Events in quadrant C | 1,535,500 | 346,571 |
| Events in quadrant D | 2,226,542 | 339,157 |
| Mode M0 | |||
|---|---|---|---|
| Quadrant | BADHDUFLAG | Total packets | Discarded packets |
| A | 0 | 5818 | 0 |
| B | 0 | 5420 | 0 |
| C | 0 | 6296 | 0 |
| D | 0 | 8426 | 0 |
| Quadrant | Total seconds | Saturated seconds | Saturation percentage |
|---|---|---|---|
| A | 2522 | 33 | 1.308485% |
| B | 2523 | 9 | 0.356718% |
| C | 2523 | 60 | 2.378121% |
| D | 2523 | 102 | 4.042806% |
Noise dominated data is calculated using 1-second bins in cleaned event files. If a bin has >2000 counts, and if more than 50% of those come from <1% of pixels, then it is considered to be noise-dominated and hence unusable.
| Quadrant | # 1 sec bins | Bins with >0 counts | Bins with >2000 counts | High rate bins dominated by noise | Noise dominated (total time) | Noise dominated (detector-on time) | Marked lightcurve |
|---|---|---|---|---|---|---|---|
| A | 2522 | 2522 | 18 | 18 | 0.71% | 0.71% | 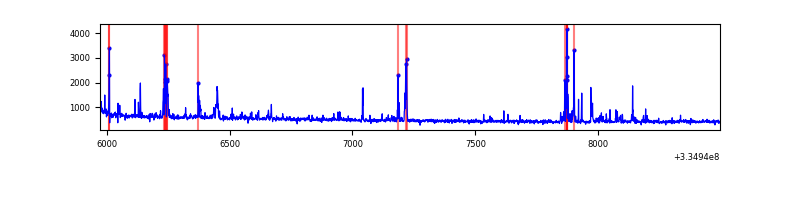 |
| B | 2523 | 2523 | 2 | 2 | 0.08% | 0.08% | 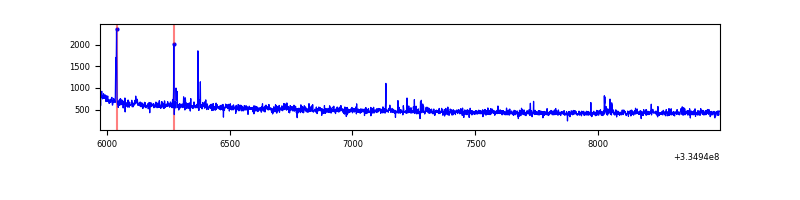 |
| C | 2523 | 2523 | 18 | 18 | 0.71% | 0.71% | 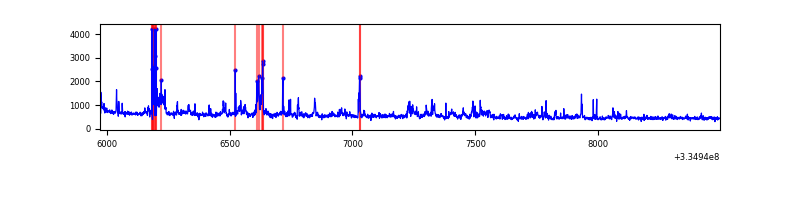 |
| D | 2523 | 2523 | 93 | 93 | 3.69% | 3.69% | 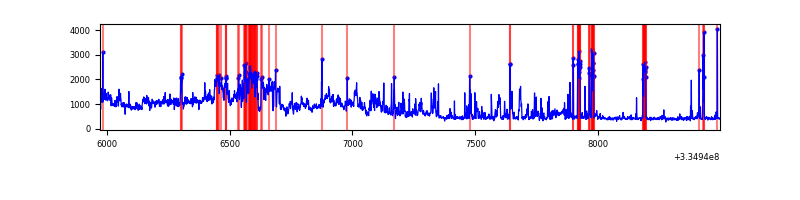 |
Top three noisy pixels from each quadrant. If the there are fewer than three noisy pixels in the level2.evt file, extra rows are filled as -1
| Pixel properties | Quadrant properties | ||||||
|---|---|---|---|---|---|---|---|
| Quadrant | DetID | PixID | Counts | Sigma | Mean | Median | Sigma |
| A | 0 | 13 | 159476 | 2489.41 | 316 | 310 | 63.9 |
| A | 13 | 254 | 4684 | 68.41 | 316 | 310 | 63.9 |
| A | 0 | 226 | 2733 | 37.9 | 316 | 310 | 63.9 |
| B | 12 | 16 | 12022 | 199.01 | 315 | 309 | 58.9 |
| B | 5 | 172 | 8980 | 147.33 | 315 | 309 | 58.9 |
| B | 0 | 230 | 7214 | 117.32 | 315 | 309 | 58.9 |
| C | 3 | 233 | 198388 | 2779.33 | 302 | 304 | 71.3 |
| C | 2 | 16 | 98868 | 1382.96 | 302 | 304 | 71.3 |
| C | 14 | 238 | 47962 | 668.69 | 302 | 304 | 71.3 |
| D | 1 | 52 | 986309 | 13364.75 | 305 | 298 | 73.8 |
| D | 7 | 80 | 39669 | 533.65 | 305 | 298 | 73.8 |
| D | 2 | 234 | 11148 | 147.06 | 305 | 298 | 73.8 |
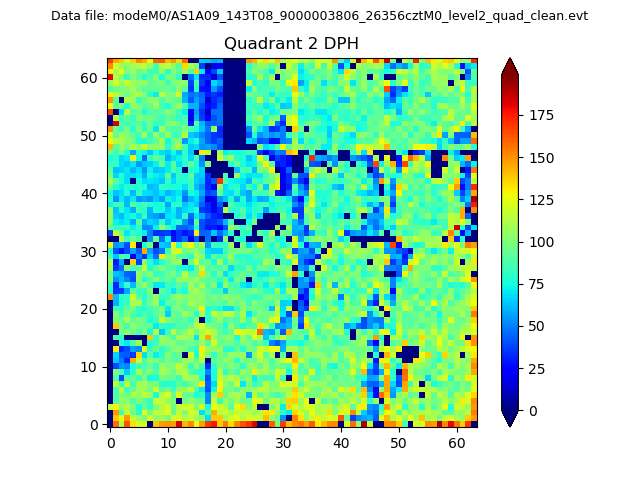
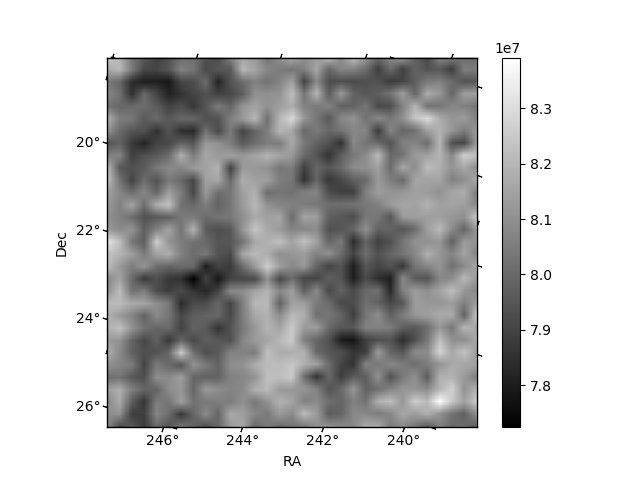
Histogram calculated using DETX and DETY for each event in the final _common_clean file
| Quadrant A | 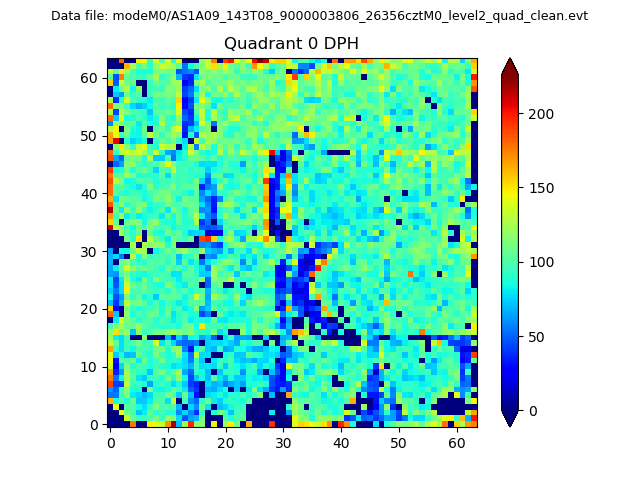 |
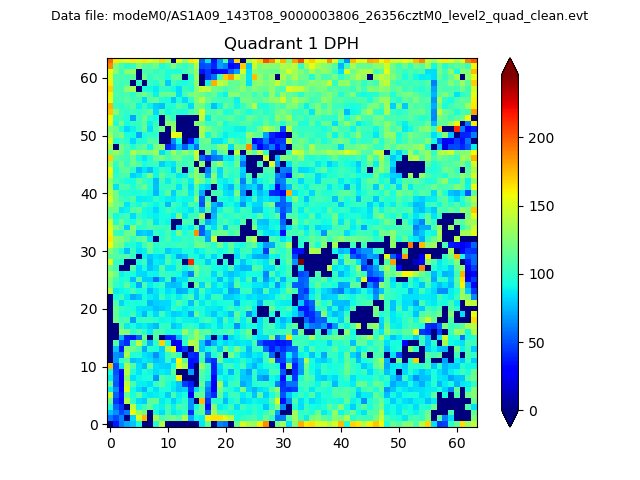 |
Quadrant B |
|---|---|---|---|
| Quadrant D | 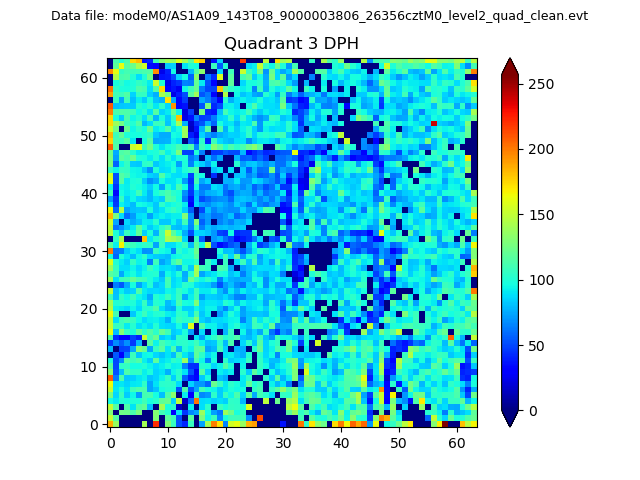 |
 |
Quadrant C |
| Plot type | Count rate plots | Images |
|---|---|---|
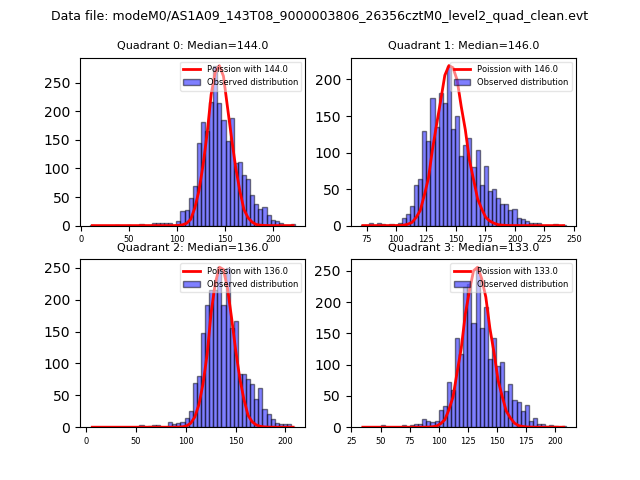
| Comparison with Poisson distribution Blue bars denote a histogram of data divided into 1 sec bins. Red curve is a Poisson curve with rate = median count rate of data. |
 |
 |
| Quadrant-wise count rates Data is divided into 100 sec bins |
 |
|
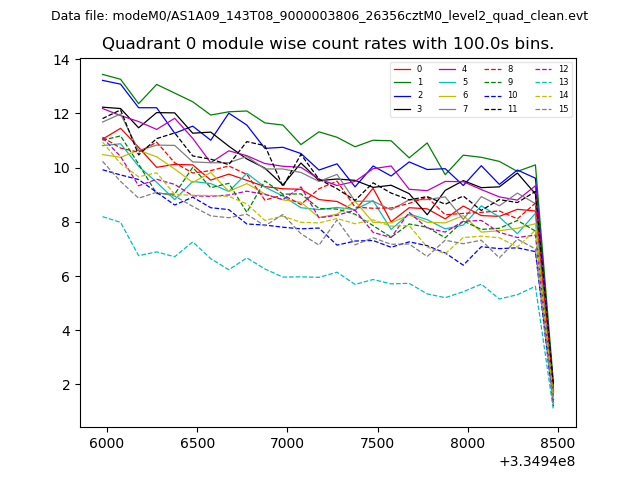
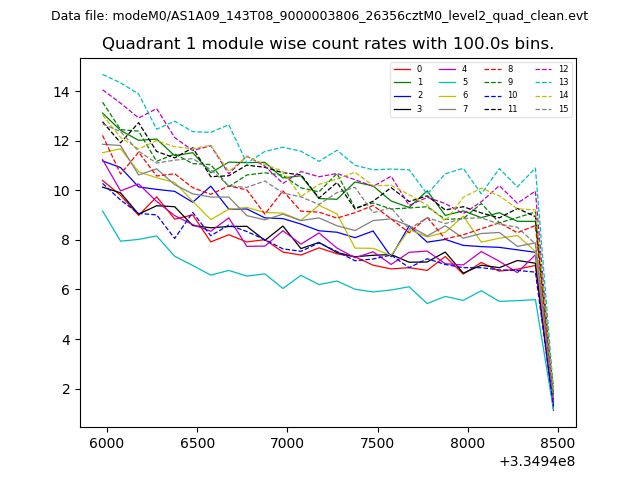
| Module-wise count rates for Quadrant A Data is divided into 100 sec bins |
 |
 |
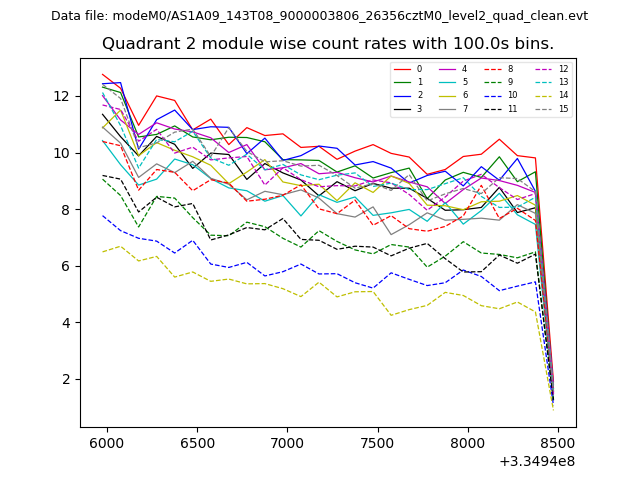
| Module-wise count rates for Quadrant B Data is divided into 100 sec bins |
 |
 |
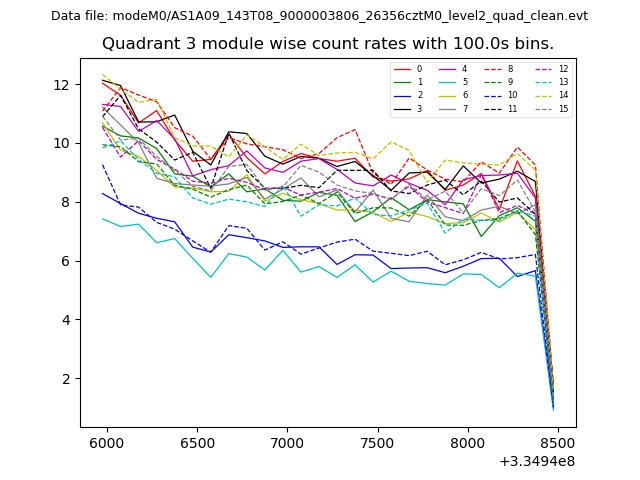
| Module-wise count rates for Quadrant C Data is divided into 100 sec bins |
 |
 |
| Module-wise count rates for Quadrant D Data is divided into 100 sec bins |
 |
 |
| Parameter | Plot |
|---|---|
| CZT HV Monitor | 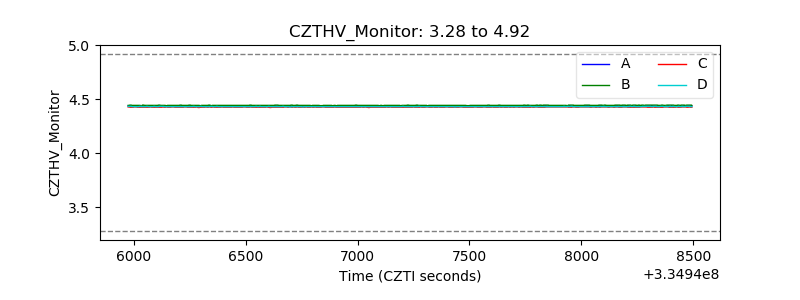 |
| D_VDD | 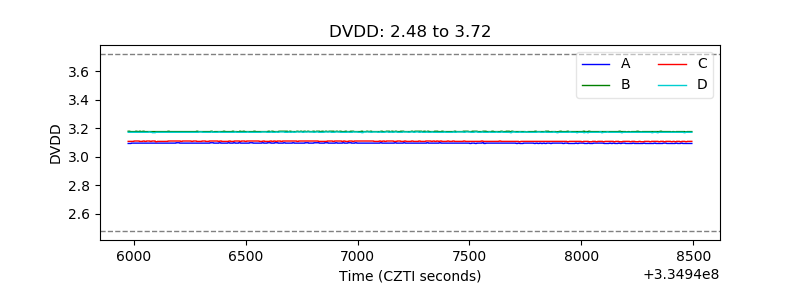 |
| Temperature 1 | 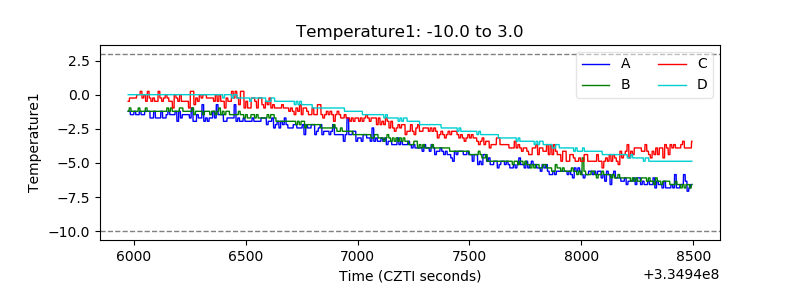 |
| Veto HV Monitor | 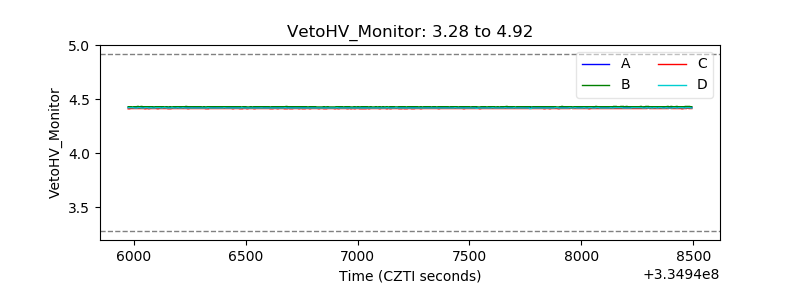 |
| Veto LLD | 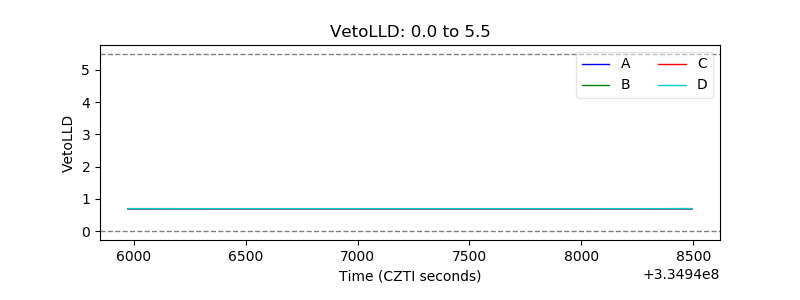 |
| Alpha Counter | 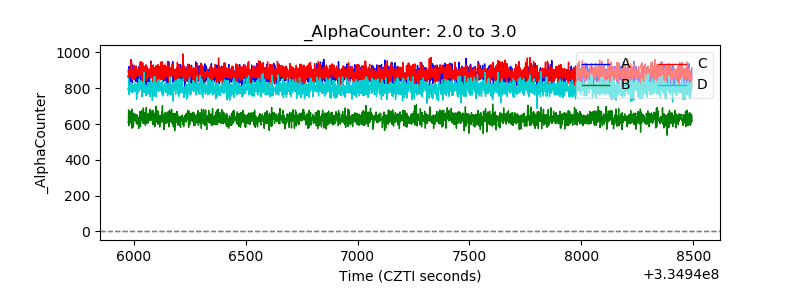 |
| _CPM_Rate | 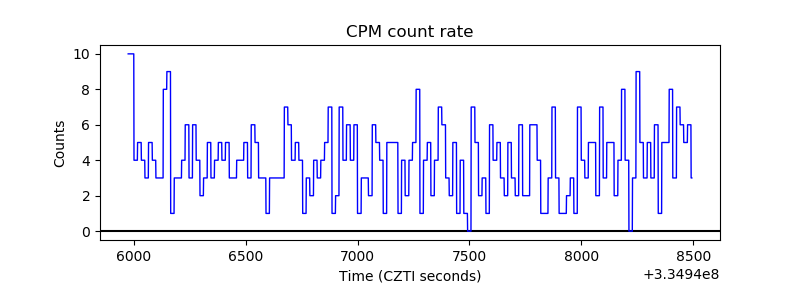 |
| CZT Counter | 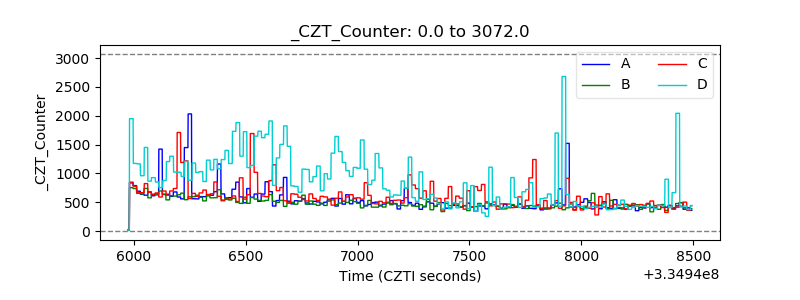 |
| +2.5 Volts monitor |  |
| +5 Volts monitor |  |
| _ROLL_ROT | 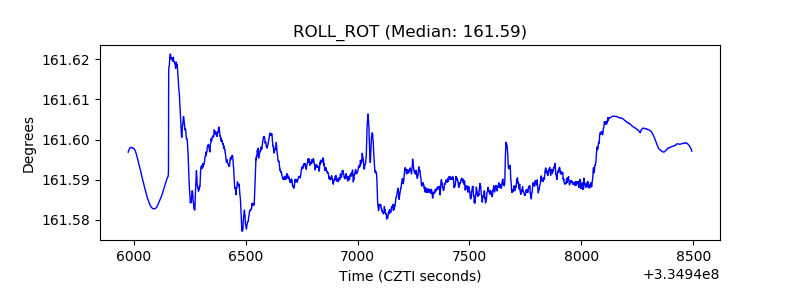 |
| _Roll_DEC |  |
| _Roll_RA | 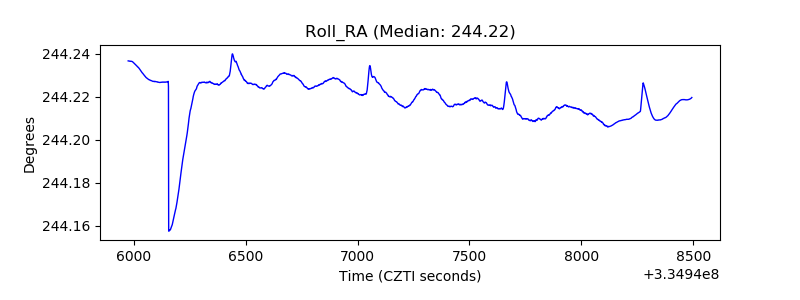 |
| Veto Counter | 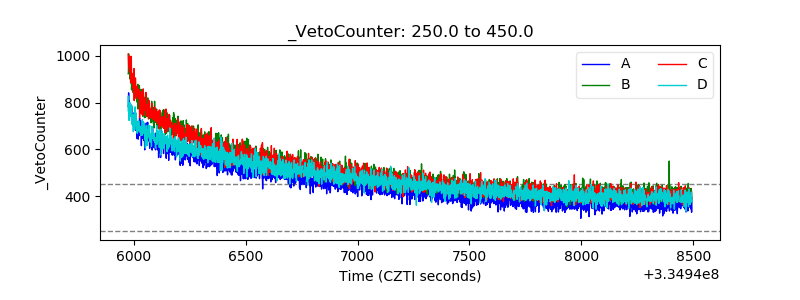 |