| Param | Original file | Final file |
|---|---|---|
| Filename | modeM0/AS1A09_008T02_9000003810cztM0_level2.fits | modeM0/AS1A09_008T02_9000003810cztM0_level2_quad_clean.evt |
| Size (bytes) | 68,371,200 | 63,910,080 |
| Size | 65.2 MB | 60.9 MB |
| Events in quadrant A | 424,710 | 382,992 |
| Events in quadrant B | 409,992 | 396,127 |
| Events in quadrant C | 417,474 | 368,153 |
| Events in quadrant D | 342,456 | 311,486 |
| Mode SS | |||
|---|---|---|---|
| Quadrant | BADHDUFLAG | Total packets | Discarded packets |
| A | 0 | 138 | 0 |
| B | 0 | 138 | 0 |
| C | 0 | 138 | 0 |
| D | 0 | 138 | 0 |
| Mode M0 | |||
|---|---|---|---|
| Quadrant | BADHDUFLAG | Total packets | Discarded packets |
| A | 0 | 14339 | 0 |
| B | 0 | 14094 | 0 |
| C | 0 | 15919 | 0 |
| D | 0 | 26306 | 0 |
| Mode M9 | |||
|---|---|---|---|
| Quadrant | BADHDUFLAG | Total packets | Discarded packets |
| A | 0 | 13 | 0 |
| B | 0 | 13 | 0 |
| C | 0 | 13 | 0 |
| D | 0 | 13 | 0 |
| Quadrant | Total seconds | Saturated seconds | Saturation percentage |
|---|---|---|---|
| A | 6831 | 47 | 0.688040% |
| B | 6831 | 21 | 0.307422% |
| C | 6831 | 200 | 2.927829% |
| D | 6831 | 1047 | 15.327185% |
Noise dominated data is calculated using 1-second bins in cleaned event files. If a bin has >2000 counts, and if more than 50% of those come from <1% of pixels, then it is considered to be noise-dominated and hence unusable.
| Quadrant | # 1 sec bins | Bins with >0 counts | Bins with >2000 counts | High rate bins dominated by noise | Noise dominated (total time) | Noise dominated (detector-on time) | Marked lightcurve |
|---|---|---|---|---|---|---|---|
| A | 8131 | 6831 | 0 | 0 | 0.00% | 0.00% |  |
| B | 8131 | 6831 | 0 | 0 | 0.00% | 0.00% | 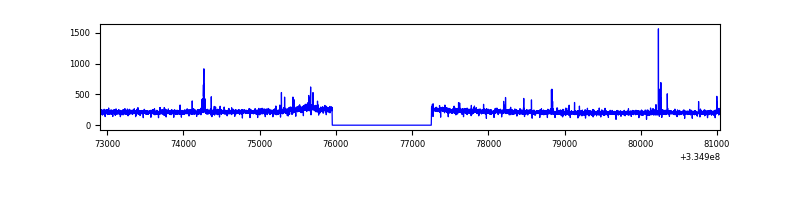 |
| C | 8131 | 6831 | 0 | 0 | 0.00% | 0.00% |  |
| D | 8131 | 6823 | 0 | 0 | 0.00% | 0.00% | 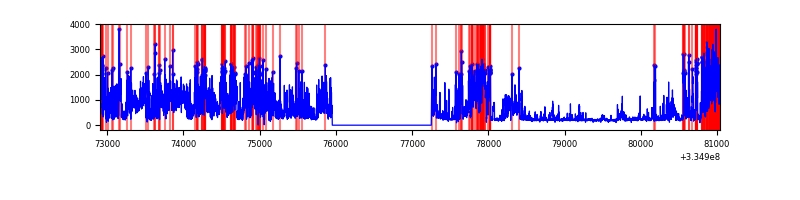 |
Top three noisy pixels from each quadrant. If the there are fewer than three noisy pixels in the level2.evt file, extra rows are filled as -1
| Pixel properties | Quadrant properties | ||||||
|---|---|---|---|---|---|---|---|
| Quadrant | DetID | PixID | Counts | Sigma | Mean | Median | Sigma |
| A | 0 | 29 | 346 | 8.33 | 110 | 105 | 28.9 |
| A | 9 | 19 | 329 | 7.74 | 110 | 105 | 28.9 |
| A | 14 | 79 | 325 | 7.61 | 110 | 105 | 28.9 |
| B | 2 | 9 | 351 | 10.43 | 108 | 104 | 23.7 |
| B | 3 | 80 | 308 | 8.62 | 108 | 104 | 23.7 |
| B | 2 | 8 | 289 | 7.81 | 108 | 104 | 23.7 |
| C | 1 | 80 | 337 | 7.93 | 110 | 104 | 29.4 |
| C | 1 | 81 | 327 | 7.59 | 110 | 104 | 29.4 |
| C | 3 | 126 | 297 | 6.57 | 110 | 104 | 29.4 |
| D | 4 | 246 | 266 | 6.51 | 97 | 89 | 27.2 |
| D | 6 | 67 | 265 | 6.47 | 97 | 89 | 27.2 |
| D | 15 | 46 | 259 | 6.25 | 97 | 89 | 27.2 |
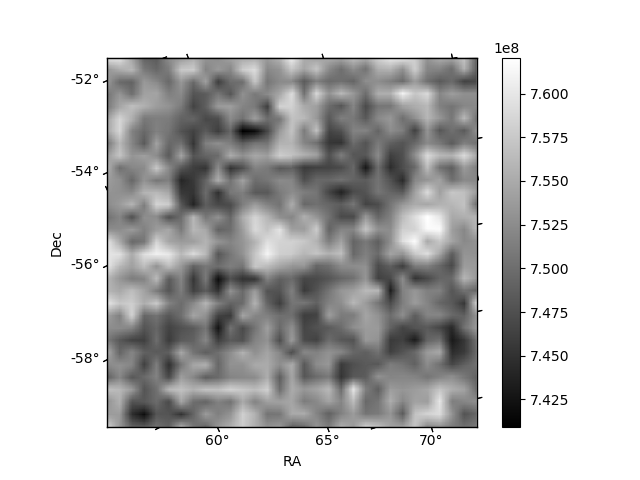
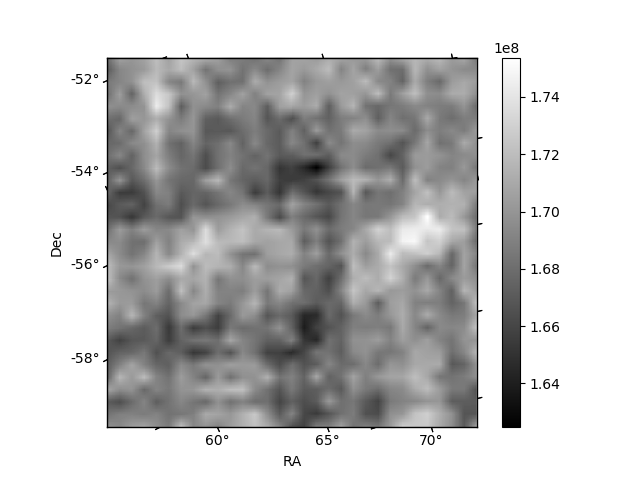
Histogram calculated using DETX and DETY for each event in the final _common_clean file
| Quadrant A |  |
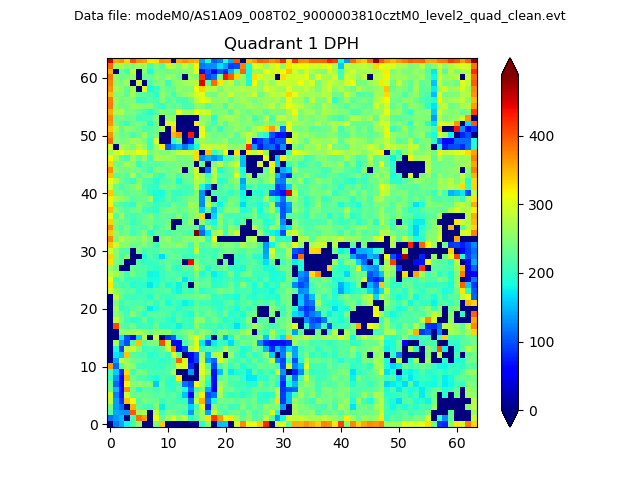 |
Quadrant B |
|---|---|---|---|
| Quadrant D | 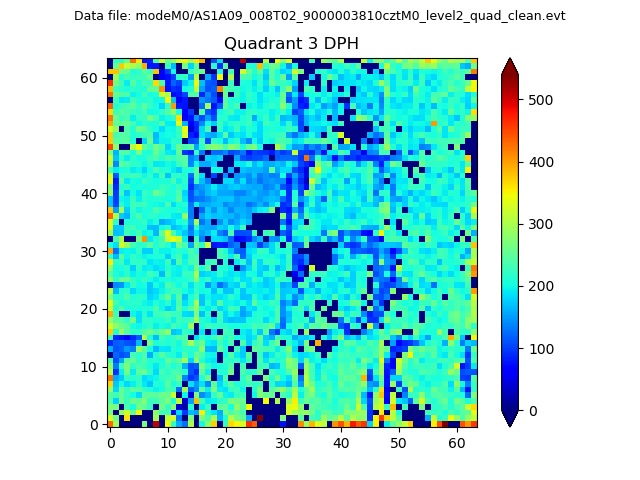 |
 |
Quadrant C |
| Plot type | Count rate plots | Images |
|---|---|---|
| Comparison with Poisson distribution Blue bars denote a histogram of data divided into 1 sec bins. Red curve is a Poisson curve with rate = median count rate of data. |
 |
 |
| Quadrant-wise count rates Data is divided into 100 sec bins |
 |
|
| Module-wise count rates for Quadrant A Data is divided into 100 sec bins |
 |
 |
| Module-wise count rates for Quadrant B Data is divided into 100 sec bins |
 |
 |
| Module-wise count rates for Quadrant C Data is divided into 100 sec bins |
 |
 |
| Module-wise count rates for Quadrant D Data is divided into 100 sec bins |
 |
 |
| Parameter | Plot |
|---|---|
| CZT HV Monitor | 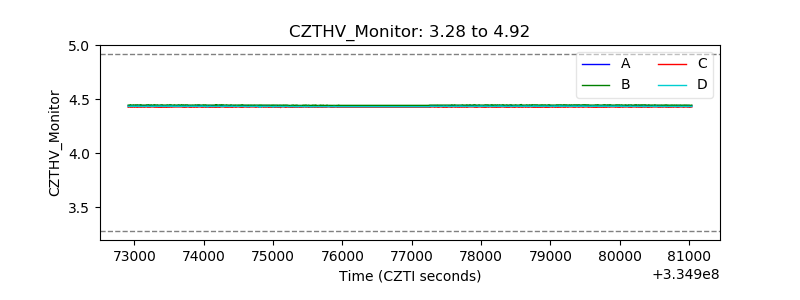 |
| D_VDD | 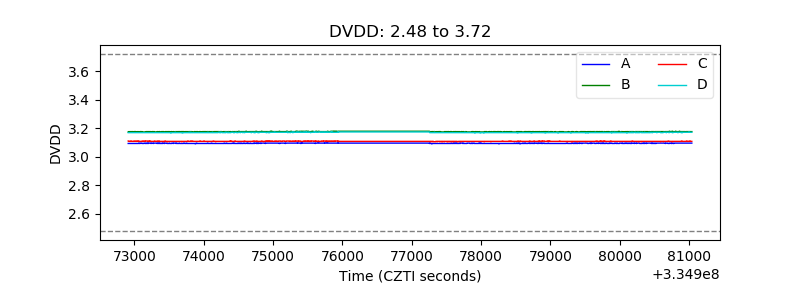 |
| Temperature 1 |  |
| Veto HV Monitor | 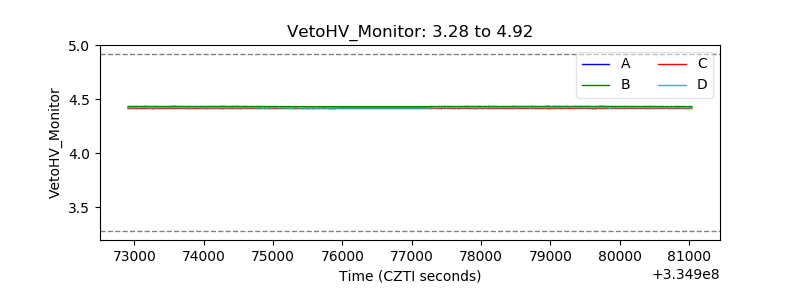 |
| Veto LLD |  |
| Alpha Counter |  |
| _CPM_Rate |  |
| CZT Counter |  |
| +2.5 Volts monitor |  |
| +5 Volts monitor |  |
| _ROLL_ROT |  |
| _Roll_DEC |  |
| _Roll_RA |  |
| Veto Counter |  |