| Param | Original file | Final file |
|---|---|---|
| Filename | modeM0/AS1A09_008T02_9000003810_26360cztM0_level2.evt | modeM0/AS1A09_008T02_9000003810_26360cztM0_level2_quad_clean.evt |
| Size (bytes) | 409,780,800 | 76,587,840 |
| Size | 390.8 MB | 73.0 MB |
| Events in quadrant A | 2,194,630 | 512,480 |
| Events in quadrant B | 2,122,372 | 533,752 |
| Events in quadrant C | 2,381,351 | 513,422 |
| Events in quadrant D | 5,419,863 | 456,902 |
| Mode M0 | |||
|---|---|---|---|
| Quadrant | BADHDUFLAG | Total packets | Discarded packets |
| A | 0 | 9231 | 0 |
| B | 0 | 8998 | 0 |
| C | 0 | 9597 | 0 |
| D | 0 | 19075 | 0 |
| Mode M9 | |||
|---|---|---|---|
| Quadrant | BADHDUFLAG | Total packets | Discarded packets |
| A | 0 | 13 | 0 |
| B | 0 | 13 | 0 |
| C | 0 | 13 | 0 |
| D | 0 | 13 | 0 |
| Quadrant | Total seconds | Saturated seconds | Saturation percentage |
|---|---|---|---|
| A | 4297 | 45 | 1.047242% |
| B | 4297 | 18 | 0.418897% |
| C | 4297 | 83 | 1.931580% |
| D | 4297 | 828 | 19.269258% |
Noise dominated data is calculated using 1-second bins in cleaned event files. If a bin has >2000 counts, and if more than 50% of those come from <1% of pixels, then it is considered to be noise-dominated and hence unusable.
| Quadrant | # 1 sec bins | Bins with >0 counts | Bins with >2000 counts | High rate bins dominated by noise | Noise dominated (total time) | Noise dominated (detector-on time) | Marked lightcurve |
|---|---|---|---|---|---|---|---|
| A | 5597 | 4298 | 18 | 18 | 0.32% | 0.42% | 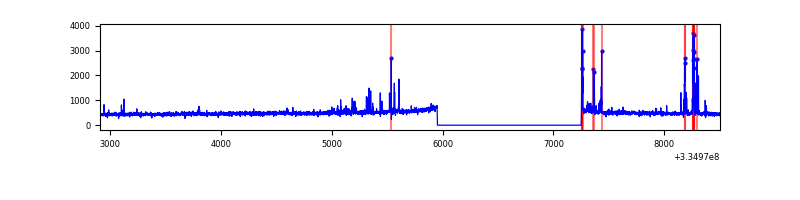 |
| B | 5597 | 4298 | 0 | 0 | 0.00% | 0.00% | 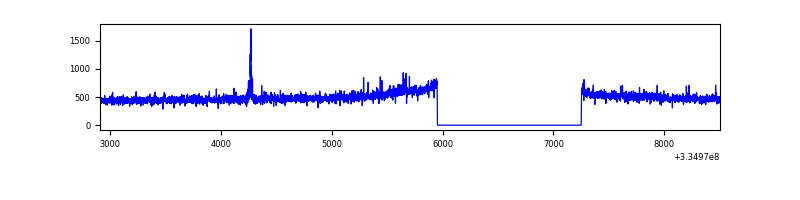 |
| C | 5597 | 4298 | 19 | 19 | 0.34% | 0.44% | 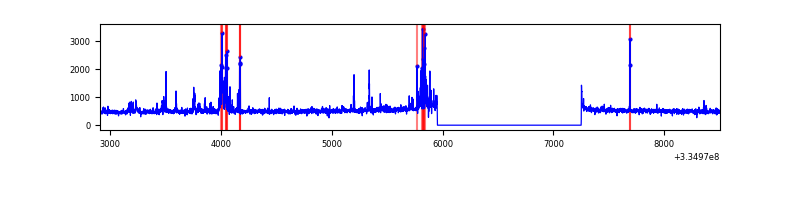 |
| D | 5597 | 4298 | 667 | 667 | 11.92% | 15.52% | 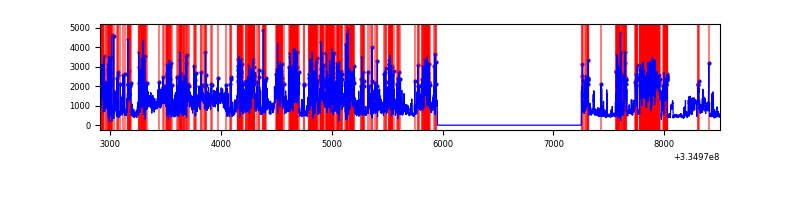 |
Top three noisy pixels from each quadrant. If the there are fewer than three noisy pixels in the level2.evt file, extra rows are filled as -1
| Pixel properties | Quadrant properties | ||||||
|---|---|---|---|---|---|---|---|
| Quadrant | DetID | PixID | Counts | Sigma | Mean | Median | Sigma |
| A | 0 | 13 | 137535 | 1283.74 | 532 | 522 | 106.7 |
| A | 13 | 254 | 6609 | 57.03 | 532 | 522 | 106.7 |
| A | 6 | 16 | 5223 | 44.05 | 532 | 522 | 106.7 |
| B | 0 | 230 | 32672 | 318.33 | 534 | 520 | 101.0 |
| B | 12 | 111 | 11712 | 110.81 | 534 | 520 | 101.0 |
| B | 11 | 111 | 10454 | 98.35 | 534 | 520 | 101.0 |
| C | 3 | 233 | 102337 | 841.82 | 521 | 524 | 120.9 |
| C | 4 | 254 | 99098 | 815.04 | 521 | 524 | 120.9 |
| C | 14 | 238 | 84141 | 691.37 | 521 | 524 | 120.9 |
| D | 7 | 80 | 2879083 | 24884.67 | 490 | 477 | 115.7 |
| D | 1 | 52 | 527993 | 4560.21 | 490 | 477 | 115.7 |
| D | 11 | 176 | 135904 | 1170.73 | 490 | 477 | 115.7 |
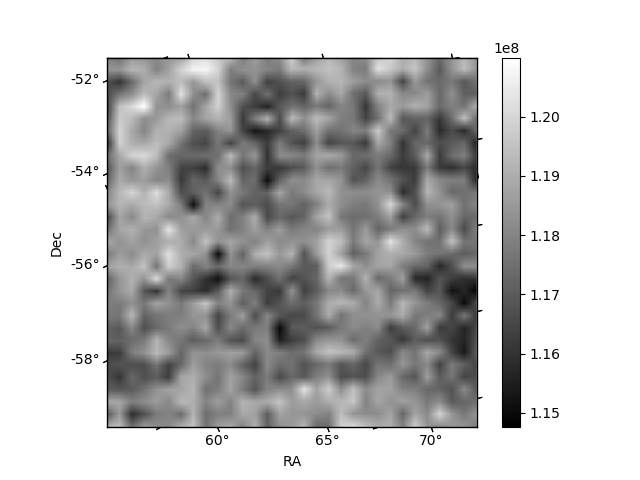
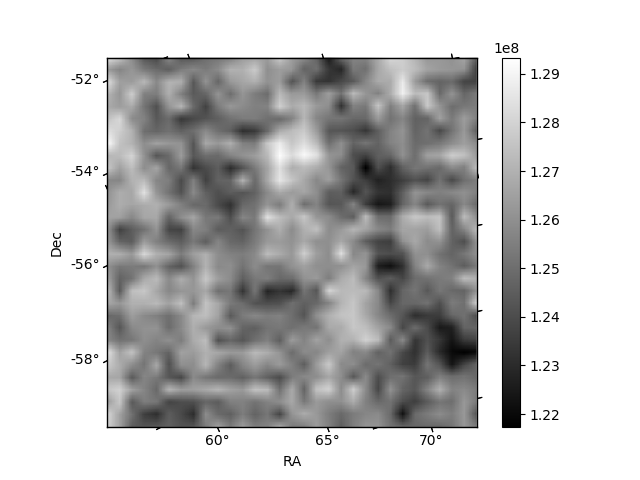
Histogram calculated using DETX and DETY for each event in the final _common_clean file
| Quadrant A | 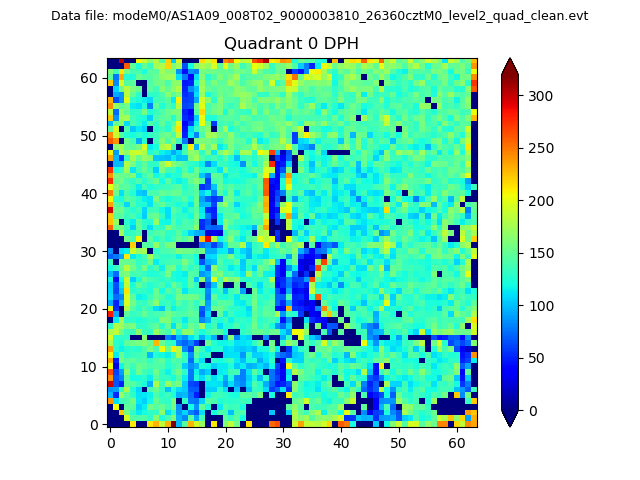 |
 |
Quadrant B |
|---|---|---|---|
| Quadrant D |  |
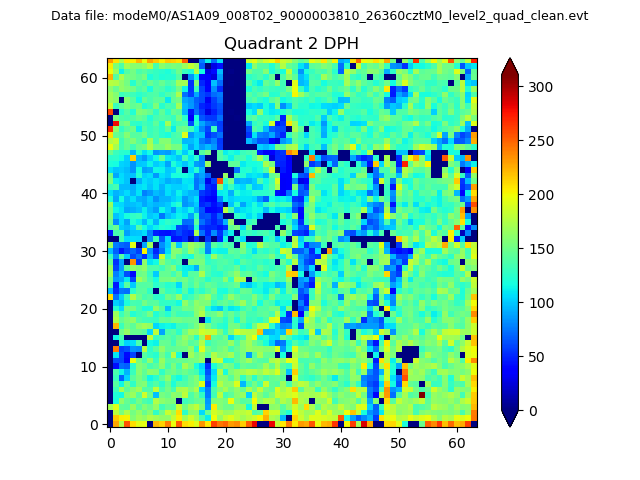 |
Quadrant C |
| Plot type | Count rate plots | Images |
|---|---|---|
| Comparison with Poisson distribution Blue bars denote a histogram of data divided into 1 sec bins. Red curve is a Poisson curve with rate = median count rate of data. |
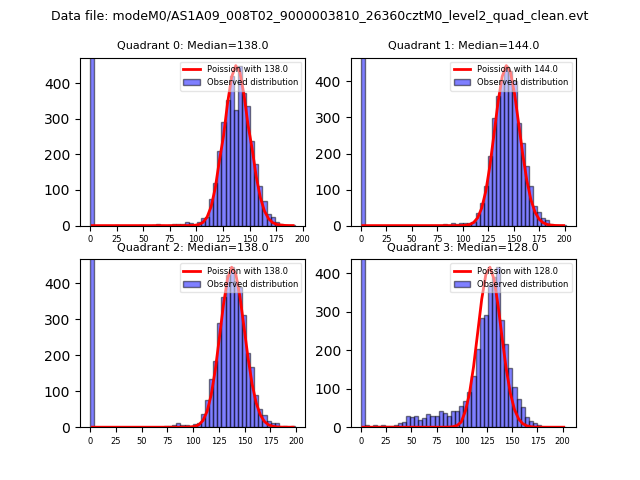 |
 |
| Quadrant-wise count rates Data is divided into 100 sec bins |
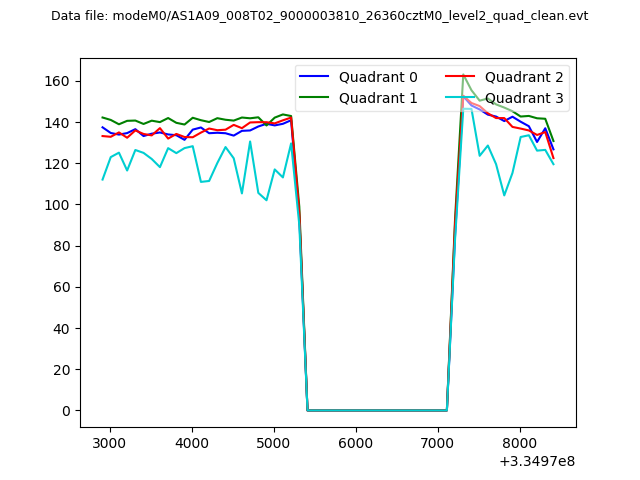 |
|
| Module-wise count rates for Quadrant A Data is divided into 100 sec bins |
 |
 |
| Module-wise count rates for Quadrant B Data is divided into 100 sec bins |
 |
 |
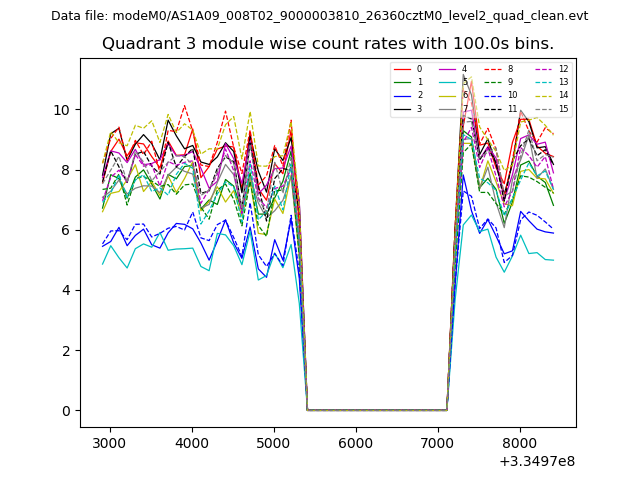
| Module-wise count rates for Quadrant C Data is divided into 100 sec bins |
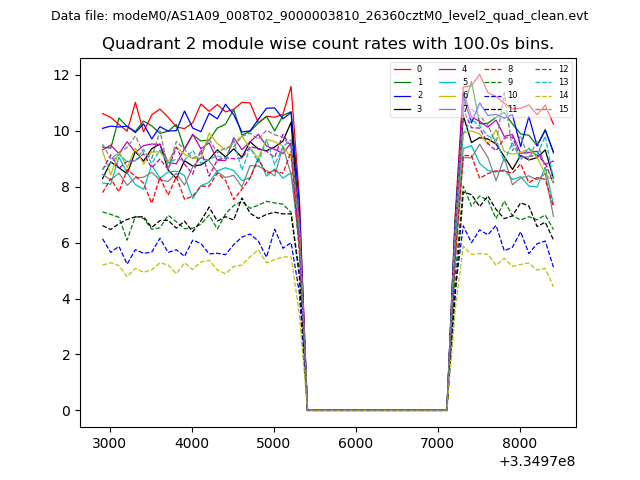 |
 |
| Module-wise count rates for Quadrant D Data is divided into 100 sec bins |
 |
 |
| Parameter | Plot |
|---|---|
| CZT HV Monitor |  |
| D_VDD | 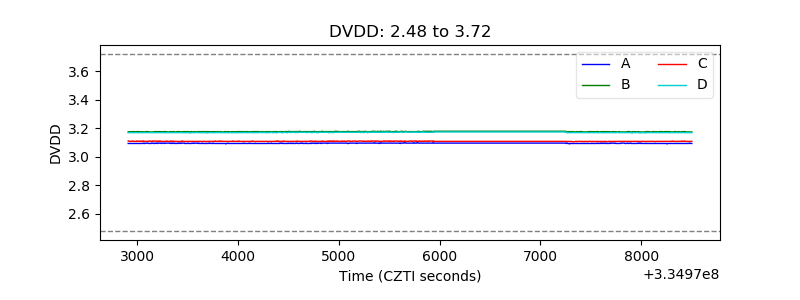 |
| Temperature 1 | 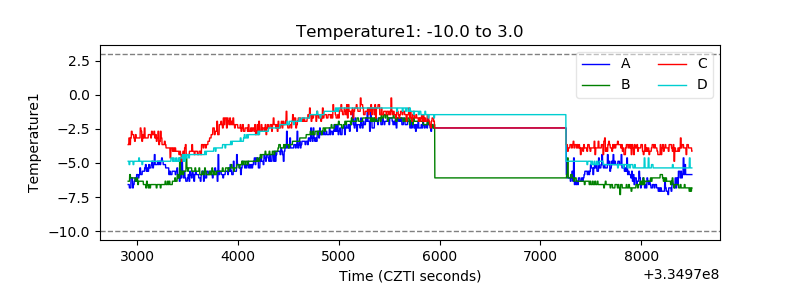 |
| Veto HV Monitor | 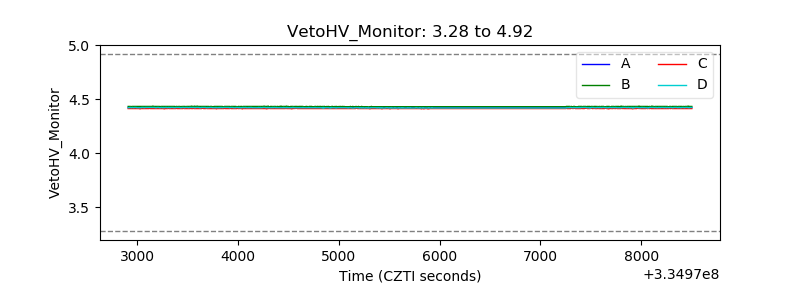 |
| Veto LLD | 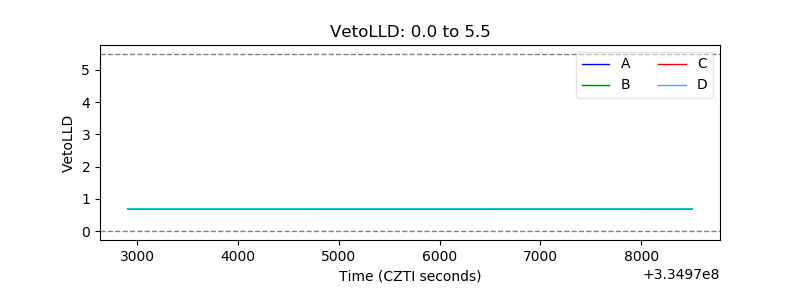 |
| Alpha Counter | 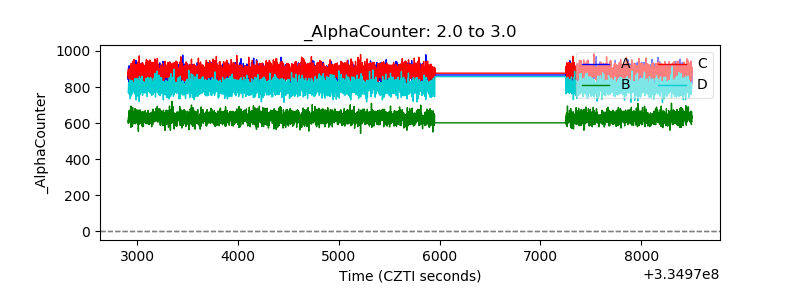 |
| _CPM_Rate | 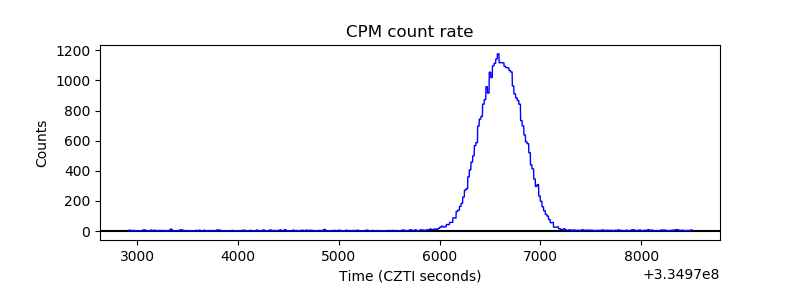 |
| CZT Counter | 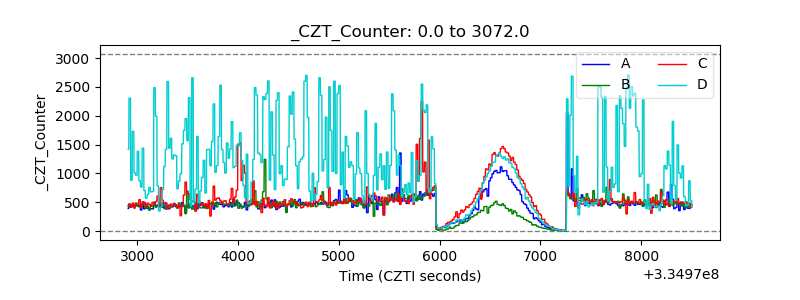 |
| +2.5 Volts monitor | 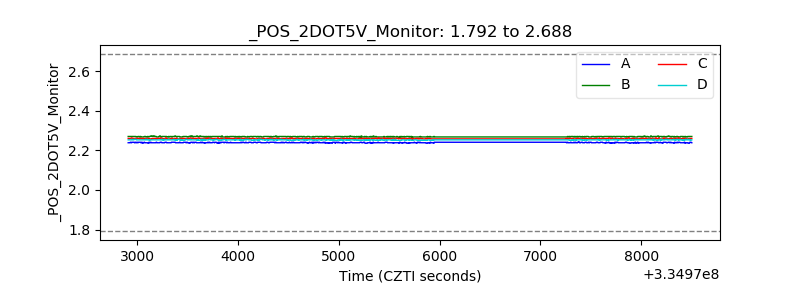 |
| +5 Volts monitor | 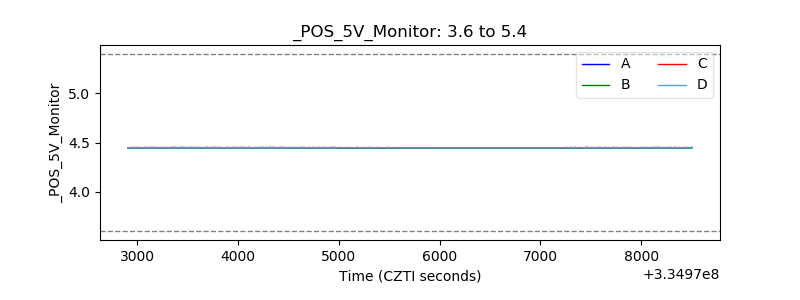 |
| _ROLL_ROT |  |
| _Roll_DEC | 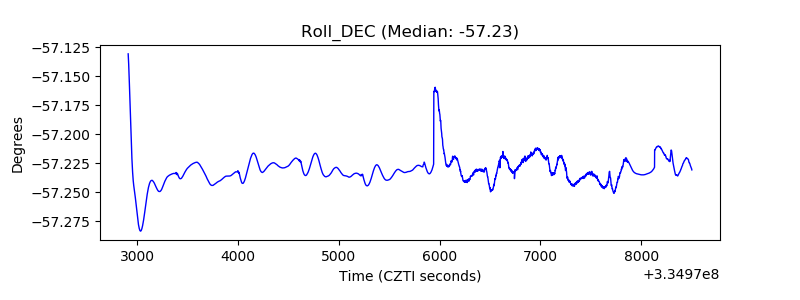 |
| _Roll_RA | 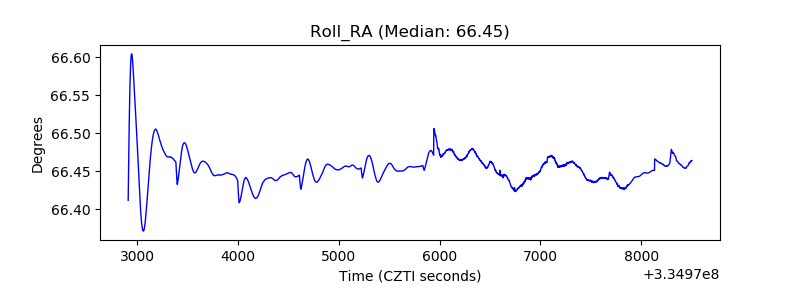 |
| Veto Counter | 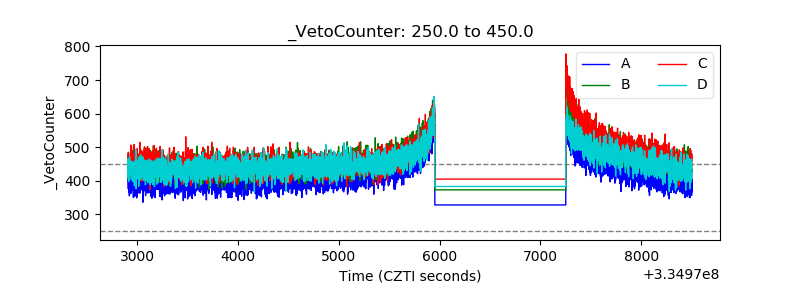 |