| Param | Original file | Final file |
|---|---|---|
| Filename | modeM0/AS1A09_008T02_9000003810_26361cztM0_level2.evt | modeM0/AS1A09_008T02_9000003810_26361cztM0_level2_quad_clean.evt |
| Size (bytes) | 317,727,360 | 75,124,800 |
| Size | 303.0 MB | 71.6 MB |
| Events in quadrant A | 1,871,172 | 505,193 |
| Events in quadrant B | 1,806,837 | 525,917 |
| Events in quadrant C | 2,312,072 | 499,013 |
| Events in quadrant D | 3,367,774 | 471,184 |
| Mode M0 | |||
|---|---|---|---|
| Quadrant | BADHDUFLAG | Total packets | Discarded packets |
| A | 0 | 8199 | 0 |
| B | 0 | 7914 | 0 |
| C | 0 | 9214 | 0 |
| D | 0 | 12638 | 0 |
| Mode M9 | |||
|---|---|---|---|
| Quadrant | BADHDUFLAG | Total packets | Discarded packets |
| A | 0 | 13 | 0 |
| B | 0 | 13 | 0 |
| C | 0 | 13 | 0 |
| D | 0 | 13 | 0 |
| Quadrant | Total seconds | Saturated seconds | Saturation percentage |
|---|---|---|---|
| A | 3873 | 36 | 0.929512% |
| B | 3873 | 14 | 0.361477% |
| C | 3873 | 153 | 3.950426% |
| D | 3874 | 463 | 11.951471% |
Noise dominated data is calculated using 1-second bins in cleaned event files. If a bin has >2000 counts, and if more than 50% of those come from <1% of pixels, then it is considered to be noise-dominated and hence unusable.
| Quadrant | # 1 sec bins | Bins with >0 counts | Bins with >2000 counts | High rate bins dominated by noise | Noise dominated (total time) | Noise dominated (detector-on time) | Marked lightcurve |
|---|---|---|---|---|---|---|---|
| A | 5173 | 3874 | 18 | 18 | 0.35% | 0.46% | 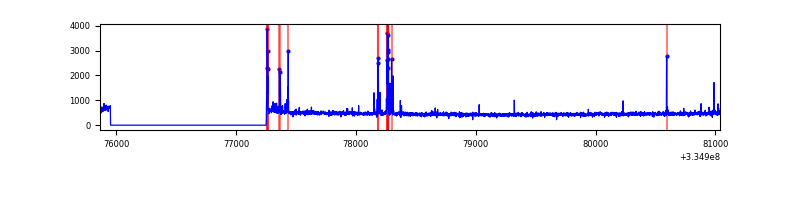 |
| B | 5173 | 3874 | 1 | 1 | 0.02% | 0.03% | 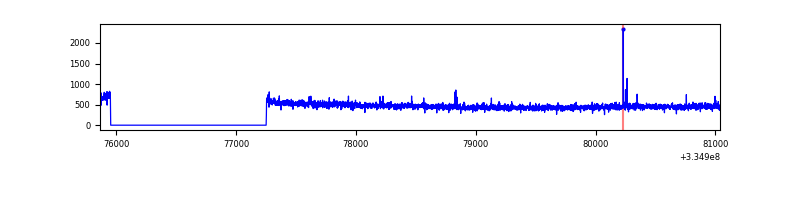 |
| C | 5173 | 3874 | 79 | 79 | 1.53% | 2.04% | 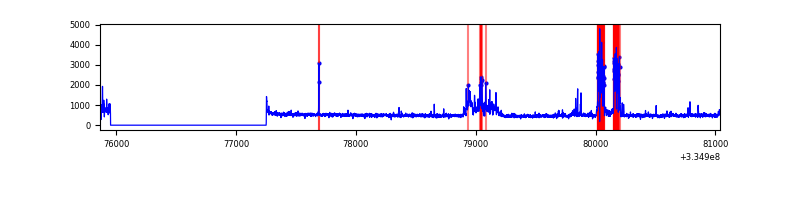 |
| D | 5174 | 3875 | 399 | 399 | 7.71% | 10.30% | 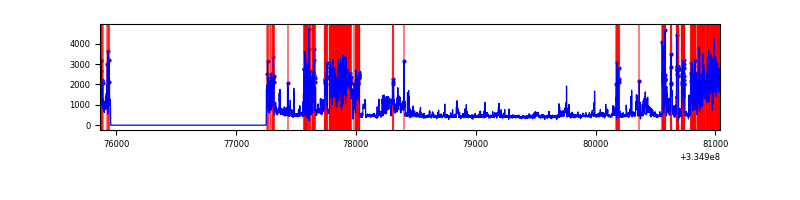 |
Top three noisy pixels from each quadrant. If the there are fewer than three noisy pixels in the level2.evt file, extra rows are filled as -1
| Pixel properties | Quadrant properties | ||||||
|---|---|---|---|---|---|---|---|
| Quadrant | DetID | PixID | Counts | Sigma | Mean | Median | Sigma |
| A | 0 | 13 | 111757 | 1215.93 | 455 | 446 | 91.5 |
| A | 13 | 254 | 5580 | 56.08 | 455 | 446 | 91.5 |
| A | 3 | 137 | 4132 | 40.26 | 455 | 446 | 91.5 |
| B | 12 | 111 | 9889 | 108.98 | 459 | 448 | 86.6 |
| B | 11 | 111 | 9034 | 99.11 | 459 | 448 | 86.6 |
| B | 14 | 111 | 8532 | 93.32 | 459 | 448 | 86.6 |
| C | 3 | 233 | 465229 | 4454.86 | 447 | 451 | 104.3 |
| C | 14 | 238 | 72333 | 688.98 | 447 | 451 | 104.3 |
| C | 4 | 254 | 24205 | 227.68 | 447 | 451 | 104.3 |
| D | 7 | 80 | 1007787 | 9777.2 | 434 | 424 | 103.0 |
| D | 1 | 52 | 643918 | 6245.58 | 434 | 424 | 103.0 |
| D | 11 | 176 | 48204 | 463.74 | 434 | 424 | 103.0 |
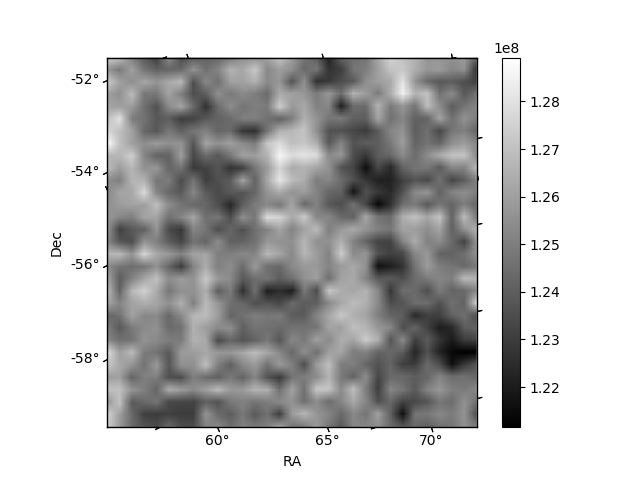
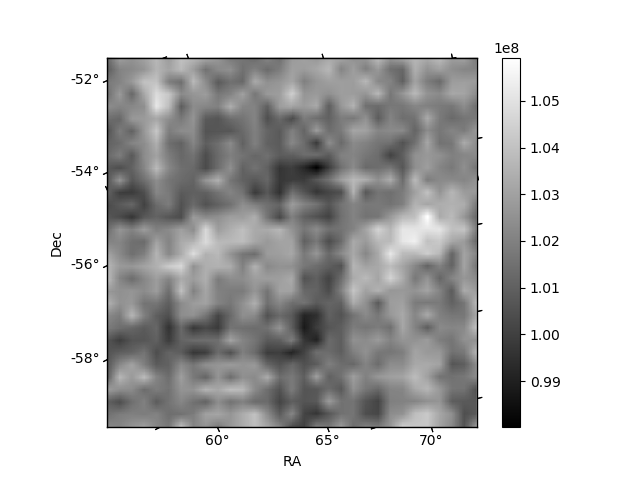
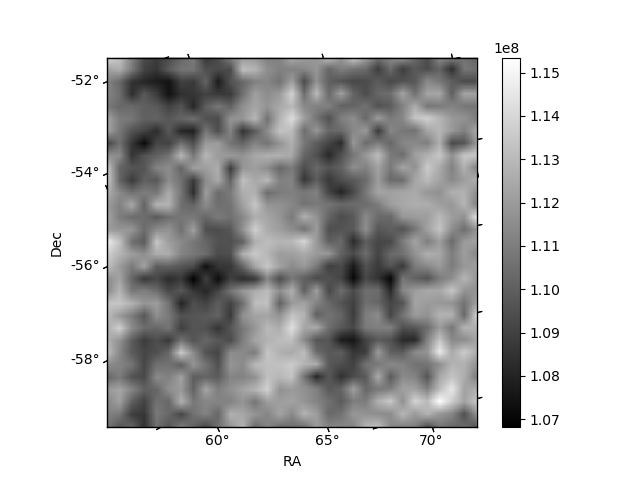
Histogram calculated using DETX and DETY for each event in the final _common_clean file
| Quadrant A |  |
 |
Quadrant B |
|---|---|---|---|
| Quadrant D |  |
 |
Quadrant C |
| Plot type | Count rate plots | Images |
|---|---|---|
| Comparison with Poisson distribution Blue bars denote a histogram of data divided into 1 sec bins. Red curve is a Poisson curve with rate = median count rate of data. |
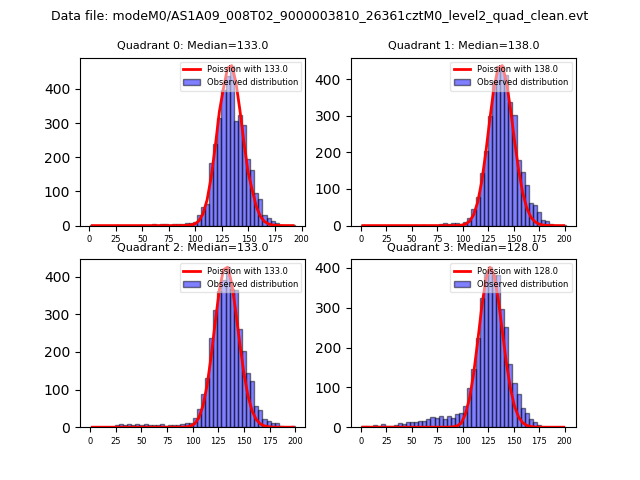 |
 |
| Quadrant-wise count rates Data is divided into 100 sec bins |
 |
|
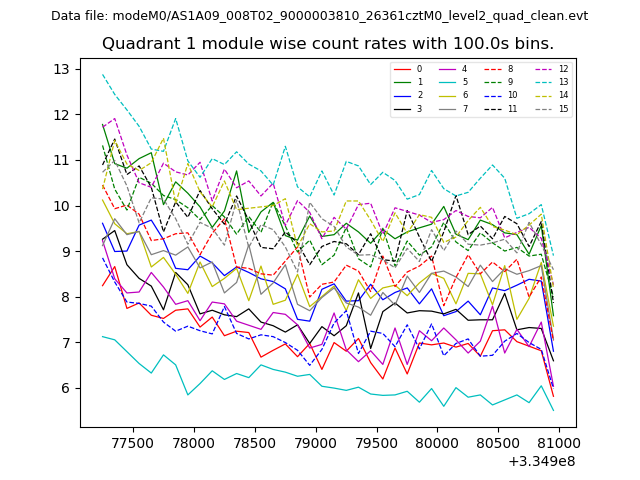
| Module-wise count rates for Quadrant A Data is divided into 100 sec bins |
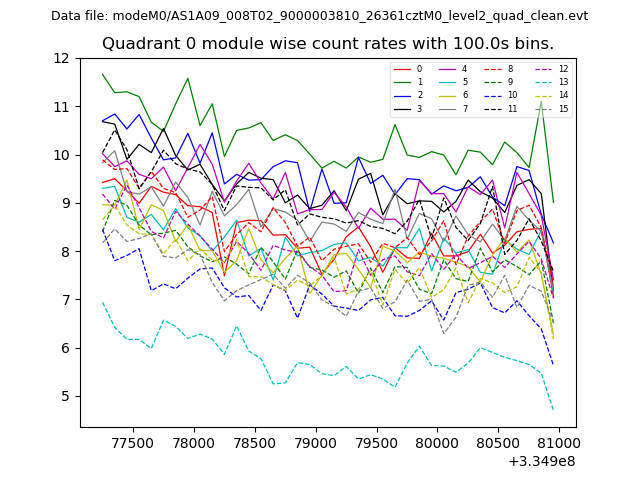 |
 |
| Module-wise count rates for Quadrant B Data is divided into 100 sec bins |
 |
 |
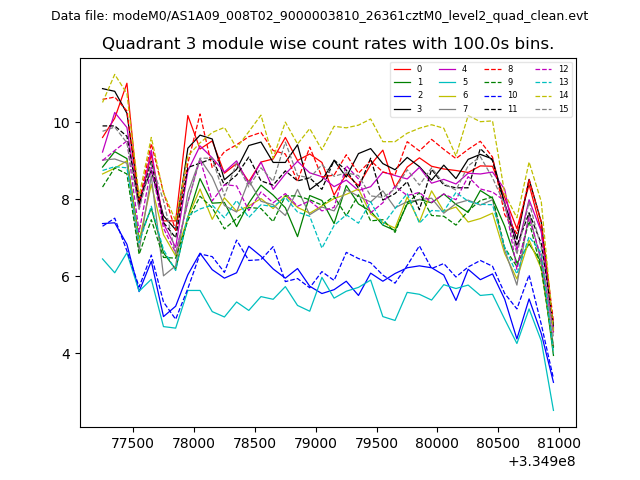
| Module-wise count rates for Quadrant C Data is divided into 100 sec bins |
 |
 |
| Module-wise count rates for Quadrant D Data is divided into 100 sec bins |
 |
 |
| Parameter | Plot |
|---|---|
| CZT HV Monitor |  |
| D_VDD | 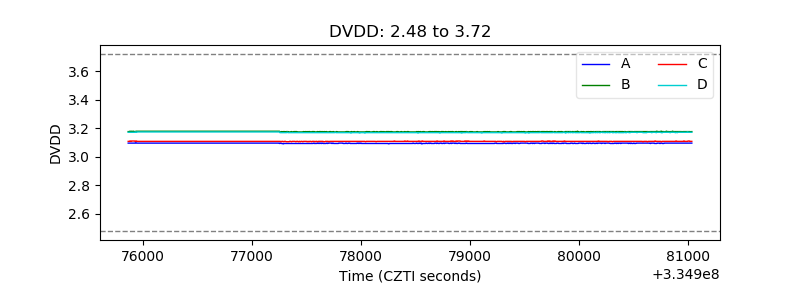 |
| Temperature 1 | 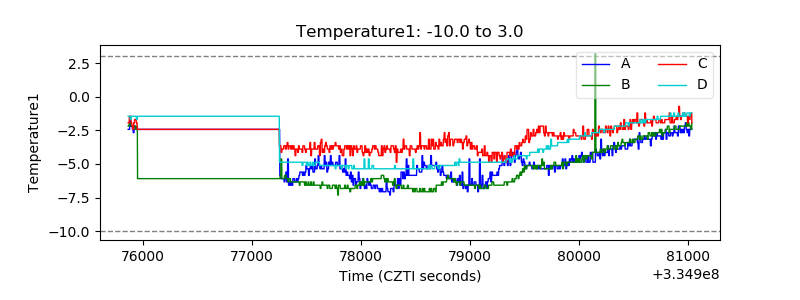 |
| Veto HV Monitor | 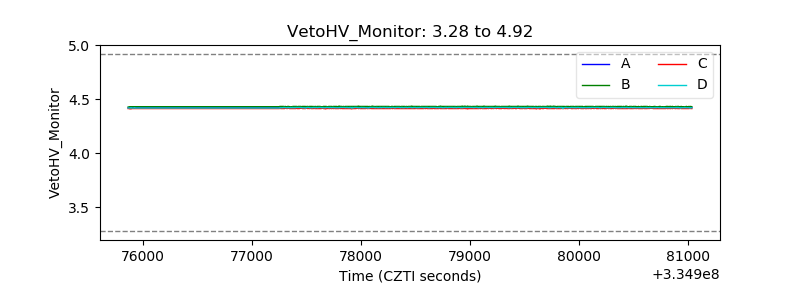 |
| Veto LLD | 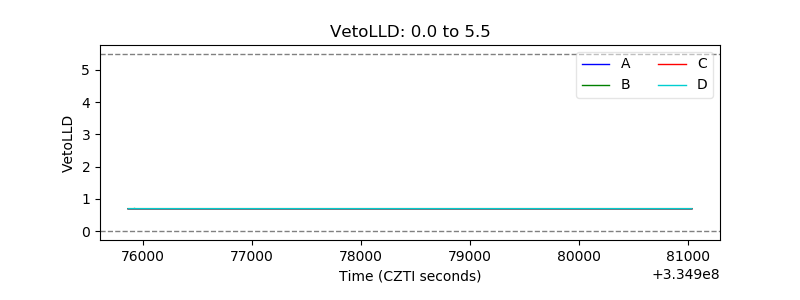 |
| Alpha Counter | 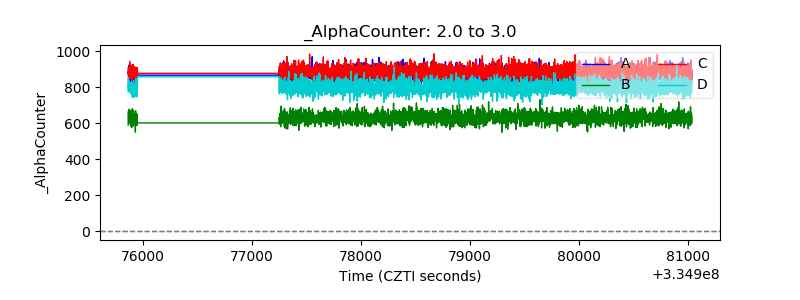 |
| _CPM_Rate | 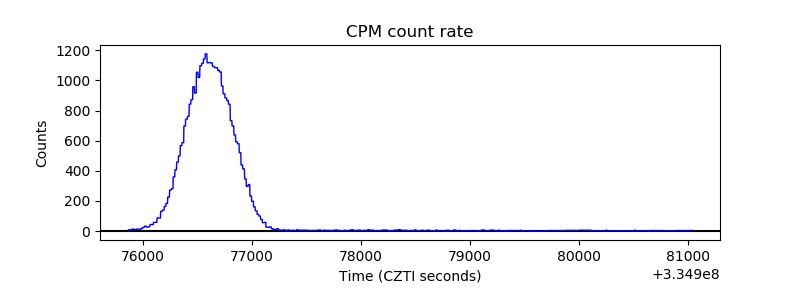 |
| CZT Counter | 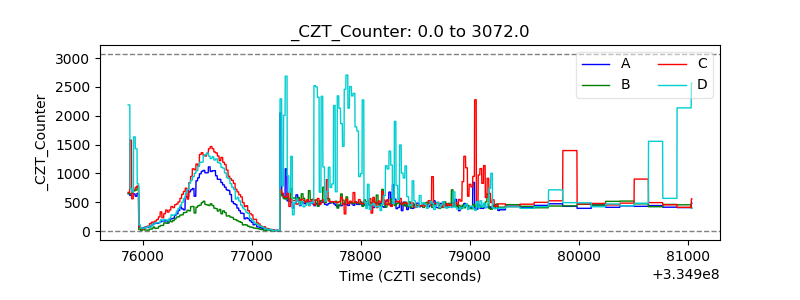 |
| +2.5 Volts monitor |  |
| +5 Volts monitor |  |
| _ROLL_ROT | 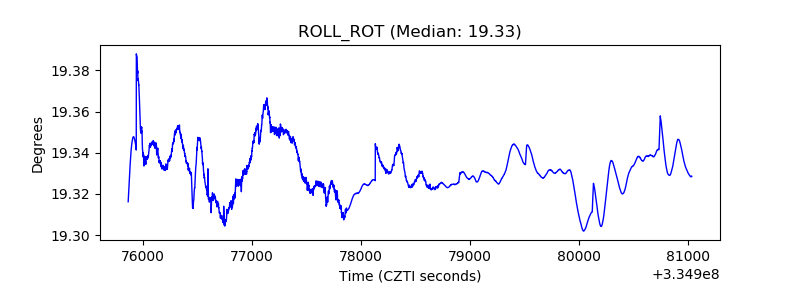 |
| _Roll_DEC | 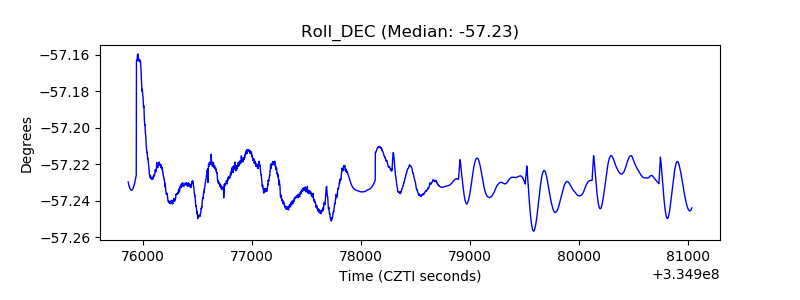 |
| _Roll_RA | 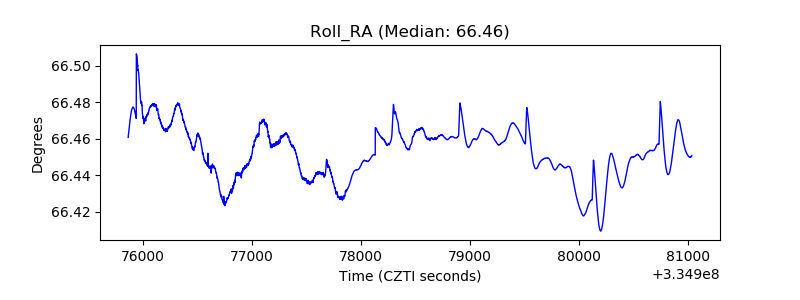 |
| Veto Counter | 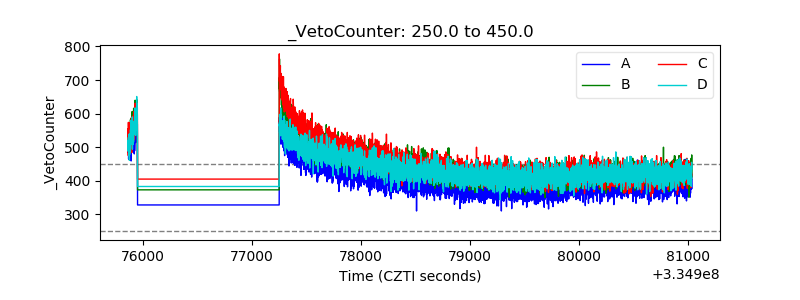 |