| Param | Original file | Final file |
|---|---|---|
| Filename | modeM0/AS1A09_088T01_9000003812cztM0_level2.fits | modeM0/AS1A09_088T01_9000003812cztM0_level2_quad_clean.evt |
| Size (bytes) | 1,270,054,080 | 1,285,810,560 |
| Size | 1.2 GB | 1.2 GB |
| Events in quadrant A | 8,170,578 | 8,359,762 |
| Events in quadrant B | 7,902,690 | 8,507,067 |
| Events in quadrant C | 7,138,264 | 6,744,518 |
| Events in quadrant D | 6,128,792 | 6,230,666 |
| Mode SS | |||
|---|---|---|---|
| Quadrant | BADHDUFLAG | Total packets | Discarded packets |
| A | 0 | 2710 | 0 |
| B | 0 | 2710 | 0 |
| C | 0 | 2710 | 0 |
| D | 0 | 2710 | 0 |
| Mode M9 | |||
|---|---|---|---|
| Quadrant | BADHDUFLAG | Total packets | Discarded packets |
| A | 0 | 211 | 0 |
| B | 0 | 211 | 0 |
| C | 0 | 211 | 0 |
| D | 0 | 211 | 0 |
| Mode M0 | |||
|---|---|---|---|
| Quadrant | BADHDUFLAG | Total packets | Discarded packets |
| A | 0 | 285031 | 0 |
| B | 0 | 277263 | 0 |
| C | 0 | 508408 | 0 |
| D | 0 | 568487 | 0 |
| Quadrant | Total seconds | Saturated seconds | Saturation percentage |
|---|---|---|---|
| A | 132749 | 2213 | 1.667056% |
| B | 132749 | 1723 | 1.297938% |
| C | 132749 | 27635 | 20.817483% |
| D | 132749 | 31645 | 23.838221% |
Noise dominated data is calculated using 1-second bins in cleaned event files. If a bin has >2000 counts, and if more than 50% of those come from <1% of pixels, then it is considered to be noise-dominated and hence unusable.
| Quadrant | # 1 sec bins | Bins with >0 counts | Bins with >2000 counts | High rate bins dominated by noise | Noise dominated (total time) | Noise dominated (detector-on time) | Marked lightcurve |
|---|---|---|---|---|---|---|---|
| A | 154019 | 132733 | 0 | 0 | 0.00% | 0.00% | 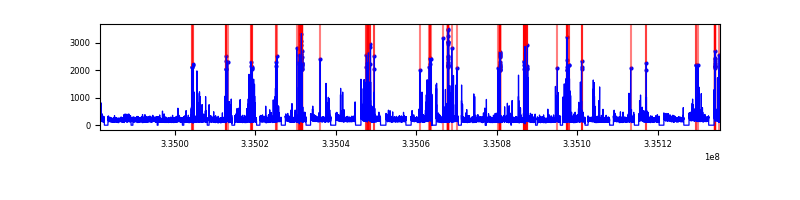 |
| B | 154019 | 132741 | 0 | 0 | 0.00% | 0.00% | 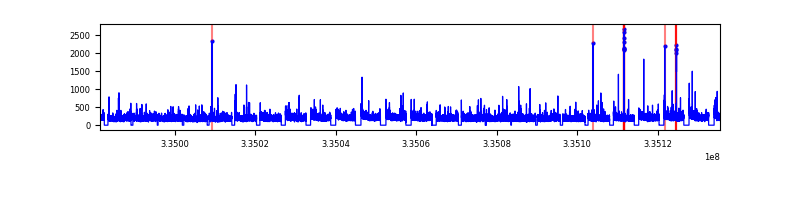 |
| C | 154019 | 132576 | 0 | 0 | 0.00% | 0.00% | 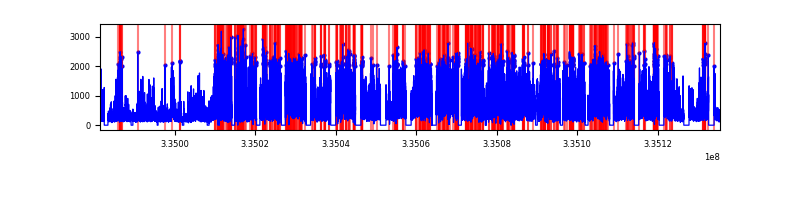 |
| D | 154019 | 132147 | 0 | 0 | 0.00% | 0.00% |  |
Top three noisy pixels from each quadrant. If the there are fewer than three noisy pixels in the level2.evt file, extra rows are filled as -1
| Pixel properties | Quadrant properties | ||||||
|---|---|---|---|---|---|---|---|
| Quadrant | DetID | PixID | Counts | Sigma | Mean | Median | Sigma |
| A | 0 | 29 | 6691 | 8.96 | 2131 | 2007 | 522.5 |
| A | 7 | 110 | 6437 | 8.48 | 2131 | 2007 | 522.5 |
| A | 9 | 19 | 6215 | 8.05 | 2131 | 2007 | 522.5 |
| B | 2 | 9 | 6279 | 10.7 | 2088 | 2002 | 399.9 |
| B | 2 | 8 | 5238 | 8.09 | 2088 | 2002 | 399.9 |
| B | 5 | 128 | 5177 | 7.94 | 2088 | 2002 | 399.9 |
| C | 12 | 241 | 5003 | 6.76 | 1891 | 1777 | 476.8 |
| C | 9 | 209 | 4821 | 6.38 | 1891 | 1777 | 476.8 |
| C | 12 | 250 | 4785 | 6.31 | 1891 | 1777 | 476.8 |
| D | 3 | 14 | 4384 | 6.03 | 1747 | 1594 | 462.7 |
| D | 6 | 231 | 4338 | 5.93 | 1747 | 1594 | 462.7 |
| D | 15 | 46 | 4294 | 5.83 | 1747 | 1594 | 462.7 |
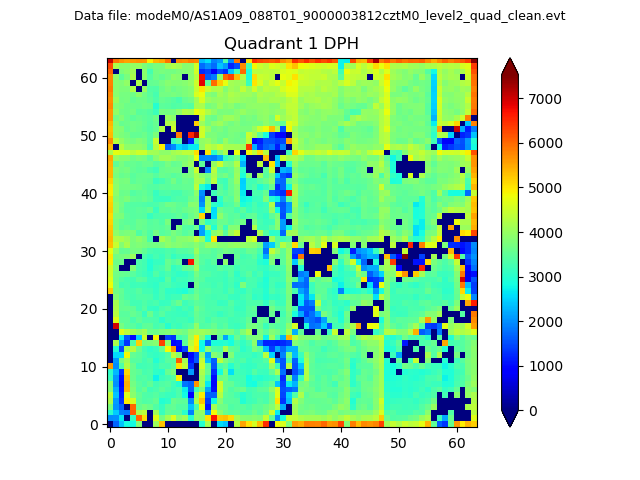
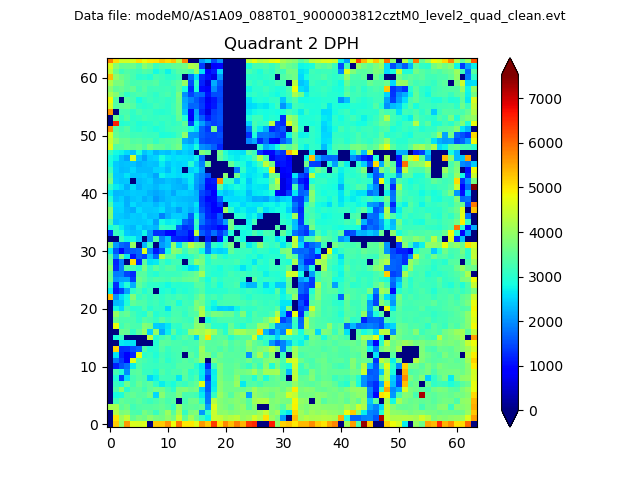
Histogram calculated using DETX and DETY for each event in the final _common_clean file
| Quadrant A | 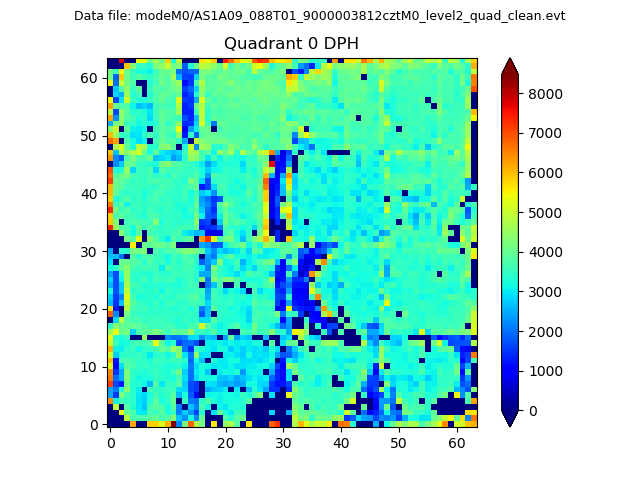 |
 |
Quadrant B |
|---|---|---|---|
| Quadrant D |  |
 |
Quadrant C |
| Plot type | Count rate plots | Images |
|---|---|---|
| Comparison with Poisson distribution Blue bars denote a histogram of data divided into 1 sec bins. Red curve is a Poisson curve with rate = median count rate of data. |
 |
 |
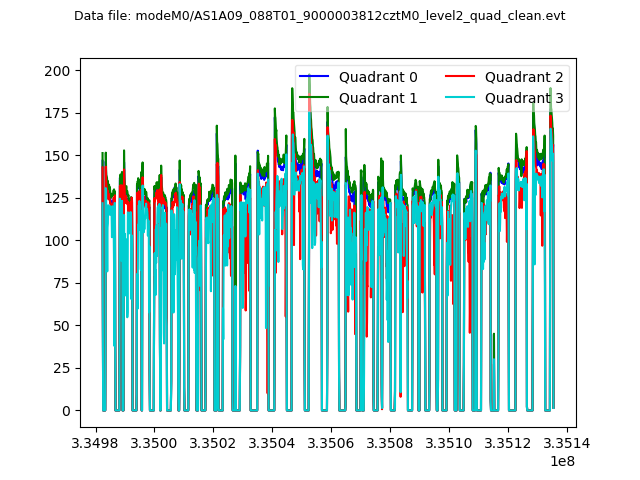
| Quadrant-wise count rates Data is divided into 100 sec bins |
 |
|
| Module-wise count rates for Quadrant A Data is divided into 100 sec bins |
 |
 |
| Module-wise count rates for Quadrant B Data is divided into 100 sec bins |
 |
 |
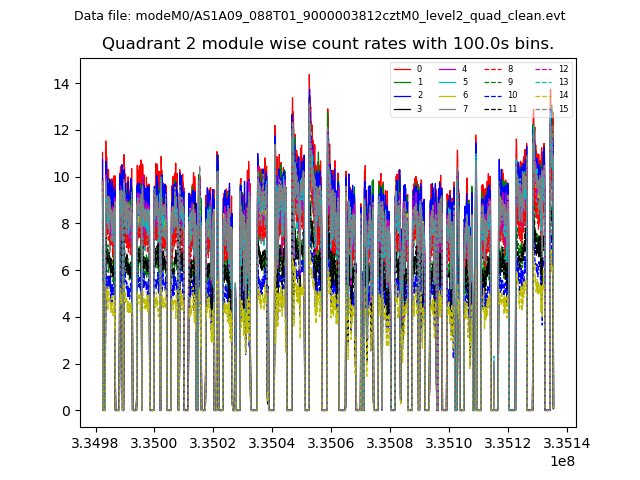
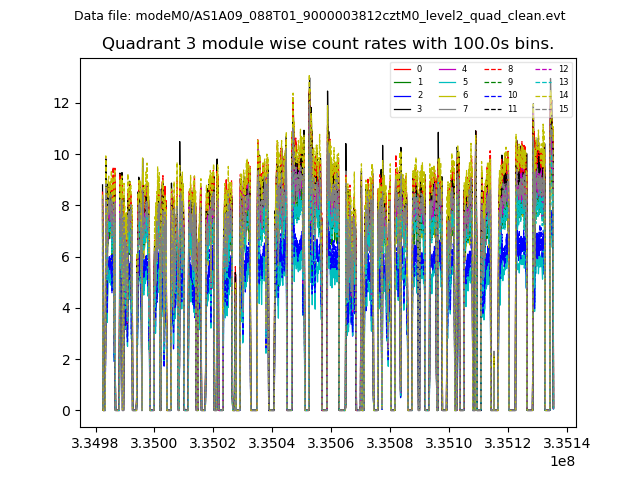
| Module-wise count rates for Quadrant C Data is divided into 100 sec bins |
 |
 |
| Module-wise count rates for Quadrant D Data is divided into 100 sec bins |
 |
 |
| Parameter | Plot |
|---|---|
| CZT HV Monitor |  |
| D_VDD |  |
| Temperature 1 |  |
| Veto HV Monitor |  |
| Veto LLD |  |
| Alpha Counter |  |
| _CPM_Rate |  |
| CZT Counter | 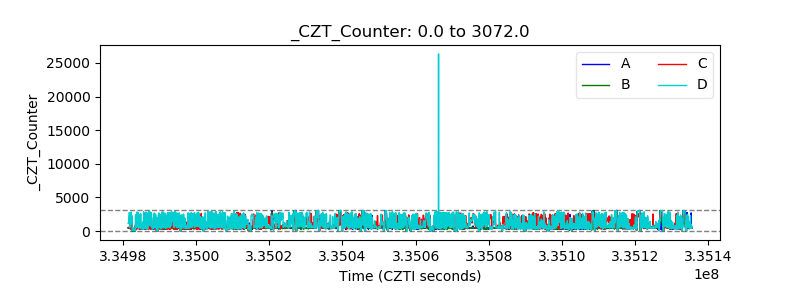 |
| +2.5 Volts monitor |  |
| +5 Volts monitor |  |
| _ROLL_ROT | 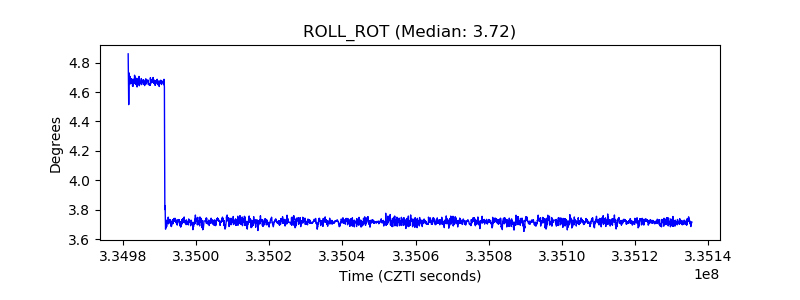 |
| _Roll_DEC |  |
| _Roll_RA | 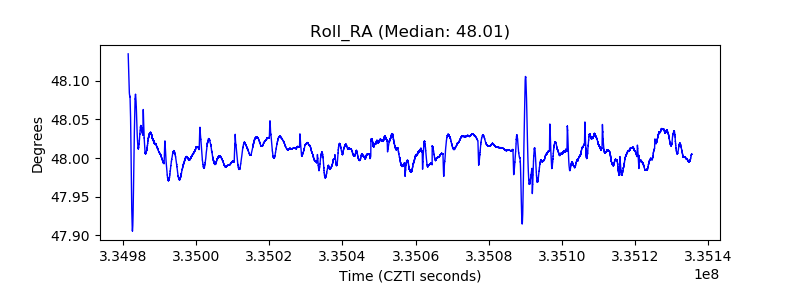 |
| Veto Counter |  |