| Param | Original file | Final file |
|---|---|---|
| Filename | modeM0/AS1A09_088T01_9000003812_26361cztM0_level2.evt | modeM0/AS1A09_088T01_9000003812_26361cztM0_level2_quad_clean.evt |
| Size (bytes) | 265,057,920 | 33,059,520 |
| Size | 252.8 MB | 31.5 MB |
| Events in quadrant A | 1,246,654 | 213,889 |
| Events in quadrant B | 1,266,897 | 219,478 |
| Events in quadrant C | 1,383,192 | 208,271 |
| Events in quadrant D | 3,958,585 | 178,790 |
| Mode M9 | |||
|---|---|---|---|
| Quadrant | BADHDUFLAG | Total packets | Discarded packets |
| A | 0 | 9 | 0 |
| B | 0 | 9 | 0 |
| C | 0 | 9 | 0 |
| D | 0 | 9 | 0 |
| Mode M0 | |||
|---|---|---|---|
| Quadrant | BADHDUFLAG | Total packets | Discarded packets |
| A | 0 | 5257 | 0 |
| B | 0 | 5275 | 0 |
| C | 0 | 5611 | 0 |
| D | 0 | 13511 | 0 |
| Quadrant | Total seconds | Saturated seconds | Saturation percentage |
|---|---|---|---|
| A | 2508 | 32 | 1.275917% |
| B | 2508 | 51 | 2.033493% |
| C | 2508 | 87 | 3.468900% |
| D | 2508 | 944 | 37.639553% |
Noise dominated data is calculated using 1-second bins in cleaned event files. If a bin has >2000 counts, and if more than 50% of those come from <1% of pixels, then it is considered to be noise-dominated and hence unusable.
| Quadrant | # 1 sec bins | Bins with >0 counts | Bins with >2000 counts | High rate bins dominated by noise | Noise dominated (total time) | Noise dominated (detector-on time) | Marked lightcurve |
|---|---|---|---|---|---|---|---|
| A | 3413 | 2509 | 0 | 0 | 0.00% | 0.00% | 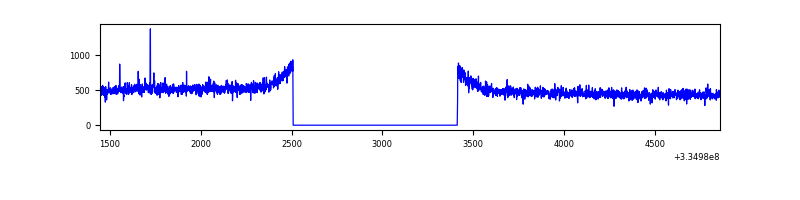 |
| B | 3413 | 2509 | 0 | 0 | 0.00% | 0.00% | 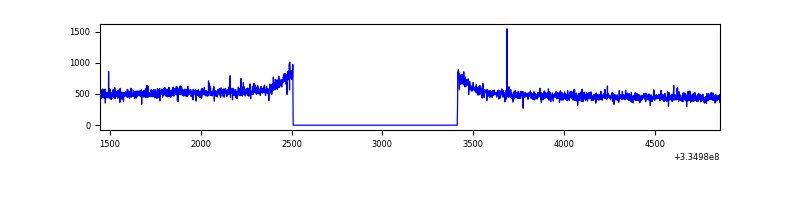 |
| C | 3413 | 2509 | 2 | 2 | 0.06% | 0.08% | 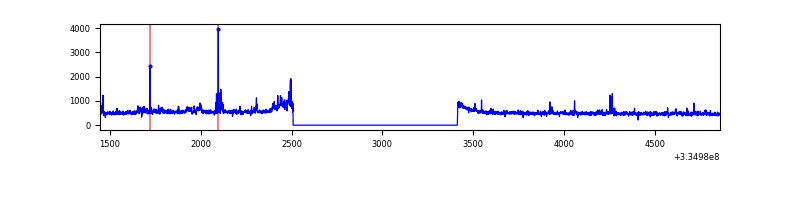 |
| D | 3413 | 2509 | 723 | 723 | 21.18% | 28.82% | 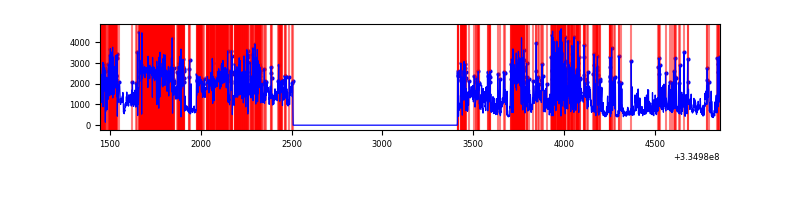 |
Top three noisy pixels from each quadrant. If the there are fewer than three noisy pixels in the level2.evt file, extra rows are filled as -1
| Pixel properties | Quadrant properties | ||||||
|---|---|---|---|---|---|---|---|
| Quadrant | DetID | PixID | Counts | Sigma | Mean | Median | Sigma |
| A | 0 | 13 | 4234 | 59.58 | 321 | 313 | 65.8 |
| A | 13 | 254 | 4060 | 56.93 | 321 | 313 | 65.8 |
| A | 3 | 137 | 3072 | 41.92 | 321 | 313 | 65.8 |
| B | 12 | 111 | 7698 | 117.06 | 322 | 313 | 63.1 |
| B | 11 | 111 | 6796 | 102.76 | 322 | 313 | 63.1 |
| B | 14 | 111 | 5908 | 88.69 | 322 | 313 | 63.1 |
| C | 3 | 233 | 91809 | 1224.05 | 313 | 313 | 74.7 |
| C | 14 | 238 | 49093 | 652.58 | 313 | 313 | 74.7 |
| C | 4 | 254 | 22880 | 301.9 | 313 | 313 | 74.7 |
| D | 7 | 80 | 2749247 | 43280.95 | 262 | 255 | 63.5 |
| D | 1 | 52 | 192636 | 3028.9 | 262 | 255 | 63.5 |
| D | 2 | 234 | 8540 | 130.44 | 262 | 255 | 63.5 |
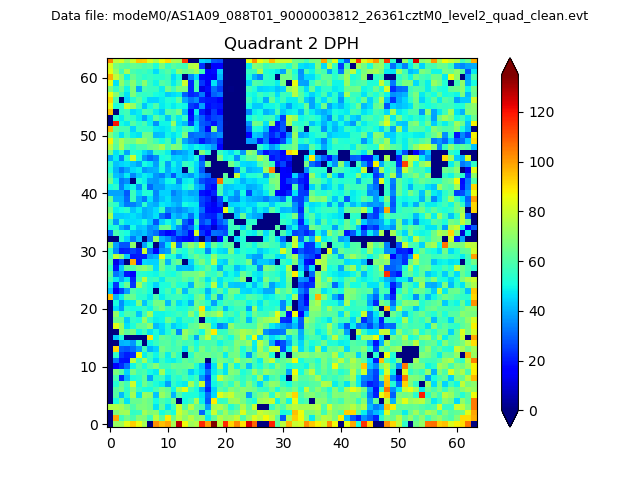
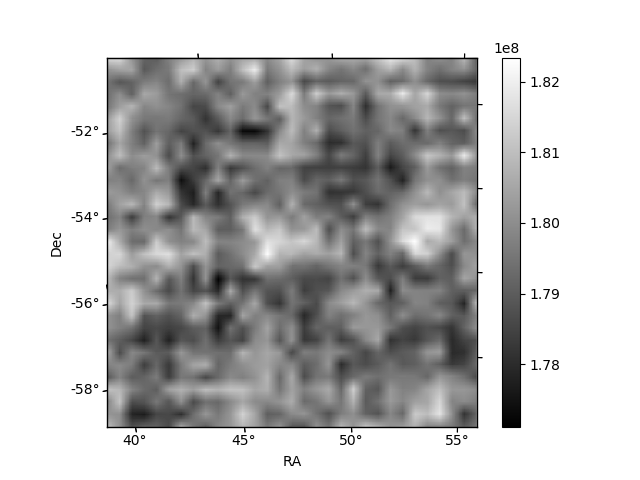
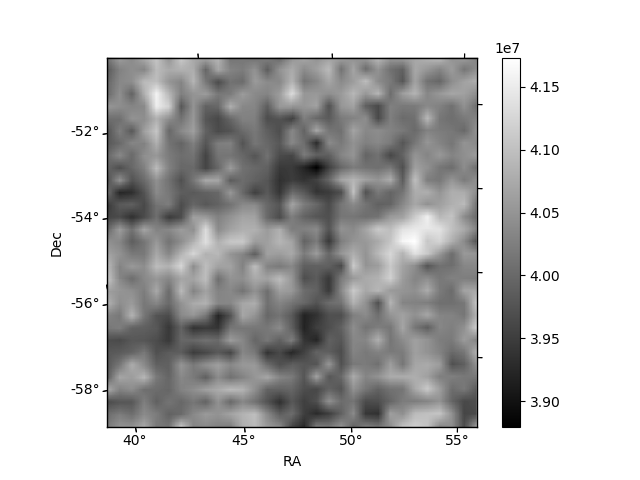
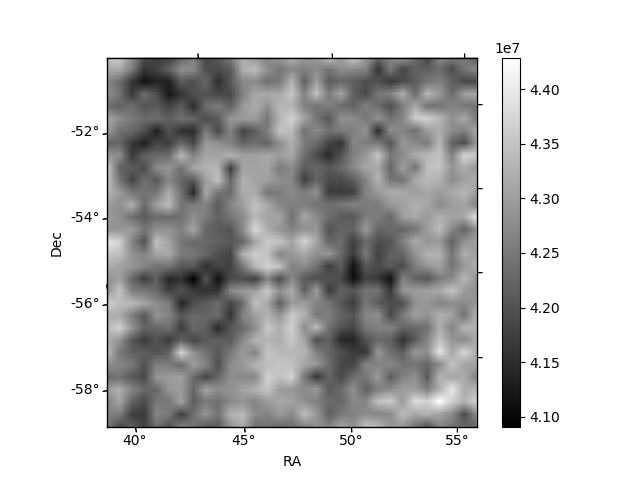
Histogram calculated using DETX and DETY for each event in the final _common_clean file
| Quadrant A | 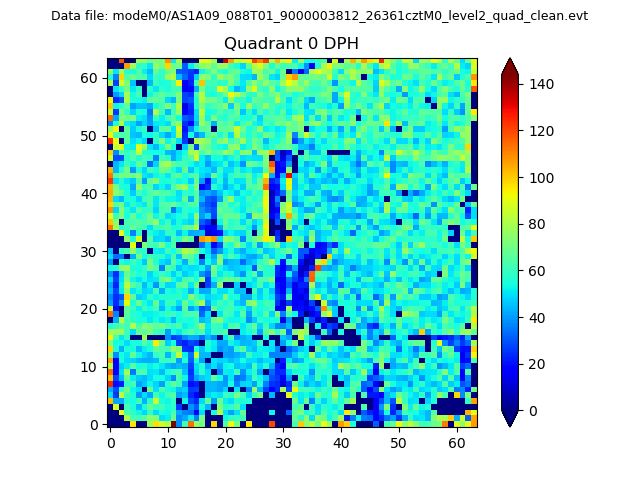 |
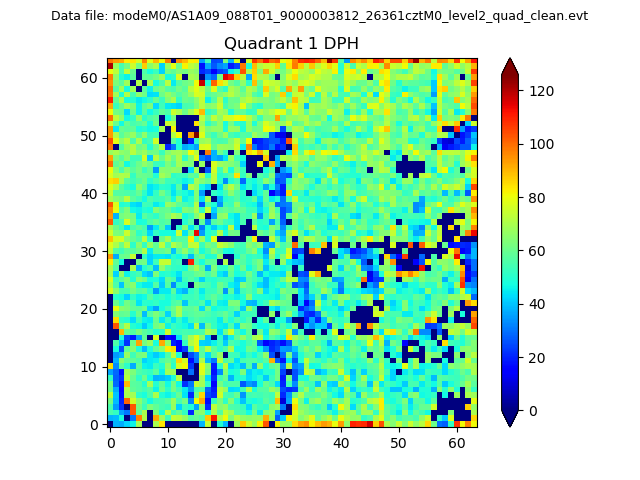 |
Quadrant B |
|---|---|---|---|
| Quadrant D | 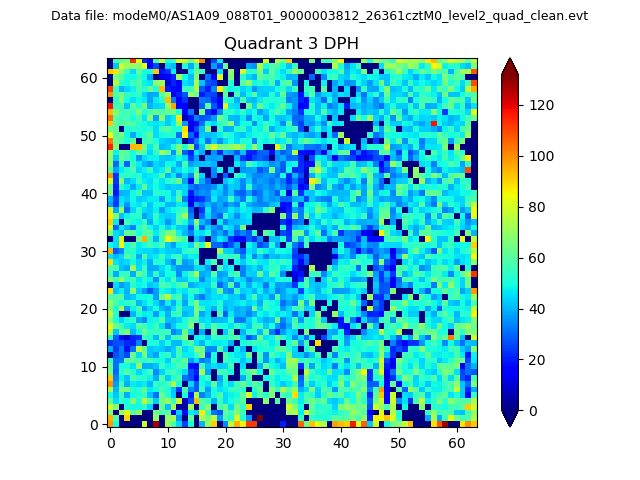 |
 |
Quadrant C |
| Plot type | Count rate plots | Images |
|---|---|---|
| Comparison with Poisson distribution Blue bars denote a histogram of data divided into 1 sec bins. Red curve is a Poisson curve with rate = median count rate of data. |
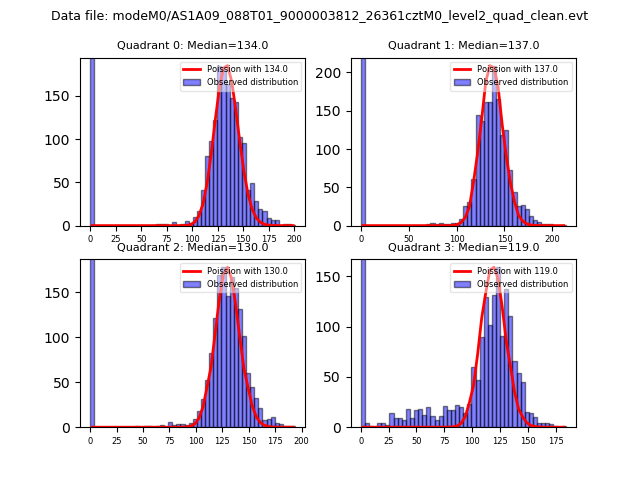 |
 |
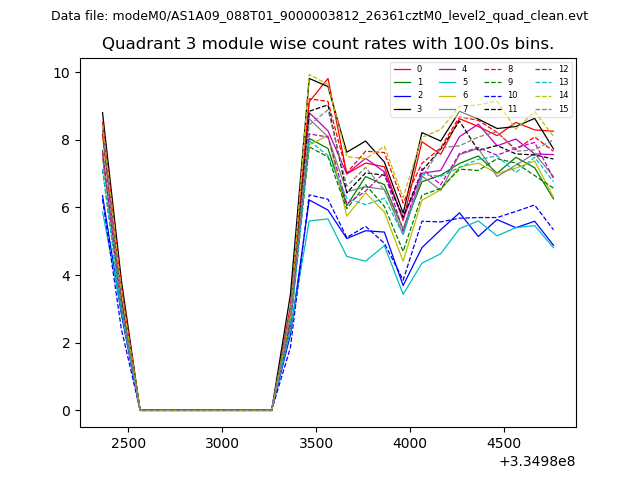
| Quadrant-wise count rates Data is divided into 100 sec bins |
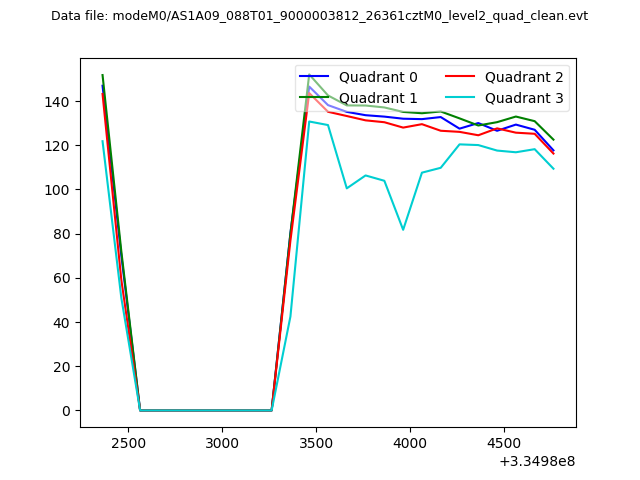 |
|
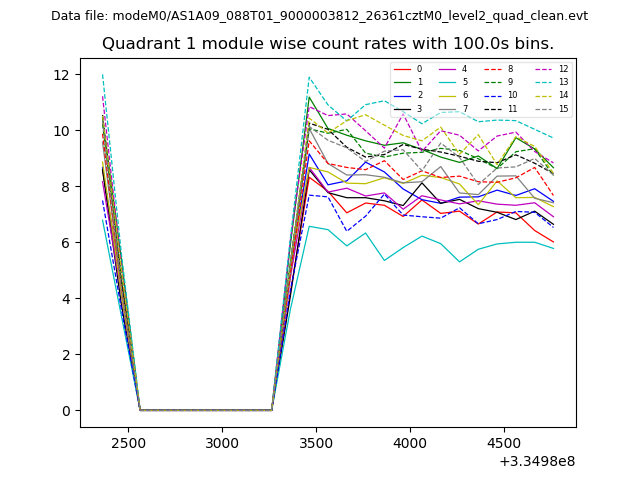
| Module-wise count rates for Quadrant A Data is divided into 100 sec bins |
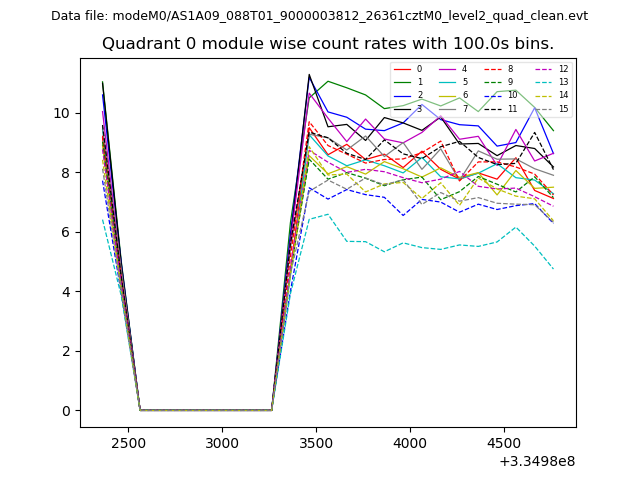 |
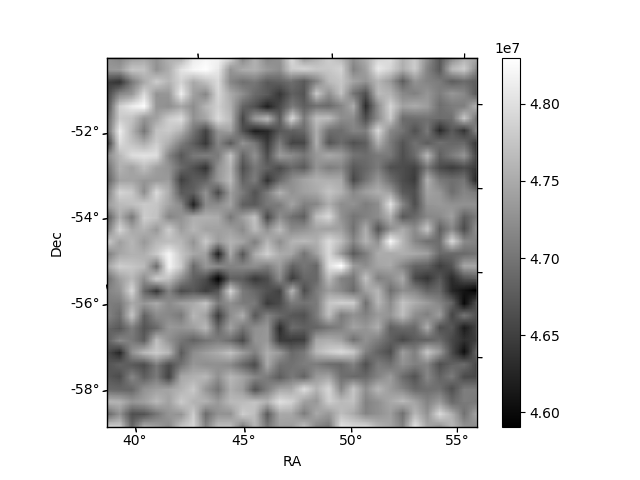 |
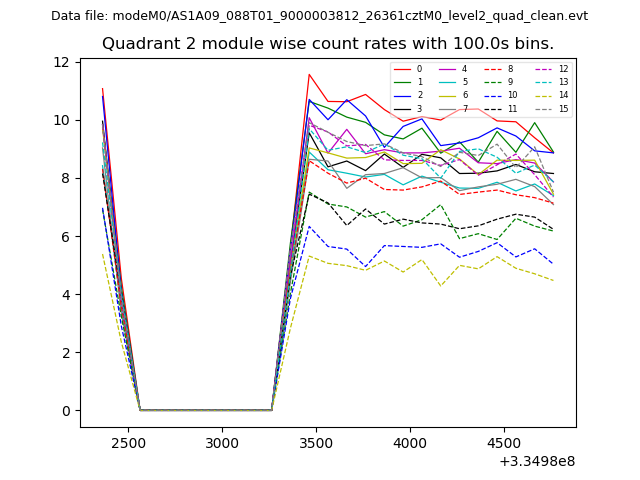
| Module-wise count rates for Quadrant B Data is divided into 100 sec bins |
 |
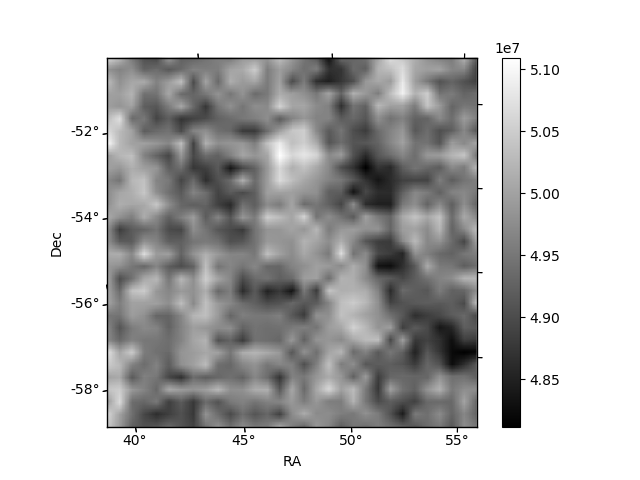 |
| Module-wise count rates for Quadrant C Data is divided into 100 sec bins |
 |
 |
| Module-wise count rates for Quadrant D Data is divided into 100 sec bins |
 |
 |
| Parameter | Plot |
|---|---|
| CZT HV Monitor | 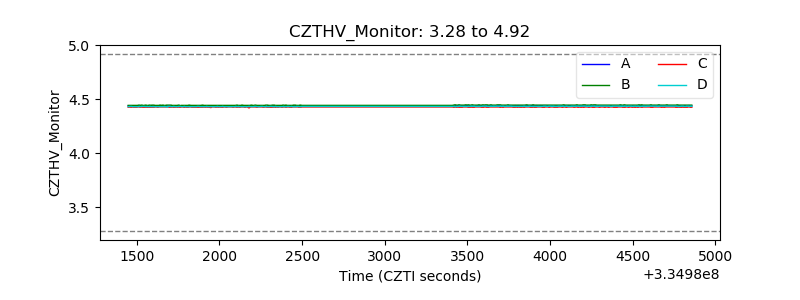 |
| D_VDD | 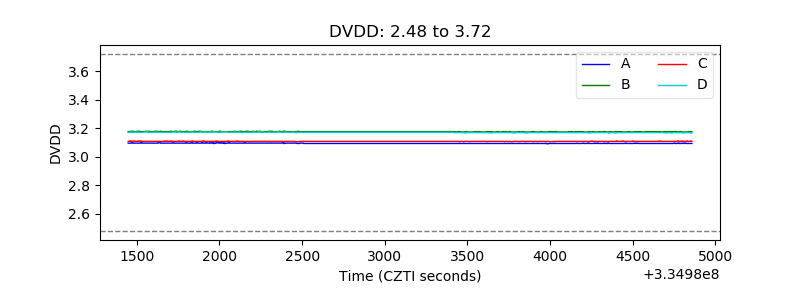 |
| Temperature 1 | 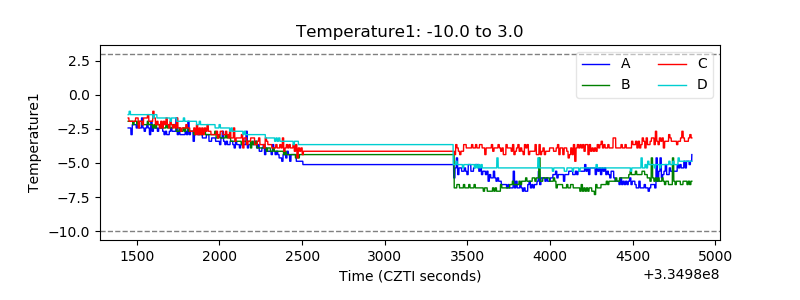 |
| Veto HV Monitor | 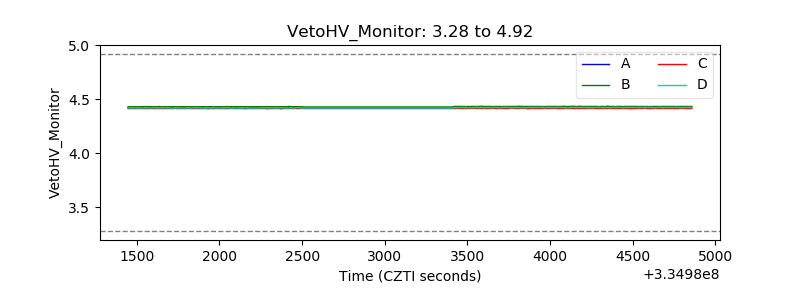 |
| Veto LLD | 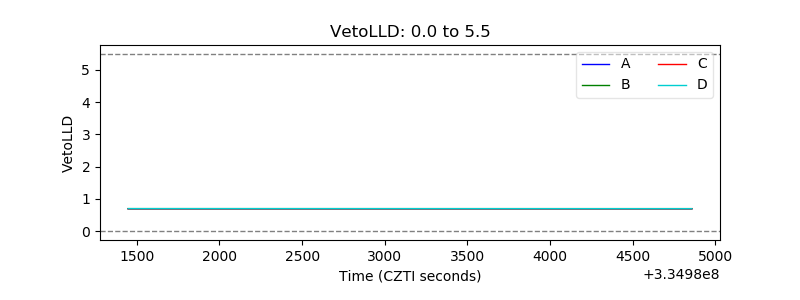 |
| Alpha Counter |  |
| _CPM_Rate | 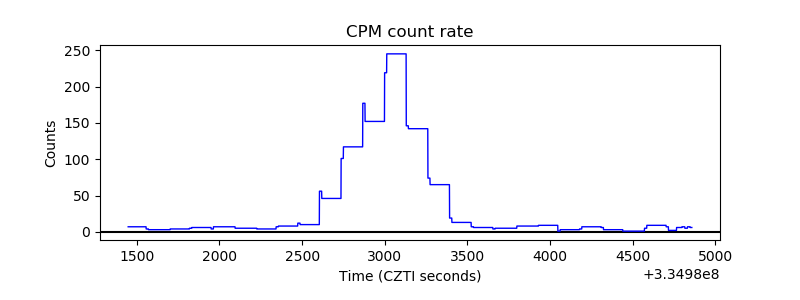 |
| CZT Counter | 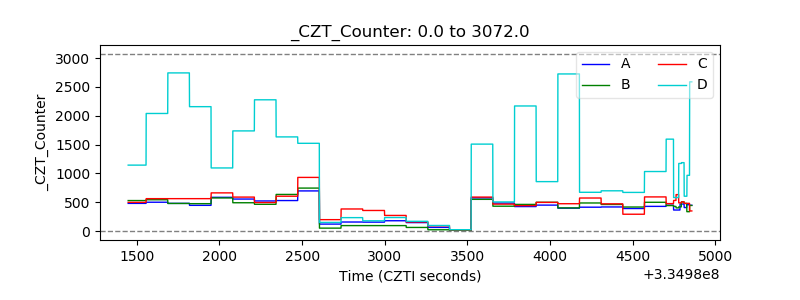 |
| +2.5 Volts monitor | 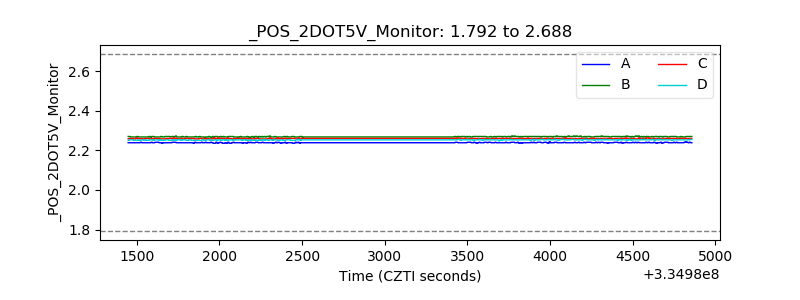 |
| +5 Volts monitor |  |
| _ROLL_ROT | 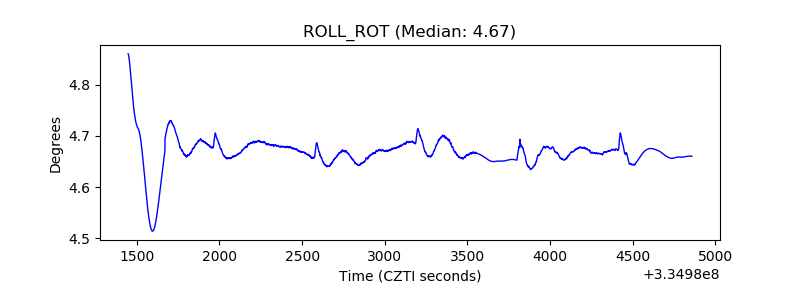 |
| _Roll_DEC | 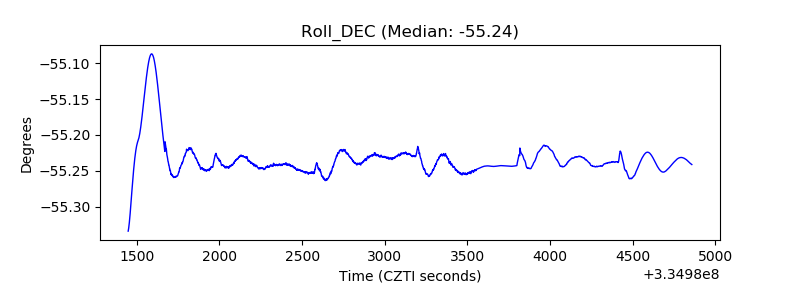 |
| _Roll_RA | 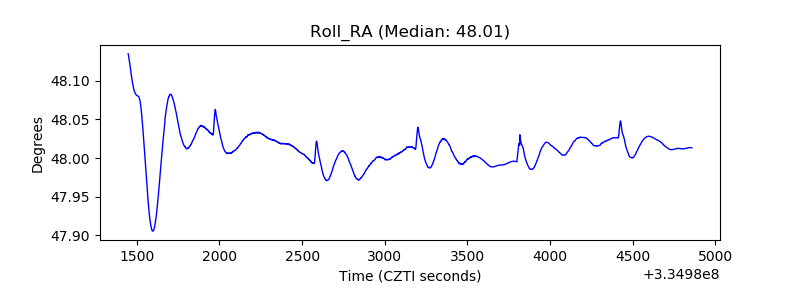 |
| Veto Counter | 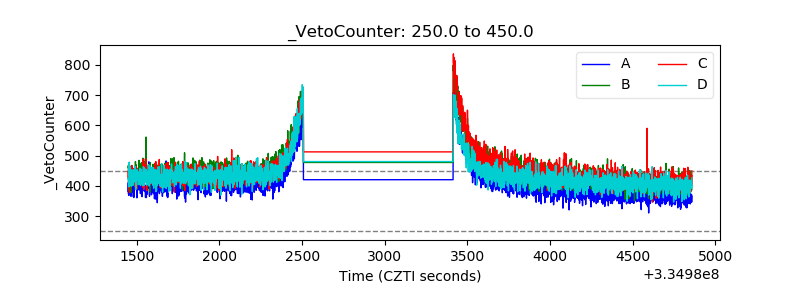 |