| Param | Original file | Final file |
|---|---|---|
| Filename | modeM0/AS1A09_088T01_9000003812_26362cztM0_level2.evt | modeM0/AS1A09_088T01_9000003812_26362cztM0_level2_quad_clean.evt |
| Size (bytes) | 722,257,920 | 112,625,280 |
| Size | 688.8 MB | 107.4 MB |
| Events in quadrant A | 3,433,871 | 757,928 |
| Events in quadrant B | 3,495,417 | 780,096 |
| Events in quadrant C | 4,526,554 | 736,563 |
| Events in quadrant D | 9,917,593 | 621,449 |
| Mode M9 | |||
|---|---|---|---|
| Quadrant | BADHDUFLAG | Total packets | Discarded packets |
| A | 0 | 14 | 0 |
| B | 0 | 14 | 0 |
| C | 0 | 14 | 0 |
| D | 0 | 14 | 0 |
| Mode M0 | |||
|---|---|---|---|
| Quadrant | BADHDUFLAG | Total packets | Discarded packets |
| A | 0 | 15161 | 0 |
| B | 0 | 15223 | 0 |
| C | 0 | 17970 | 0 |
| D | 0 | 34499 | 0 |
| Quadrant | Total seconds | Saturated seconds | Saturation percentage |
|---|---|---|---|
| A | 7385 | 85 | 1.150982% |
| B | 7386 | 116 | 1.570539% |
| C | 7386 | 376 | 5.090712% |
| D | 7386 | 2425 | 32.832386% |
Noise dominated data is calculated using 1-second bins in cleaned event files. If a bin has >2000 counts, and if more than 50% of those come from <1% of pixels, then it is considered to be noise-dominated and hence unusable.
| Quadrant | # 1 sec bins | Bins with >0 counts | Bins with >2000 counts | High rate bins dominated by noise | Noise dominated (total time) | Noise dominated (detector-on time) | Marked lightcurve |
|---|---|---|---|---|---|---|---|
| A | 8760 | 7387 | 0 | 0 | 0.00% | 0.00% | 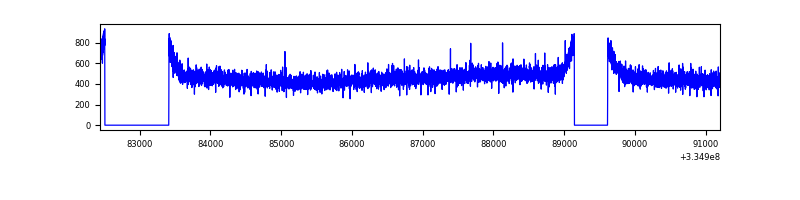 |
| B | 8761 | 7388 | 0 | 0 | 0.00% | 0.00% | 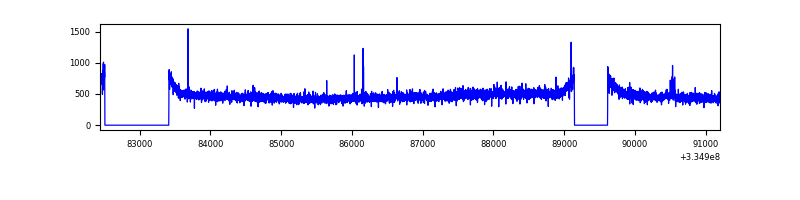 |
| C | 8761 | 7388 | 139 | 139 | 1.59% | 1.88% | 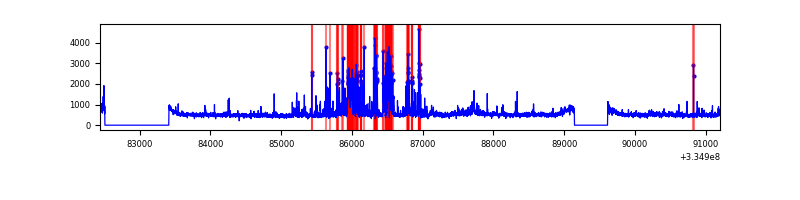 |
| D | 8761 | 7387 | 1750 | 1750 | 19.97% | 23.69% | 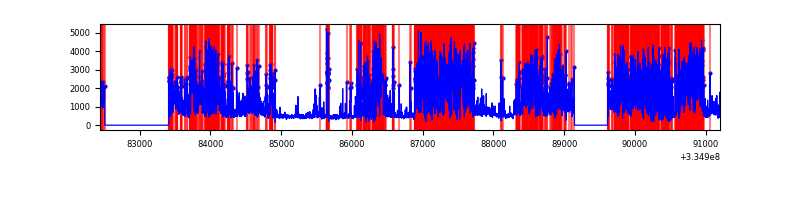 |
Top three noisy pixels from each quadrant. If the there are fewer than three noisy pixels in the level2.evt file, extra rows are filled as -1
| Pixel properties | Quadrant properties | ||||||
|---|---|---|---|---|---|---|---|
| Quadrant | DetID | PixID | Counts | Sigma | Mean | Median | Sigma |
| A | 13 | 254 | 11274 | 58.29 | 890 | 868 | 178.5 |
| A | 3 | 137 | 8255 | 41.38 | 890 | 868 | 178.5 |
| A | 0 | 226 | 7507 | 37.19 | 890 | 868 | 178.5 |
| B | 0 | 230 | 23059 | 131.09 | 888 | 863 | 169.3 |
| B | 12 | 111 | 20937 | 118.55 | 888 | 863 | 169.3 |
| B | 11 | 111 | 18571 | 104.58 | 888 | 863 | 169.3 |
| C | 4 | 254 | 711354 | 3537.83 | 863 | 866 | 200.8 |
| C | 3 | 233 | 311391 | 1546.24 | 863 | 866 | 200.8 |
| C | 14 | 238 | 136156 | 673.67 | 863 | 866 | 200.8 |
| D | 7 | 80 | 5115208 | 29216.39 | 741 | 724 | 175.1 |
| D | 1 | 52 | 1816034 | 10369.92 | 741 | 724 | 175.1 |
| D | 11 | 176 | 121649 | 690.78 | 741 | 724 | 175.1 |
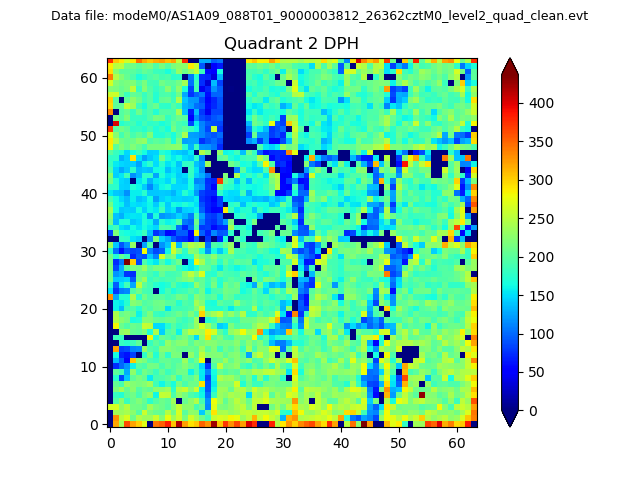
Histogram calculated using DETX and DETY for each event in the final _common_clean file
| Quadrant A | 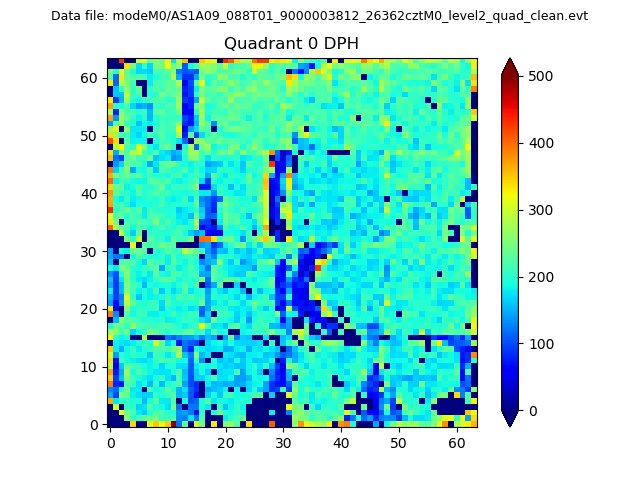 |
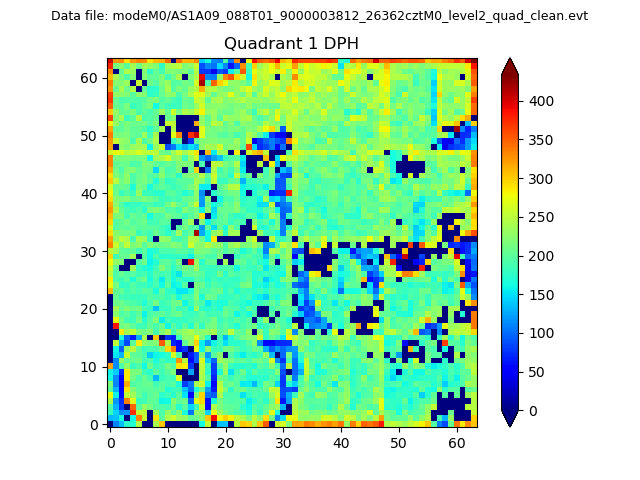 |
Quadrant B |
|---|---|---|---|
| Quadrant D | 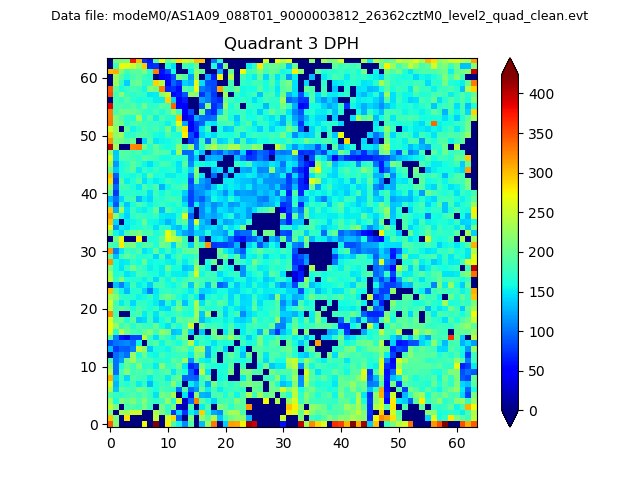 |
 |
Quadrant C |
| Plot type | Count rate plots | Images |
|---|---|---|
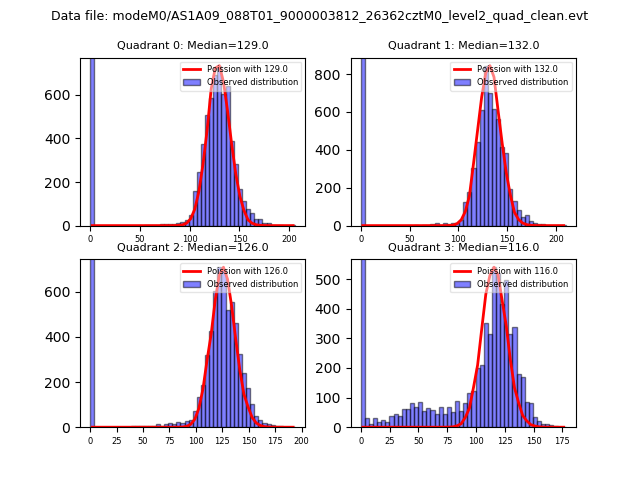
| Comparison with Poisson distribution Blue bars denote a histogram of data divided into 1 sec bins. Red curve is a Poisson curve with rate = median count rate of data. |
 |
 |
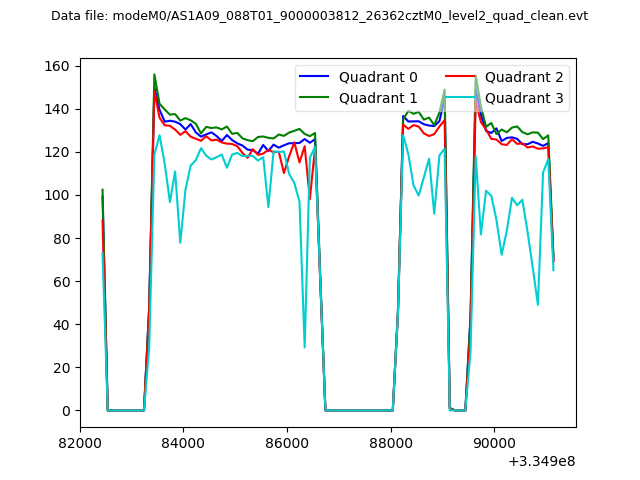
| Quadrant-wise count rates Data is divided into 100 sec bins |
 |
|
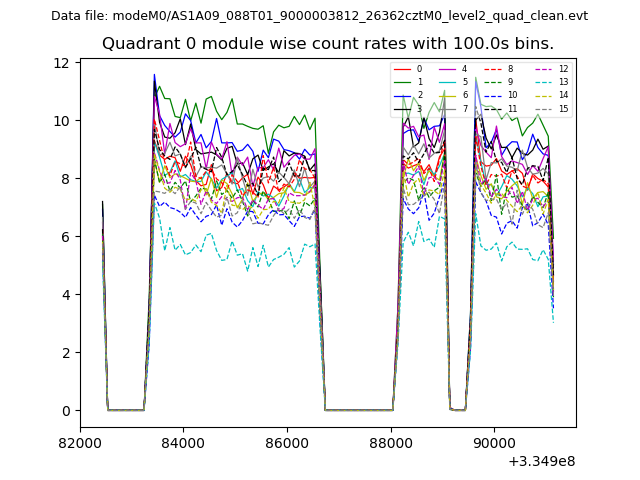
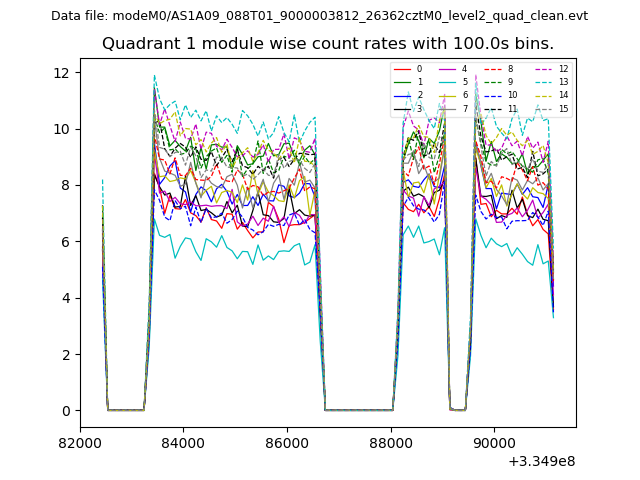
| Module-wise count rates for Quadrant A Data is divided into 100 sec bins |
 |
 |
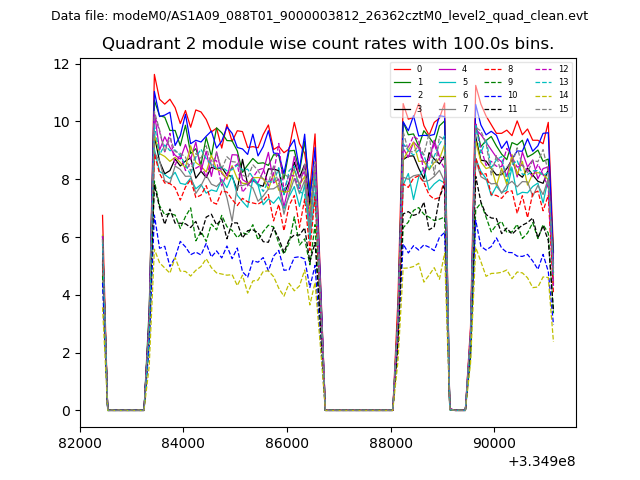
| Module-wise count rates for Quadrant B Data is divided into 100 sec bins |
 |
 |
| Module-wise count rates for Quadrant C Data is divided into 100 sec bins |
 |
 |
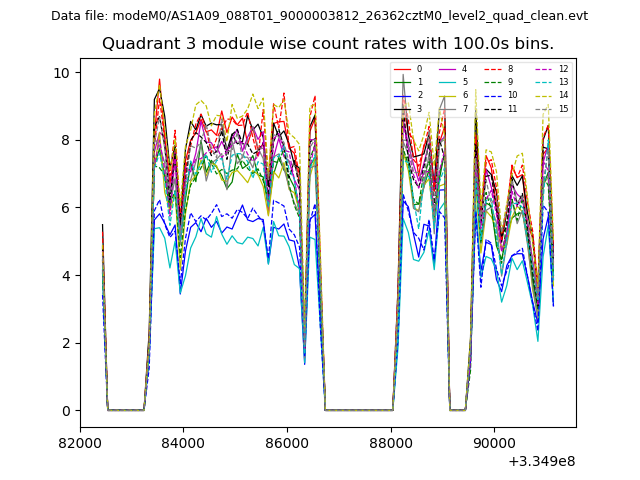
| Module-wise count rates for Quadrant D Data is divided into 100 sec bins |
 |
 |
| Parameter | Plot |
|---|---|
| CZT HV Monitor | 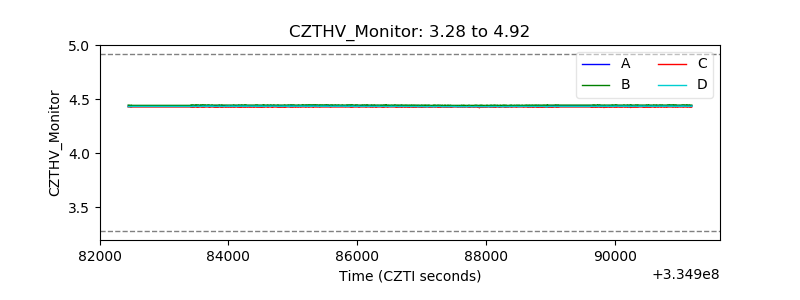 |
| D_VDD | 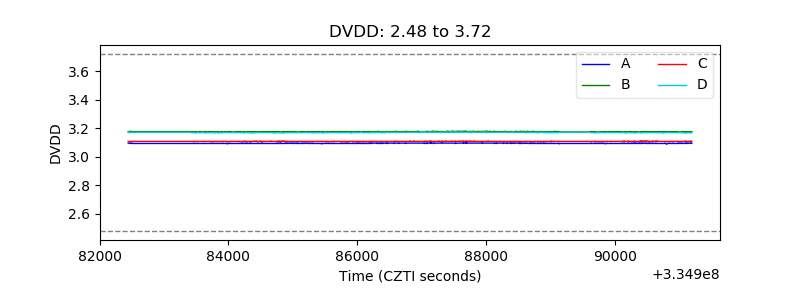 |
| Temperature 1 | 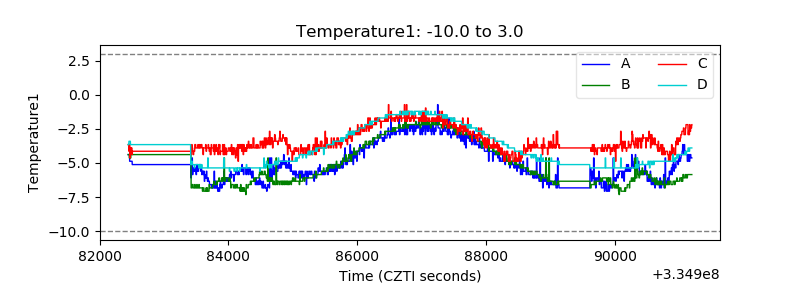 |
| Veto HV Monitor | 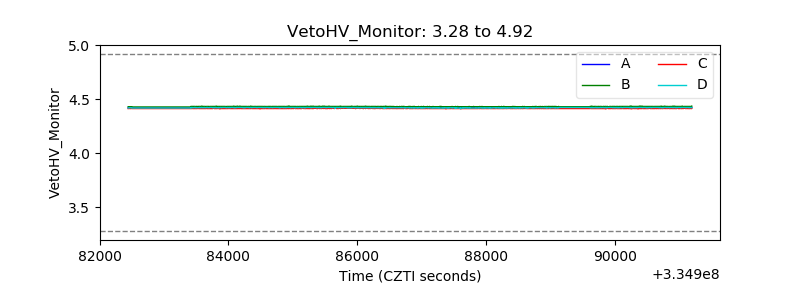 |
| Veto LLD | 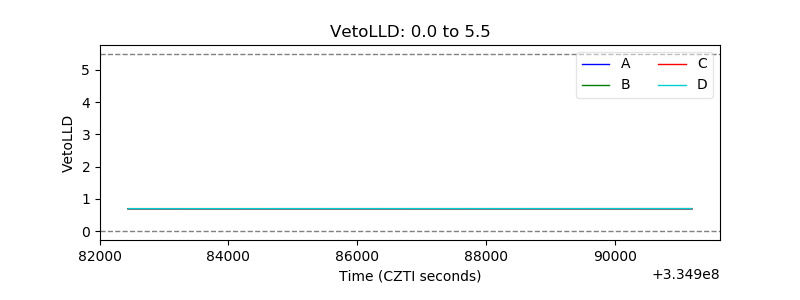 |
| Alpha Counter |  |
| _CPM_Rate |  |
| CZT Counter | 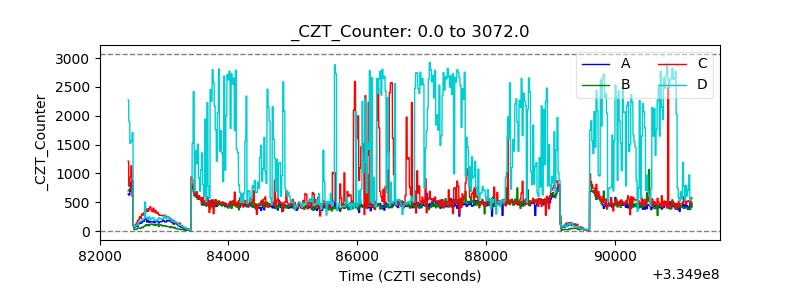 |
| +2.5 Volts monitor |  |
| +5 Volts monitor |  |
| _ROLL_ROT | 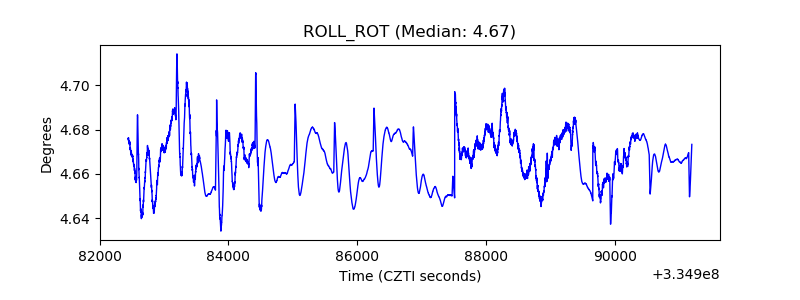 |
| _Roll_DEC | 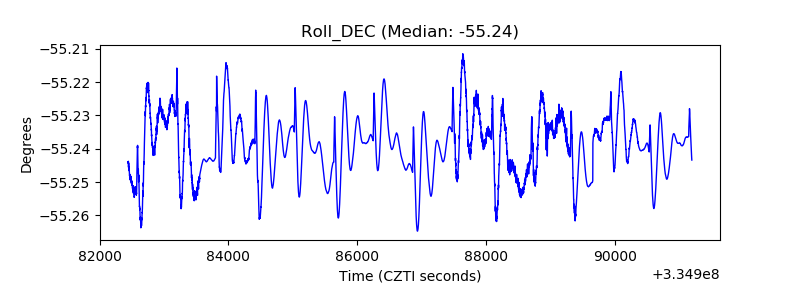 |
| _Roll_RA | 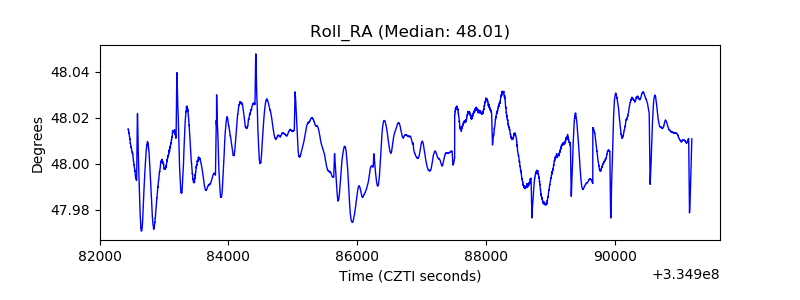 |
| Veto Counter | 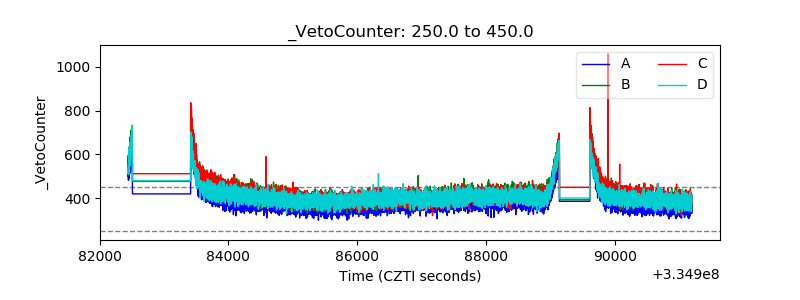 |