| Param | Original file | Final file |
|---|---|---|
| Filename | modeM0/AS1A09_088T01_9000003812_26367cztM0_level2.evt | modeM0/AS1A09_088T01_9000003812_26367cztM0_level2_quad_clean.evt |
| Size (bytes) | 2,313,849,600 | 314,573,760 |
| Size | 2.2 GB | 300.0 MB |
| Events in quadrant A | 10,578,274 | 2,084,814 |
| Events in quadrant B | 10,509,125 | 2,141,431 |
| Events in quadrant C | 15,692,523 | 2,031,035 |
| Events in quadrant D | 31,765,501 | 1,704,276 |
| Mode M9 | |||
|---|---|---|---|
| Quadrant | BADHDUFLAG | Total packets | Discarded packets |
| A | 0 | 9 | 0 |
| B | 0 | 9 | 0 |
| C | 0 | 9 | 0 |
| D | 0 | 9 | 0 |
| Mode M0 | |||
|---|---|---|---|
| Quadrant | BADHDUFLAG | Total packets | Discarded packets |
| A | 0 | 46728 | 0 |
| B | 0 | 46209 | 0 |
| C | 0 | 61128 | 0 |
| D | 0 | 110029 | 0 |
| Quadrant | Total seconds | Saturated seconds | Saturation percentage |
|---|---|---|---|
| A | 22716 | 292 | 1.285438% |
| B | 22717 | 312 | 1.373421% |
| C | 22717 | 1472 | 6.479729% |
| D | 22717 | 7426 | 32.689176% |
Noise dominated data is calculated using 1-second bins in cleaned event files. If a bin has >2000 counts, and if more than 50% of those come from <1% of pixels, then it is considered to be noise-dominated and hence unusable.
| Quadrant | # 1 sec bins | Bins with >0 counts | Bins with >2000 counts | High rate bins dominated by noise | Noise dominated (total time) | Noise dominated (detector-on time) | Marked lightcurve |
|---|---|---|---|---|---|---|---|
| A | 23741 | 22718 | 30 | 30 | 0.13% | 0.13% | 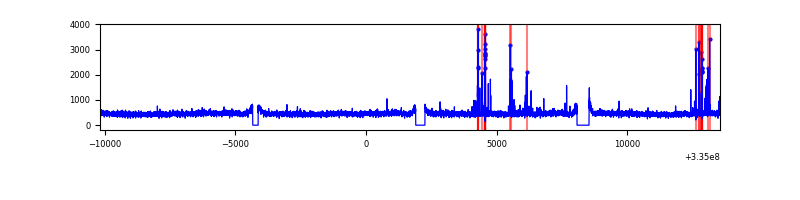 |
| B | 23742 | 22720 | 3 | 3 | 0.01% | 0.01% | 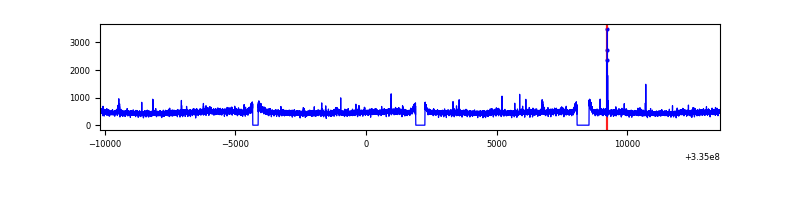 |
| C | 23742 | 22720 | 678 | 678 | 2.86% | 2.98% | 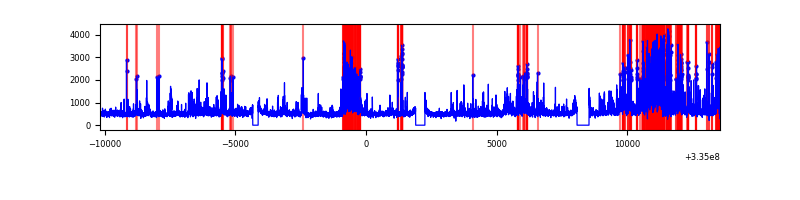 |
| D | 23742 | 22719 | 5513 | 5513 | 23.22% | 24.27% | 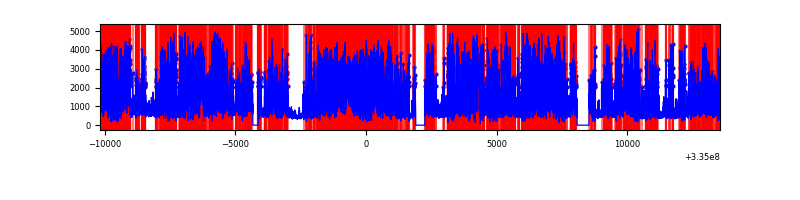 |
Top three noisy pixels from each quadrant. If the there are fewer than three noisy pixels in the level2.evt file, extra rows are filled as -1
| Pixel properties | Quadrant properties | ||||||
|---|---|---|---|---|---|---|---|
| Quadrant | DetID | PixID | Counts | Sigma | Mean | Median | Sigma |
| A | 0 | 13 | 269975 | 501.41 | 2664 | 2605 | 533.2 |
| A | 6 | 16 | 38248 | 66.84 | 2664 | 2605 | 533.2 |
| A | 13 | 254 | 35771 | 62.2 | 2664 | 2605 | 533.2 |
| B | 0 | 230 | 96784 | 187.68 | 2659 | 2585 | 501.9 |
| B | 12 | 111 | 62419 | 119.21 | 2659 | 2585 | 501.9 |
| B | 11 | 111 | 56234 | 106.89 | 2659 | 2585 | 501.9 |
| C | 3 | 233 | 4646435 | 7857.44 | 2540 | 2556 | 591.0 |
| C | 2 | 16 | 710555 | 1197.93 | 2540 | 2556 | 591.0 |
| C | 14 | 238 | 406845 | 684.06 | 2540 | 2556 | 591.0 |
| D | 7 | 80 | 19559275 | 37011.63 | 2229 | 2171 | 528.4 |
| D | 1 | 52 | 1679426 | 3174.19 | 2229 | 2171 | 528.4 |
| D | 11 | 176 | 1338575 | 2529.13 | 2229 | 2171 | 528.4 |
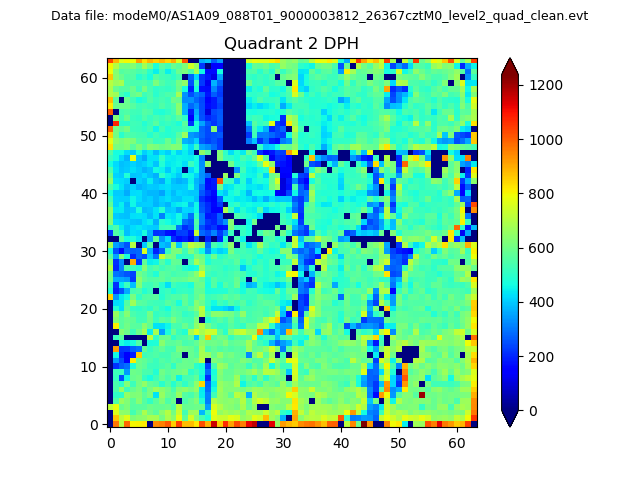
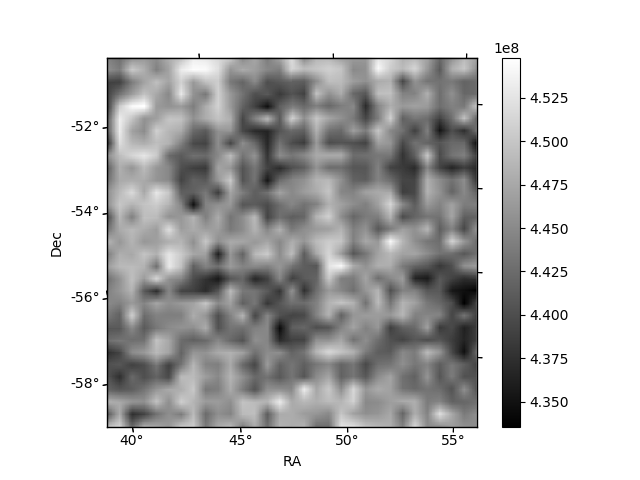
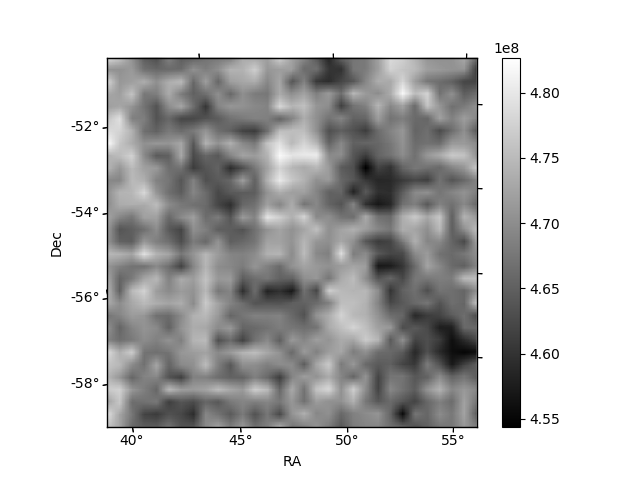
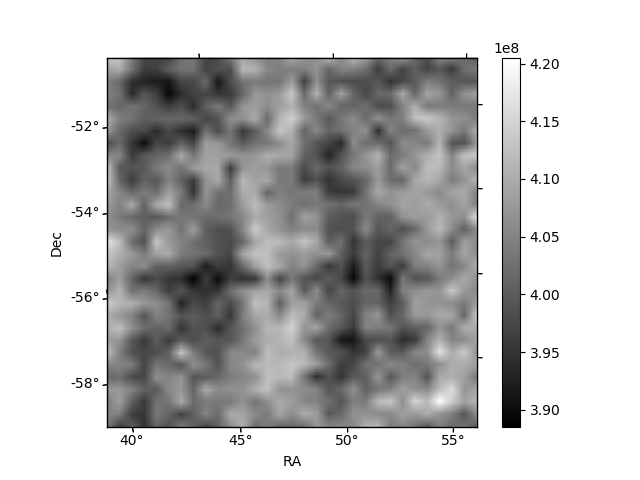
Histogram calculated using DETX and DETY for each event in the final _common_clean file
| Quadrant A | 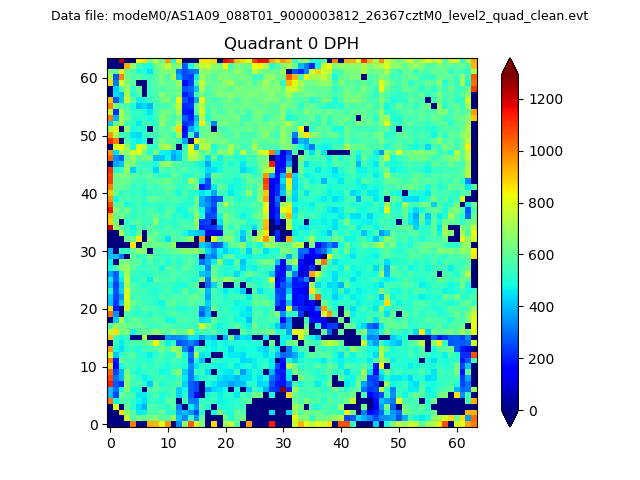 |
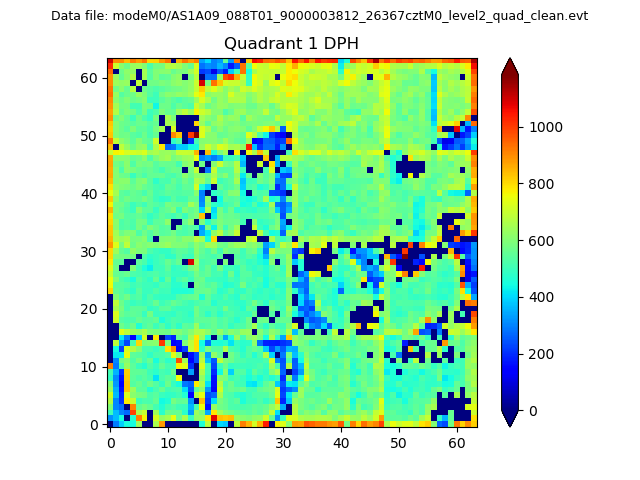 |
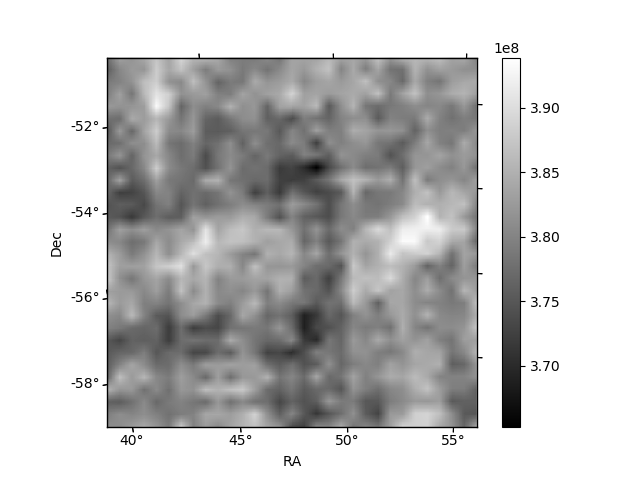
Quadrant B |
|---|---|---|---|
| Quadrant D | 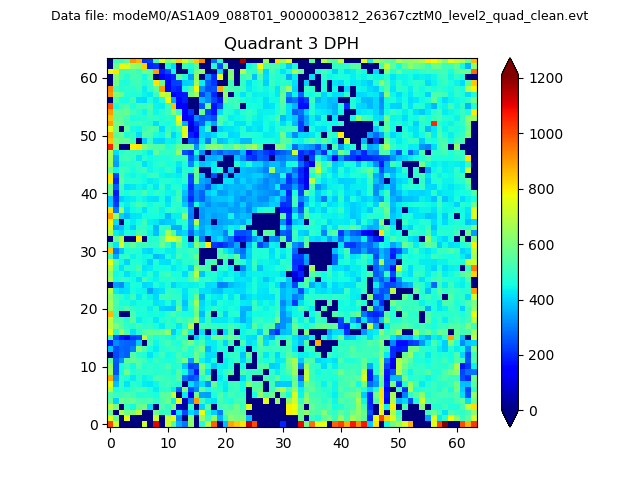 |
 |
Quadrant C |
| Plot type | Count rate plots | Images |
|---|---|---|
| Comparison with Poisson distribution Blue bars denote a histogram of data divided into 1 sec bins. Red curve is a Poisson curve with rate = median count rate of data. |
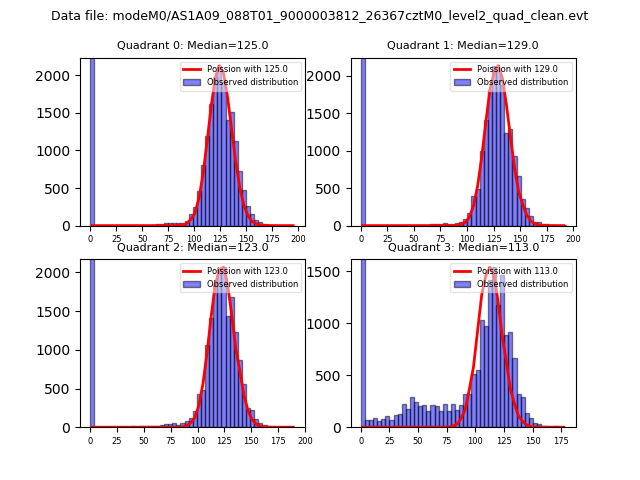 |
 |
| Quadrant-wise count rates Data is divided into 100 sec bins |
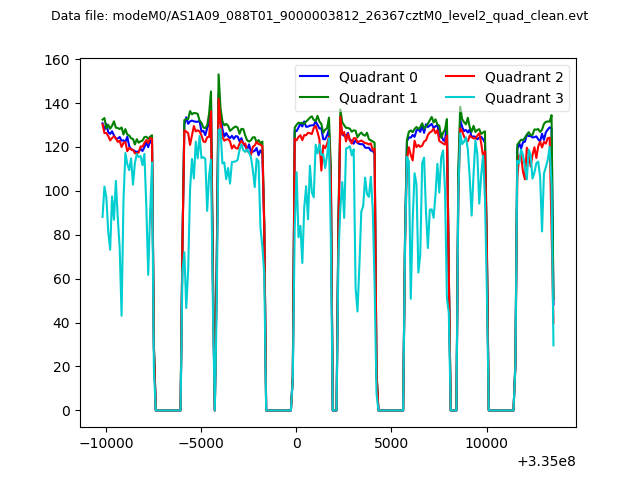 |
|
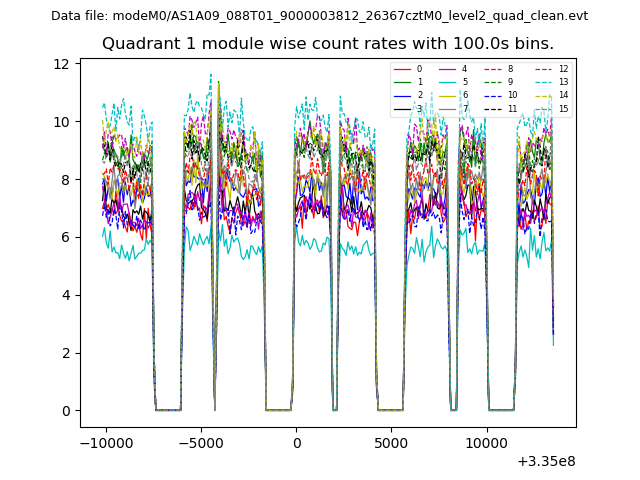
| Module-wise count rates for Quadrant A Data is divided into 100 sec bins |
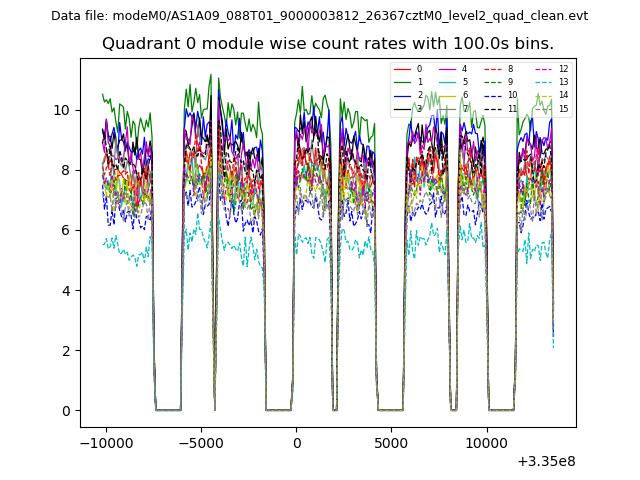 |
 |
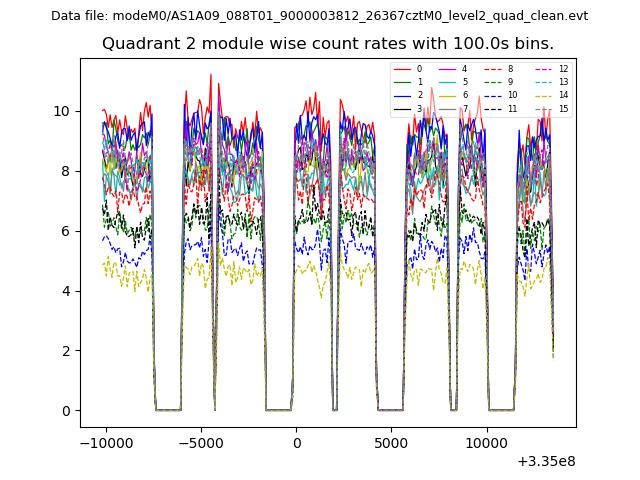
| Module-wise count rates for Quadrant B Data is divided into 100 sec bins |
 |
 |
| Module-wise count rates for Quadrant C Data is divided into 100 sec bins |
 |
 |
| Module-wise count rates for Quadrant D Data is divided into 100 sec bins |
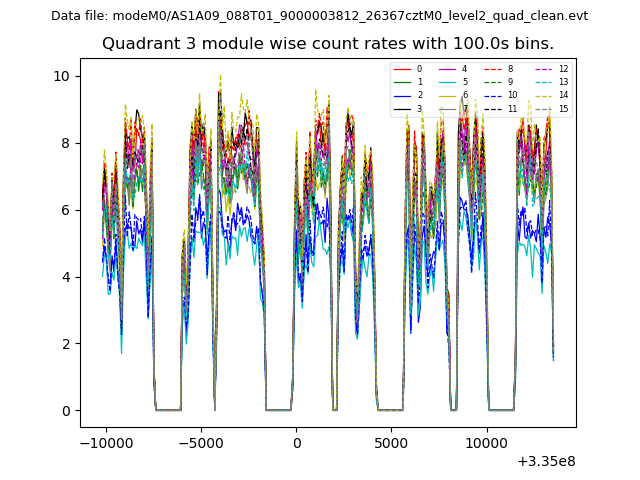 |
 |
| Parameter | Plot |
|---|---|
| CZT HV Monitor | 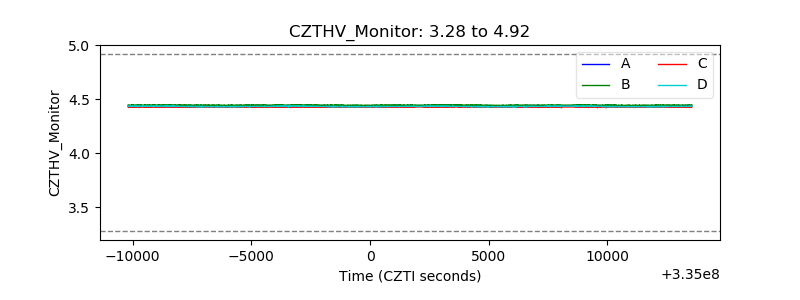 |
| D_VDD | 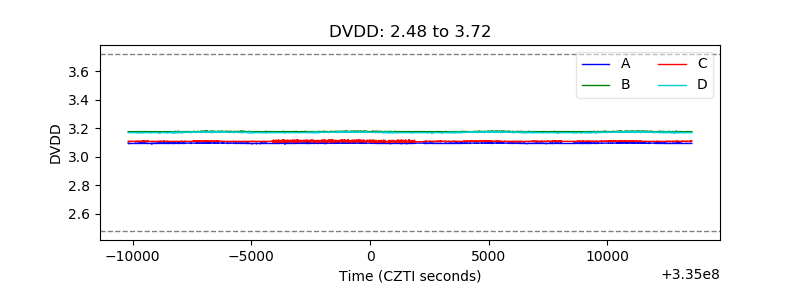 |
| Temperature 1 | 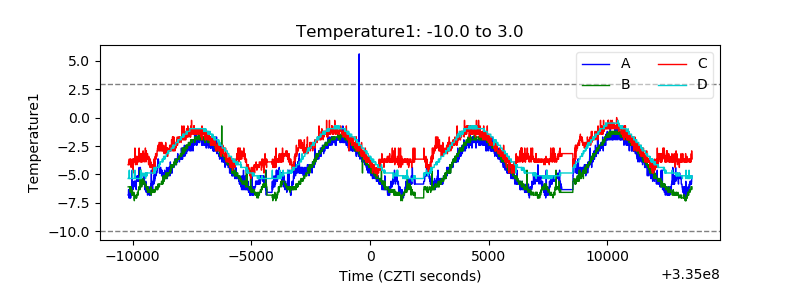 |
| Veto HV Monitor | 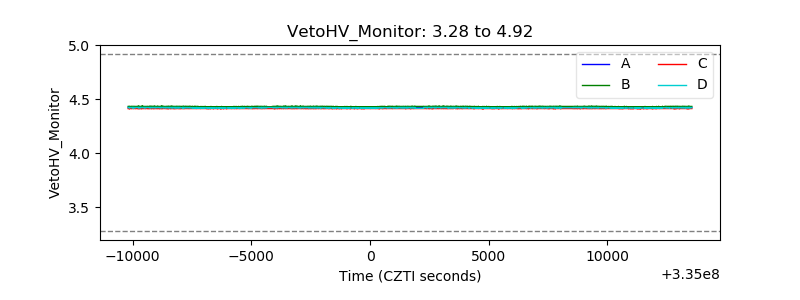 |
| Veto LLD | 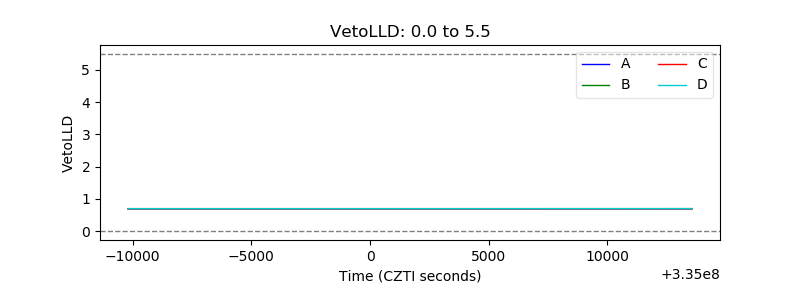 |
| Alpha Counter | 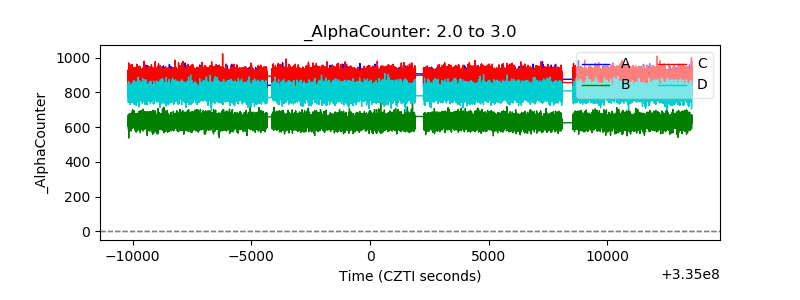 |
| _CPM_Rate | 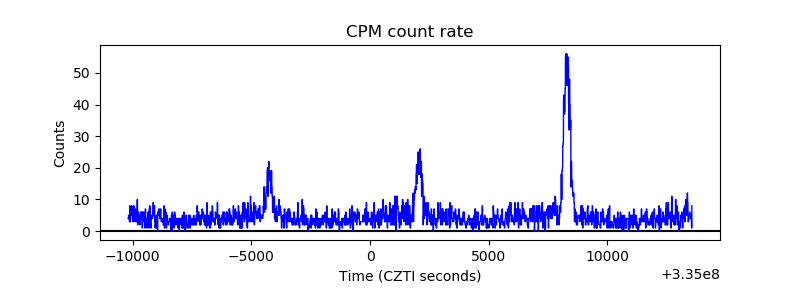 |
| CZT Counter | 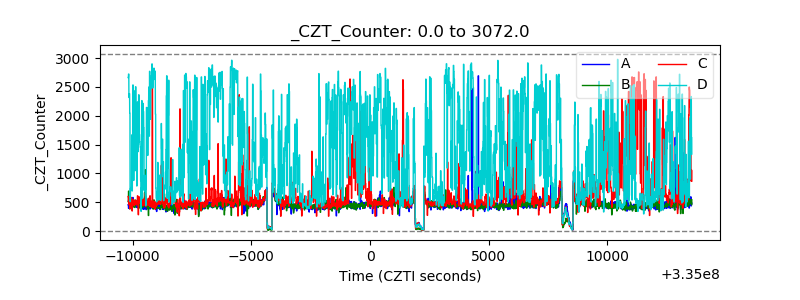 |
| +2.5 Volts monitor |  |
| +5 Volts monitor | 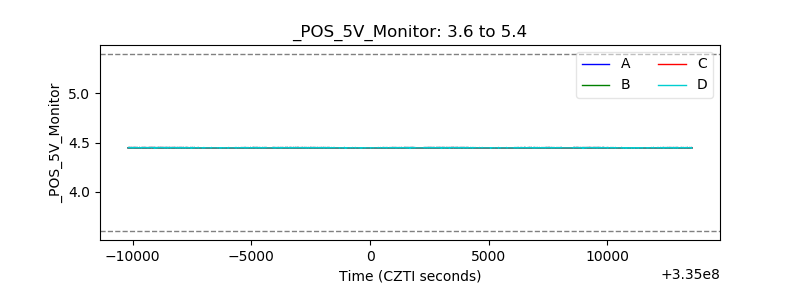 |
| _ROLL_ROT | 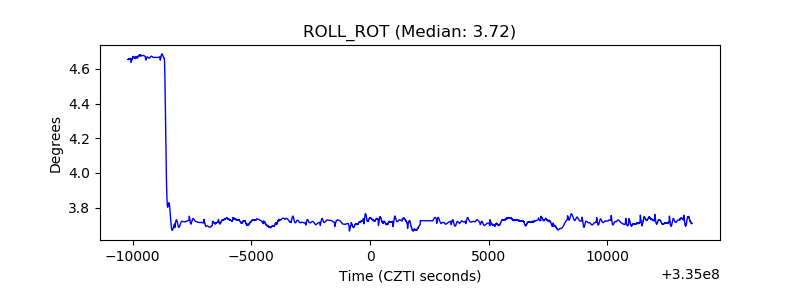 |
| _Roll_DEC | 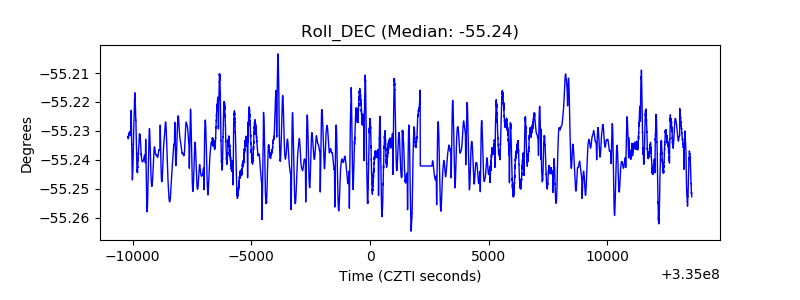 |
| _Roll_RA |  |
| Veto Counter | 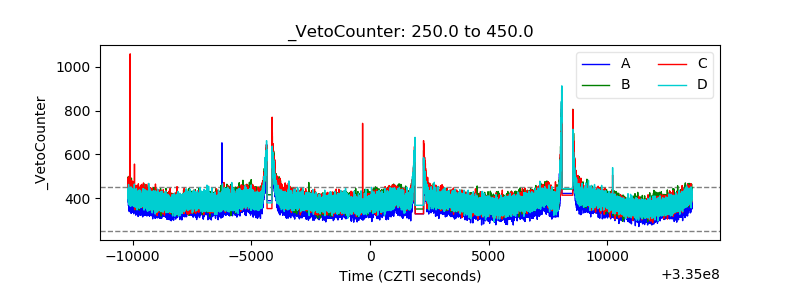 |