| Param | Original file | Final file |
|---|---|---|
| Filename | modeM0/AS1A09_088T01_9000003812_26368cztM0_level2.evt | modeM0/AS1A09_088T01_9000003812_26368cztM0_level2_quad_clean.evt |
| Size (bytes) | 1,651,440,960 | 176,569,920 |
| Size | 1.5 GB | 168.4 MB |
| Events in quadrant A | 6,694,622 | 1,181,550 |
| Events in quadrant B | 6,556,188 | 1,208,003 |
| Events in quadrant C | 15,914,613 | 1,042,992 |
| Events in quadrant D | 19,937,514 | 977,123 |
| Mode M9 | |||
|---|---|---|---|
| Quadrant | BADHDUFLAG | Total packets | Discarded packets |
| A | 0 | 25 | 0 |
| B | 0 | 25 | 0 |
| C | 0 | 25 | 0 |
| D | 0 | 25 | 0 |
| Mode M0 | |||
|---|---|---|---|
| Quadrant | BADHDUFLAG | Total packets | Discarded packets |
| A | 0 | 28741 | 0 |
| B | 0 | 28226 | 0 |
| C | 0 | 56587 | 0 |
| D | 0 | 68551 | 0 |
| Quadrant | Total seconds | Saturated seconds | Saturation percentage |
|---|---|---|---|
| A | 13544 | 182 | 1.343768% |
| B | 13545 | 176 | 1.299372% |
| C | 13545 | 3605 | 26.614987% |
| D | 13545 | 4881 | 36.035437% |
Noise dominated data is calculated using 1-second bins in cleaned event files. If a bin has >2000 counts, and if more than 50% of those come from <1% of pixels, then it is considered to be noise-dominated and hence unusable.
| Quadrant | # 1 sec bins | Bins with >0 counts | Bins with >2000 counts | High rate bins dominated by noise | Noise dominated (total time) | Noise dominated (detector-on time) | Marked lightcurve |
|---|---|---|---|---|---|---|---|
| A | 16084 | 13546 | 24 | 24 | 0.15% | 0.18% | 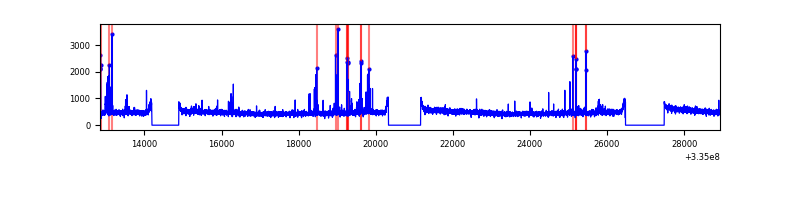 |
| B | 16085 | 13547 | 3 | 3 | 0.02% | 0.02% | 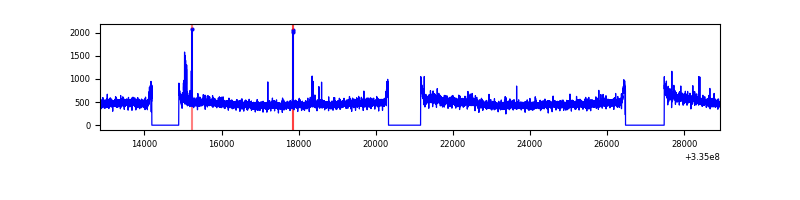 |
| C | 16085 | 13547 | 2144 | 2144 | 13.33% | 15.83% | 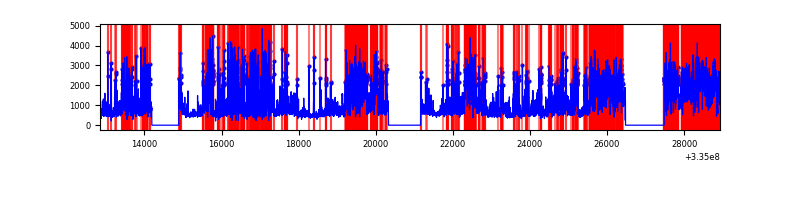 |
| D | 16085 | 13546 | 3564 | 3564 | 22.16% | 26.31% | 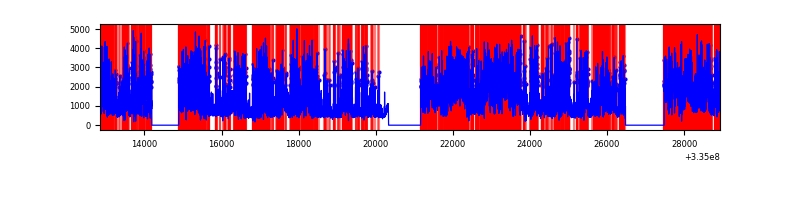 |
Top three noisy pixels from each quadrant. If the there are fewer than three noisy pixels in the level2.evt file, extra rows are filled as -1
| Pixel properties | Quadrant properties | ||||||
|---|---|---|---|---|---|---|---|
| Quadrant | DetID | PixID | Counts | Sigma | Mean | Median | Sigma |
| A | 0 | 13 | 229139 | 686.51 | 1657 | 1624 | 331.4 |
| A | 11 | 29 | 46289 | 134.77 | 1657 | 1624 | 331.4 |
| A | 6 | 16 | 25224 | 71.21 | 1657 | 1624 | 331.4 |
| B | 0 | 230 | 114497 | 364.94 | 1648 | 1607 | 309.3 |
| B | 12 | 111 | 37915 | 117.37 | 1648 | 1607 | 309.3 |
| B | 11 | 111 | 34285 | 105.64 | 1648 | 1607 | 309.3 |
| C | 3 | 233 | 8021985 | 24233.47 | 1429 | 1435 | 331.0 |
| C | 2 | 16 | 1724542 | 5206.23 | 1429 | 1435 | 331.0 |
| C | 4 | 254 | 378022 | 1137.83 | 1429 | 1435 | 331.0 |
| D | 7 | 80 | 9170866 | 28056.54 | 1374 | 1333 | 326.8 |
| D | 1 | 52 | 4811953 | 14719.33 | 1374 | 1333 | 326.8 |
| D | 11 | 176 | 636118 | 1942.29 | 1374 | 1333 | 326.8 |
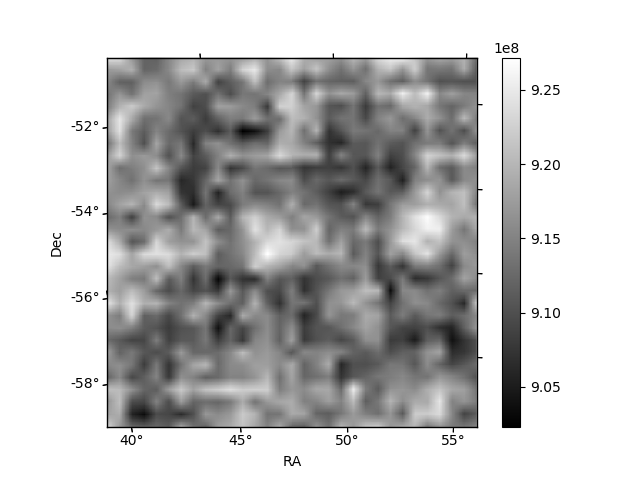
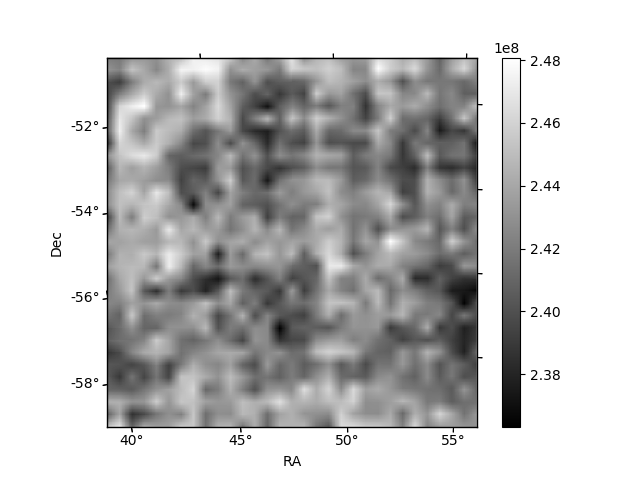
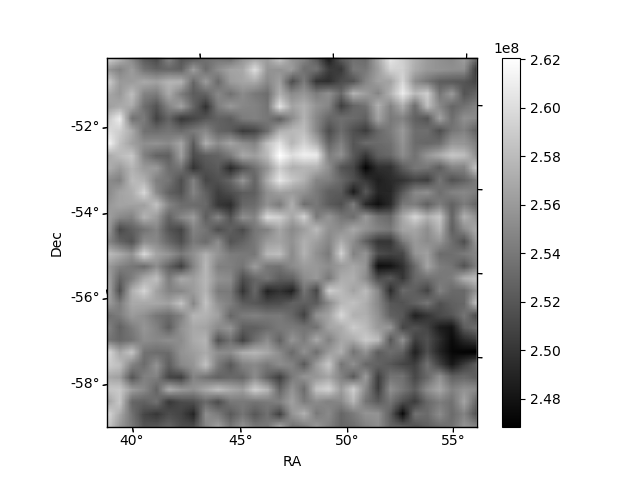
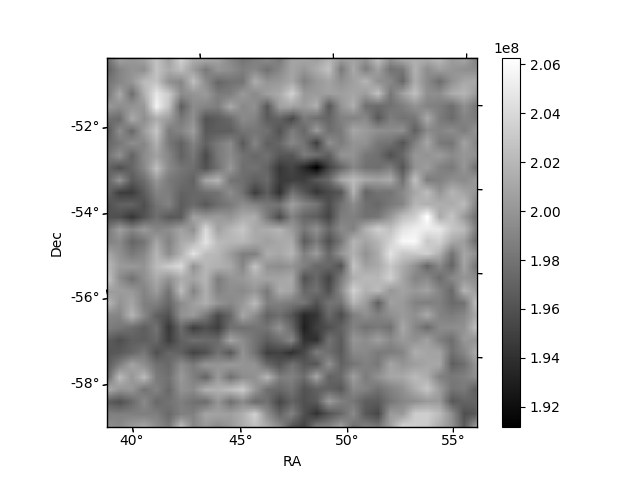
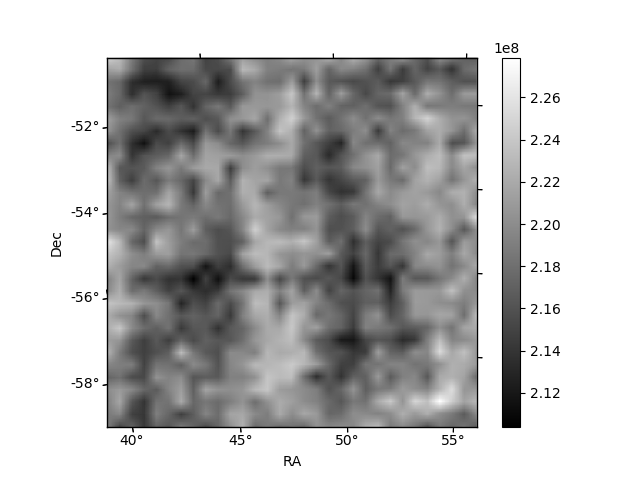
Histogram calculated using DETX and DETY for each event in the final _common_clean file
| Quadrant A | 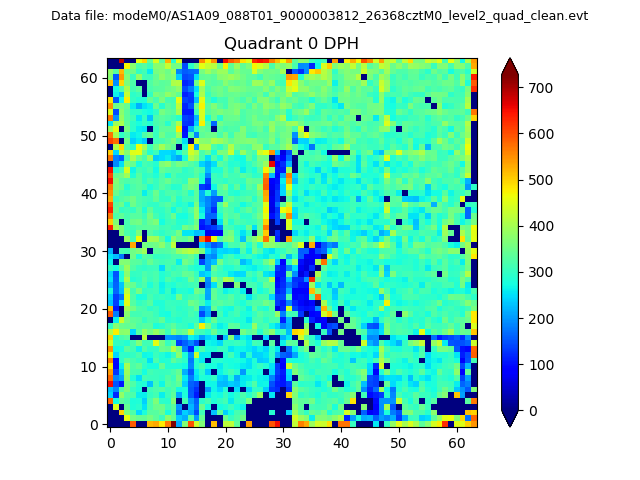 |
 |
Quadrant B |
|---|---|---|---|
| Quadrant D | 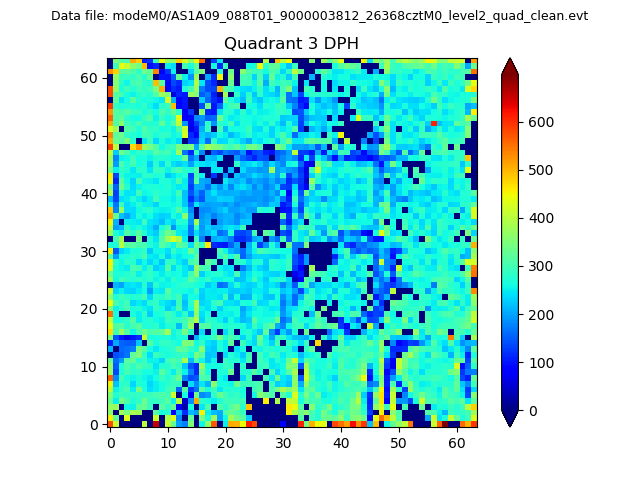 |
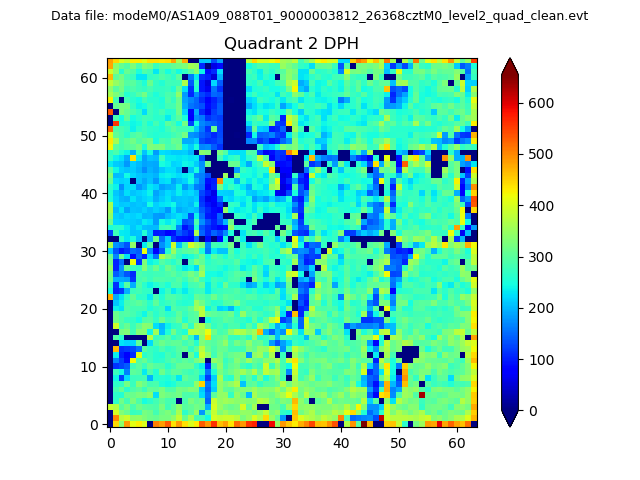 |
Quadrant C |
| Plot type | Count rate plots | Images |
|---|---|---|
| Comparison with Poisson distribution Blue bars denote a histogram of data divided into 1 sec bins. Red curve is a Poisson curve with rate = median count rate of data. |
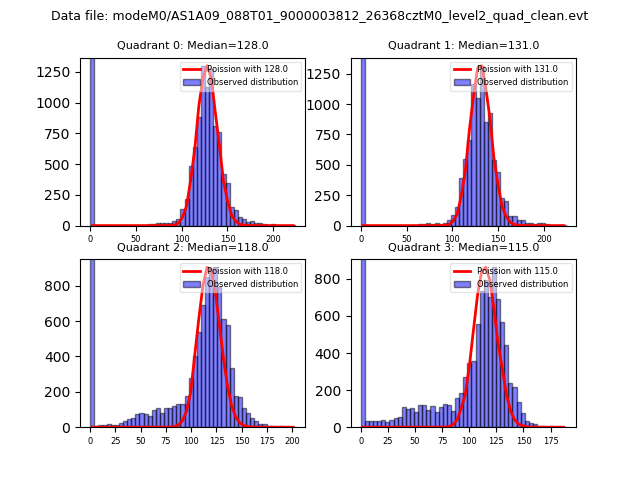 |
 |
| Quadrant-wise count rates Data is divided into 100 sec bins |
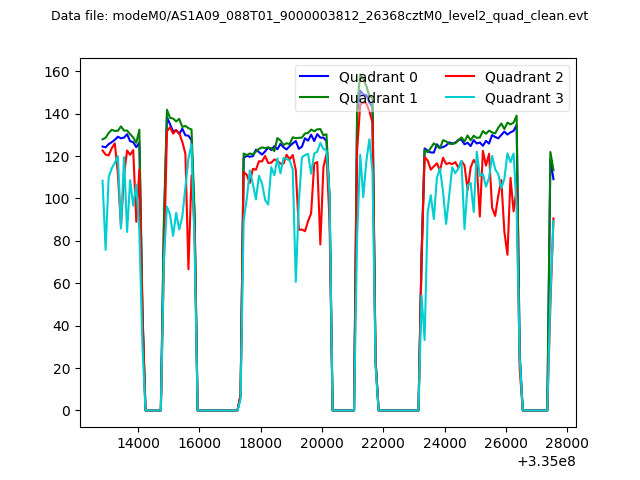 |
|
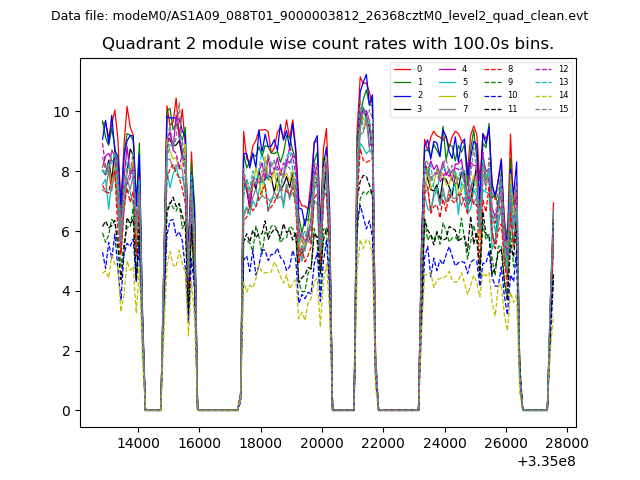
| Module-wise count rates for Quadrant A Data is divided into 100 sec bins |
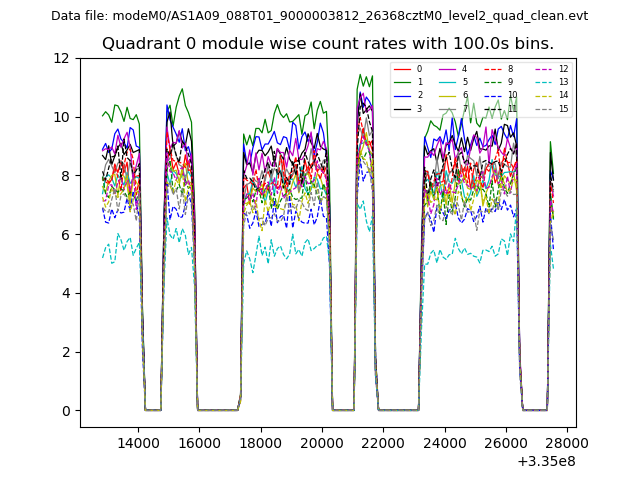 |
 |
| Module-wise count rates for Quadrant B Data is divided into 100 sec bins |
 |
 |
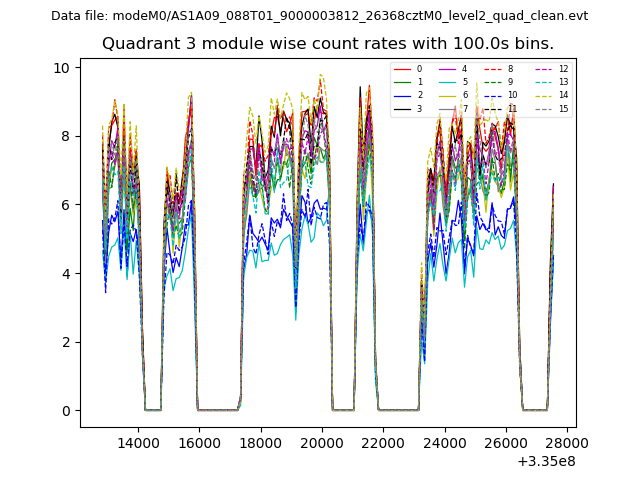
| Module-wise count rates for Quadrant C Data is divided into 100 sec bins |
 |
 |
| Module-wise count rates for Quadrant D Data is divided into 100 sec bins |
 |
 |
| Parameter | Plot |
|---|---|
| CZT HV Monitor |  |
| D_VDD | 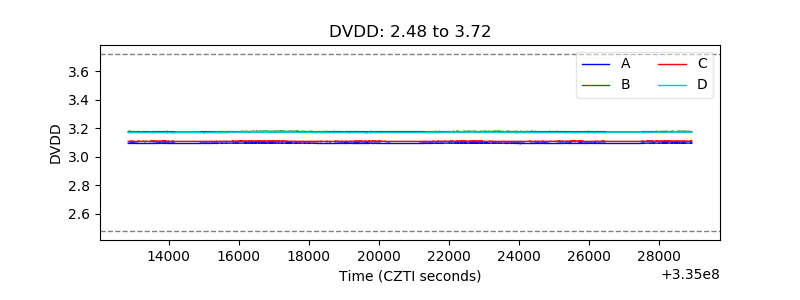 |
| Temperature 1 | 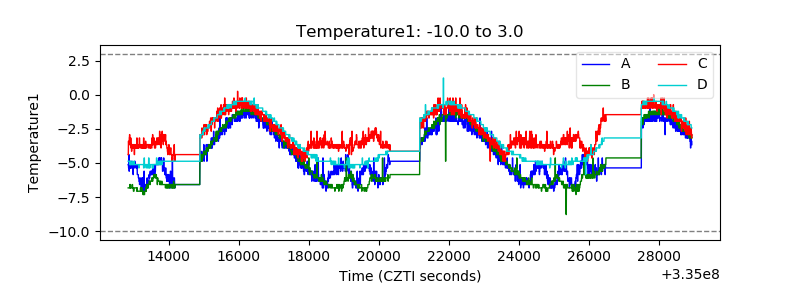 |
| Veto HV Monitor | 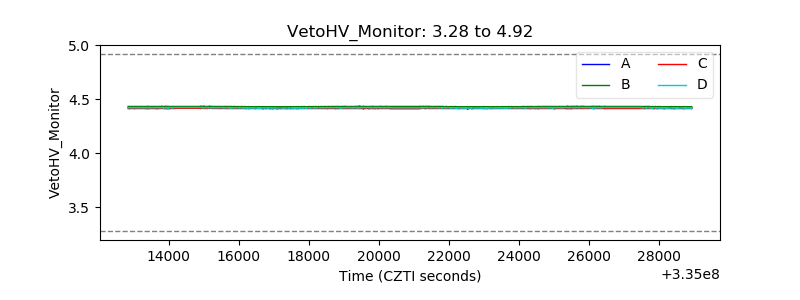 |
| Veto LLD | 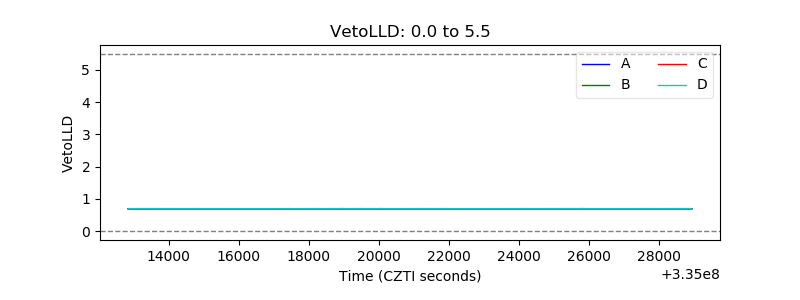 |
| Alpha Counter | 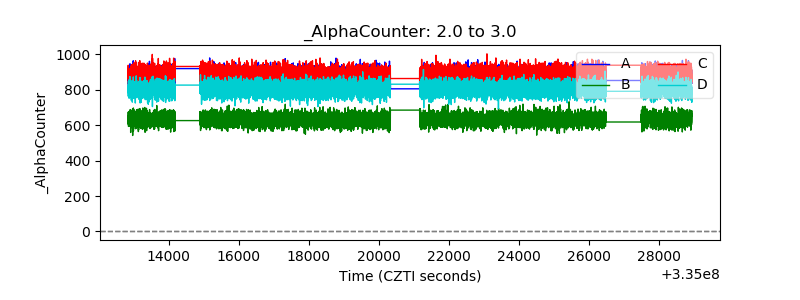 |
| _CPM_Rate | 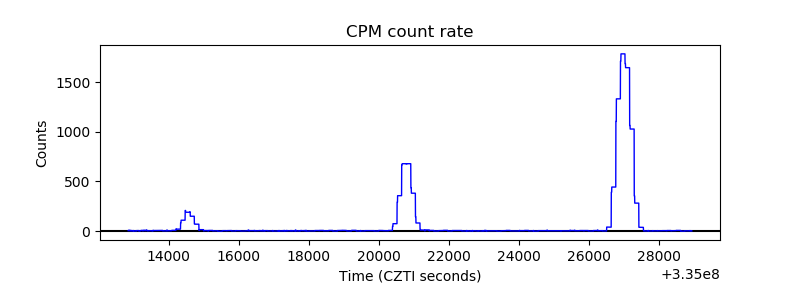 |
| CZT Counter | 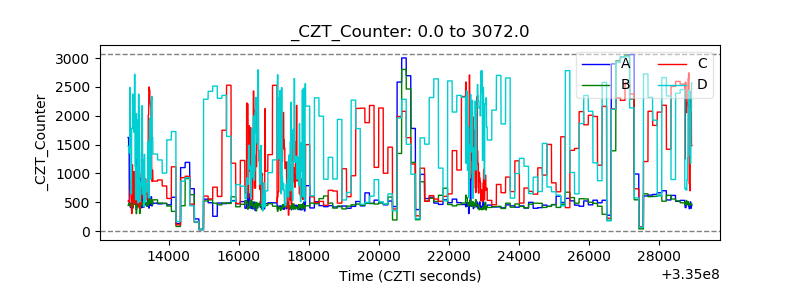 |
| +2.5 Volts monitor |  |
| +5 Volts monitor | 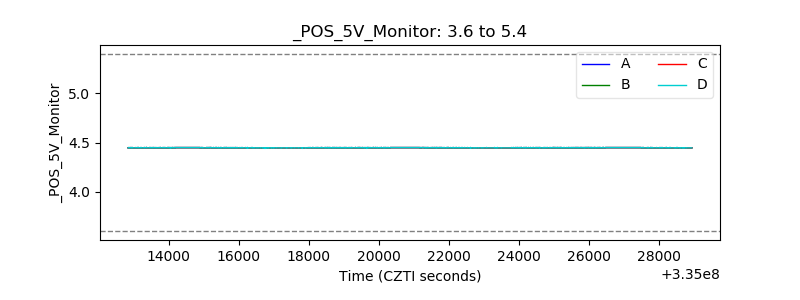 |
| _ROLL_ROT | 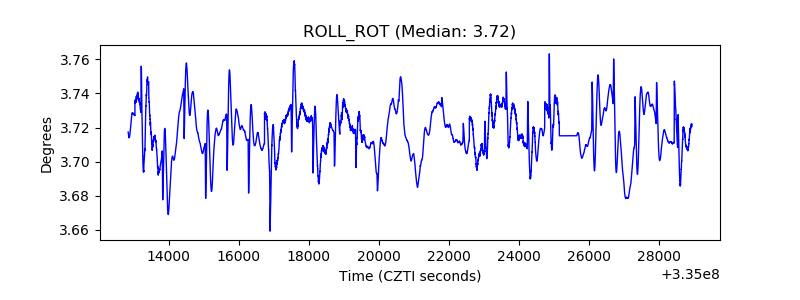 |
| _Roll_DEC | 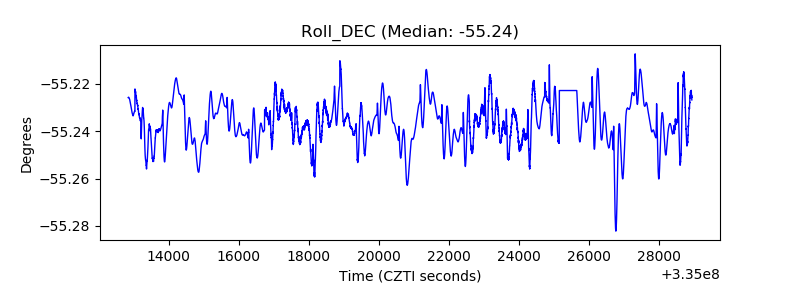 |
| _Roll_RA | 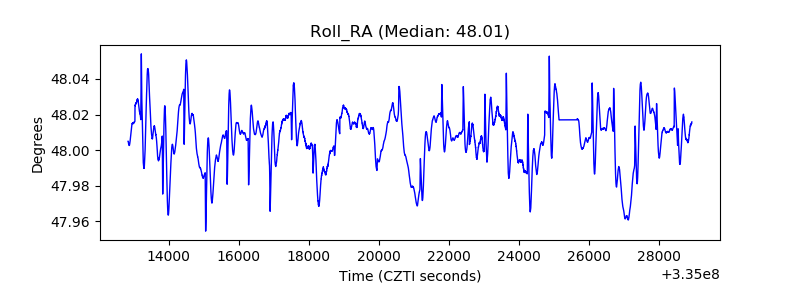 |
| Veto Counter | 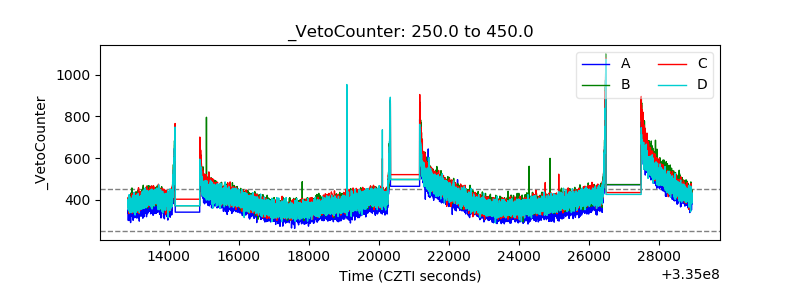 |