| Param | Original file | Final file |
|---|---|---|
| Filename | modeM0/AS1A09_088T01_9000003812_26370cztM0_level2.evt | modeM0/AS1A09_088T01_9000003812_26370cztM0_level2_quad_clean.evt |
| Size (bytes) | 783,806,400 | 71,340,480 |
| Size | 747.5 MB | 68.0 MB |
| Events in quadrant A | 3,307,919 | 464,597 |
| Events in quadrant B | 3,083,066 | 477,051 |
| Events in quadrant C | 8,566,229 | 382,096 |
| Events in quadrant D | 8,369,218 | 409,885 |
| Mode M9 | |||
|---|---|---|---|
| Quadrant | BADHDUFLAG | Total packets | Discarded packets |
| A | 0 | 11 | 0 |
| B | 0 | 11 | 0 |
| C | 0 | 11 | 0 |
| D | 0 | 11 | 0 |
| Mode M0 | |||
|---|---|---|---|
| Quadrant | BADHDUFLAG | Total packets | Discarded packets |
| A | 0 | 13826 | 0 |
| B | 0 | 13086 | 0 |
| C | 0 | 29763 | 0 |
| D | 0 | 29043 | 0 |
| Quadrant | Total seconds | Saturated seconds | Saturation percentage |
|---|---|---|---|
| A | 6096 | 127 | 2.083333% |
| B | 6096 | 55 | 0.902231% |
| C | 6096 | 2091 | 34.301181% |
| D | 6096 | 1746 | 28.641732% |
Noise dominated data is calculated using 1-second bins in cleaned event files. If a bin has >2000 counts, and if more than 50% of those come from <1% of pixels, then it is considered to be noise-dominated and hence unusable.
| Quadrant | # 1 sec bins | Bins with >0 counts | Bins with >2000 counts | High rate bins dominated by noise | Noise dominated (total time) | Noise dominated (detector-on time) | Marked lightcurve |
|---|---|---|---|---|---|---|---|
| A | 7241 | 6097 | 69 | 69 | 0.95% | 1.13% | 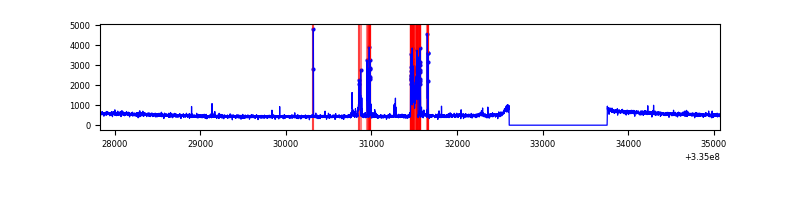 |
| B | 7241 | 6097 | 0 | 0 | 0.00% | 0.00% | 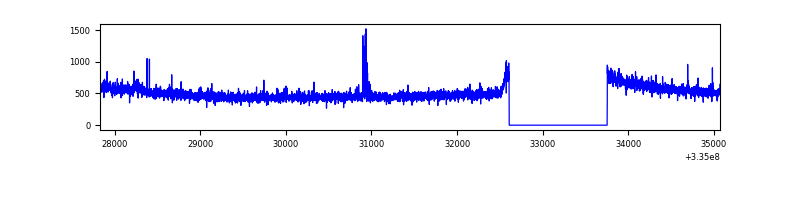 |
| C | 7241 | 6097 | 1449 | 1449 | 20.01% | 23.77% | 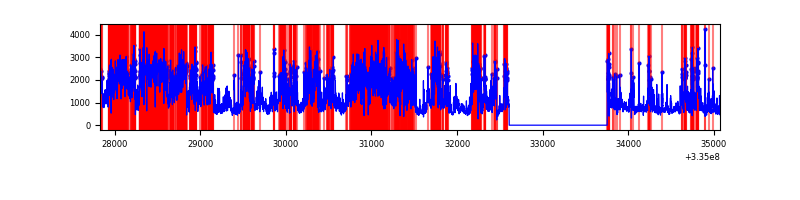 |
| D | 7241 | 6097 | 1340 | 1340 | 18.51% | 21.98% | 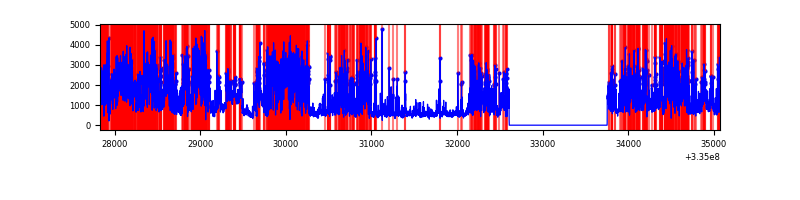 |
Top three noisy pixels from each quadrant. If the there are fewer than three noisy pixels in the level2.evt file, extra rows are filled as -1
| Pixel properties | Quadrant properties | ||||||
|---|---|---|---|---|---|---|---|
| Quadrant | DetID | PixID | Counts | Sigma | Mean | Median | Sigma |
| A | 0 | 13 | 314102 | 2028.27 | 774 | 760 | 154.5 |
| A | 13 | 254 | 10503 | 63.07 | 774 | 760 | 154.5 |
| A | 3 | 137 | 6754 | 38.8 | 774 | 760 | 154.5 |
| B | 0 | 230 | 54519 | 370.67 | 775 | 757 | 145.0 |
| B | 12 | 111 | 16746 | 110.24 | 775 | 757 | 145.0 |
| B | 11 | 111 | 15130 | 99.1 | 775 | 757 | 145.0 |
| C | 3 | 233 | 5456834 | 37151.0 | 638 | 642 | 146.9 |
| C | 4 | 254 | 316440 | 2150.26 | 638 | 642 | 146.9 |
| C | 2 | 16 | 206530 | 1401.88 | 638 | 642 | 146.9 |
| D | 7 | 80 | 4145873 | 26567.66 | 662 | 646 | 156.0 |
| D | 1 | 52 | 1547306 | 9912.88 | 662 | 646 | 156.0 |
| D | 11 | 176 | 108574 | 691.73 | 662 | 646 | 156.0 |
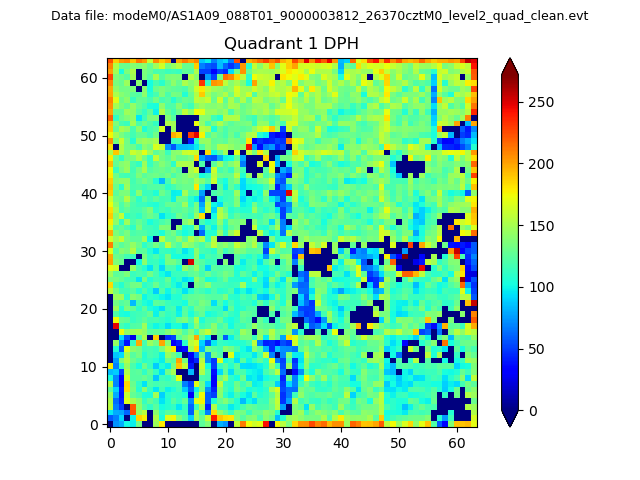
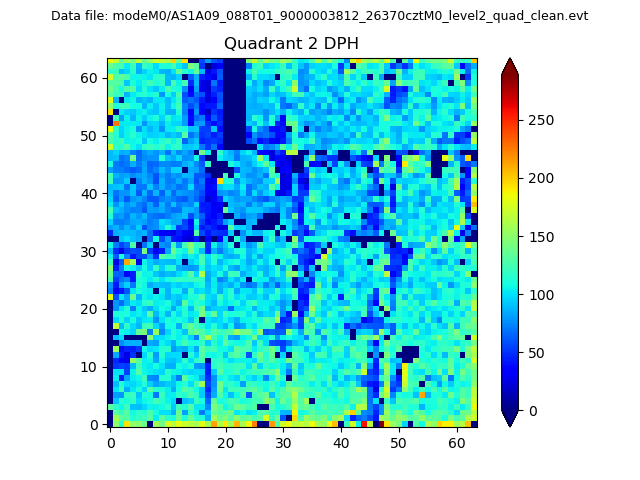
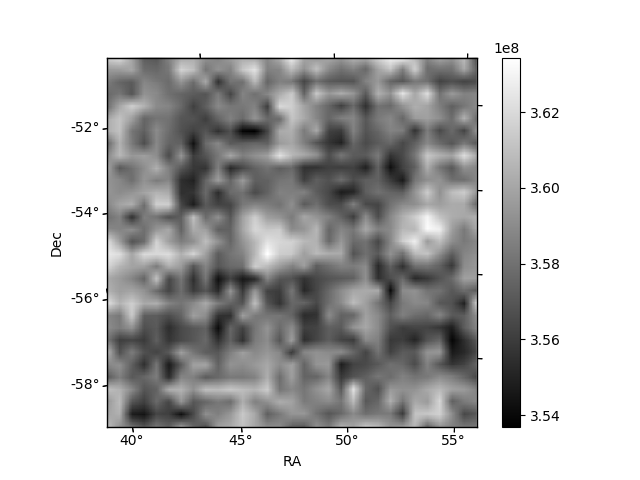
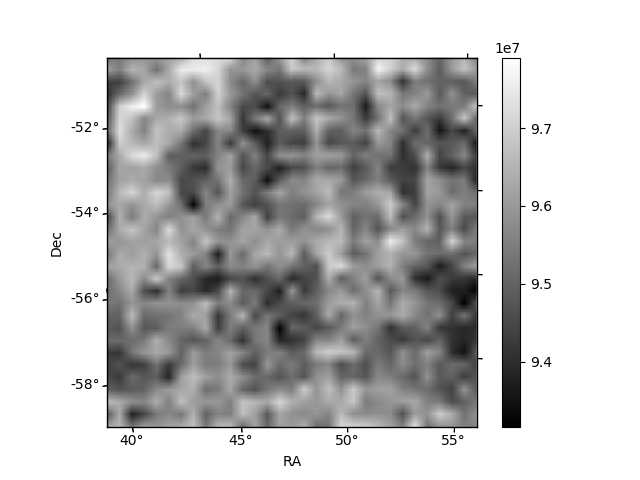
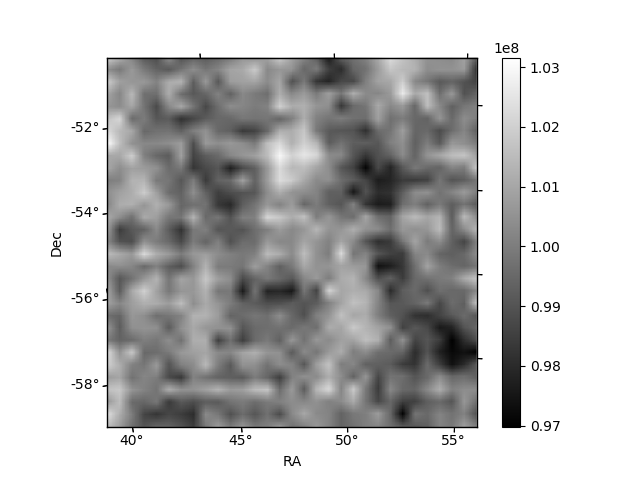
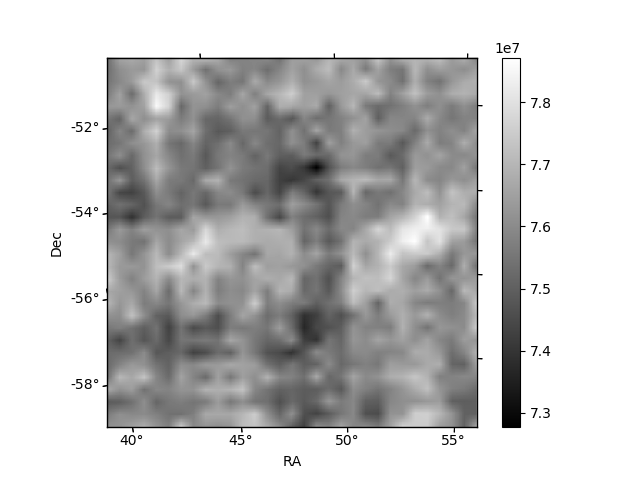
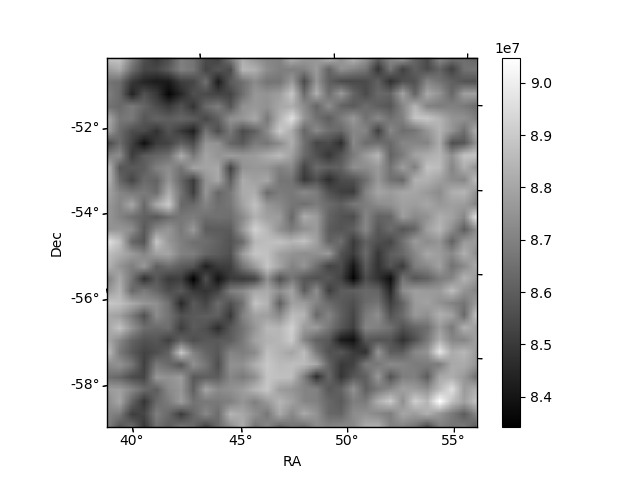
Histogram calculated using DETX and DETY for each event in the final _common_clean file
| Quadrant A |  |
 |
Quadrant B |
|---|---|---|---|
| Quadrant D | 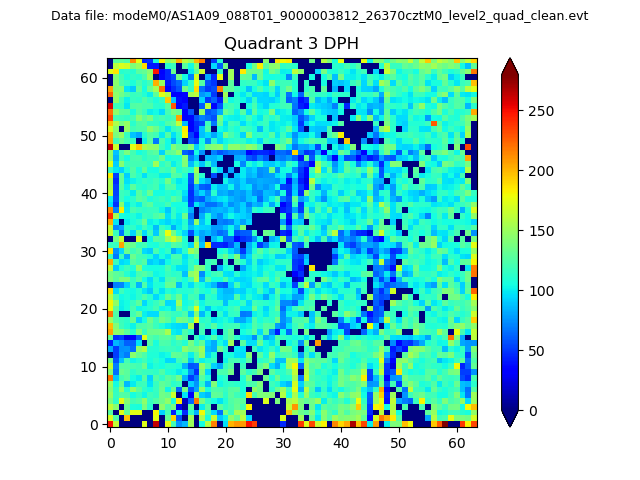 |
 |
Quadrant C |
| Plot type | Count rate plots | Images |
|---|---|---|
| Comparison with Poisson distribution Blue bars denote a histogram of data divided into 1 sec bins. Red curve is a Poisson curve with rate = median count rate of data. |
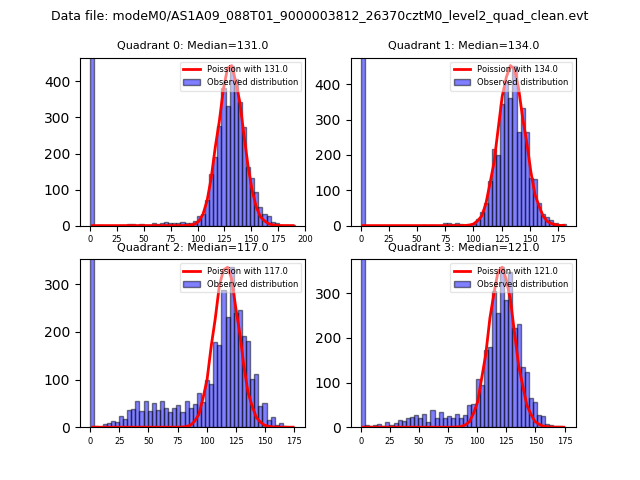 |
 |
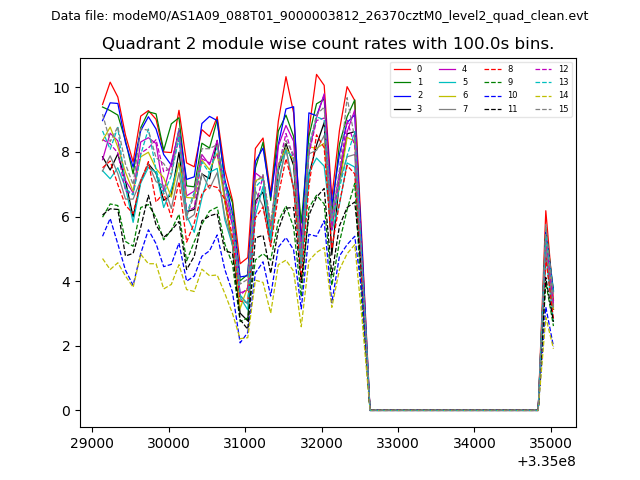
| Quadrant-wise count rates Data is divided into 100 sec bins |
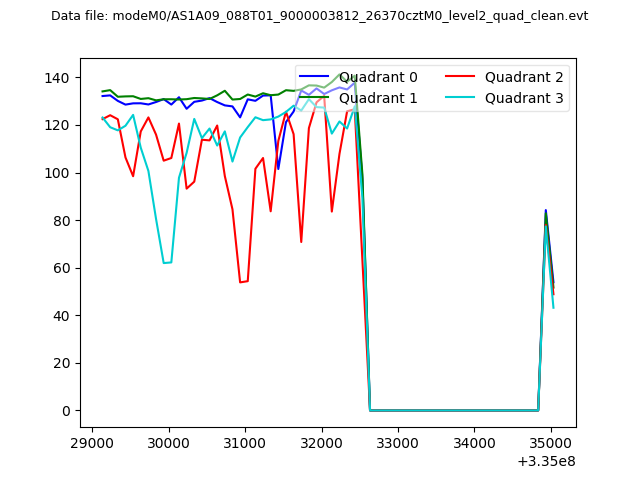 |
|
| Module-wise count rates for Quadrant A Data is divided into 100 sec bins |
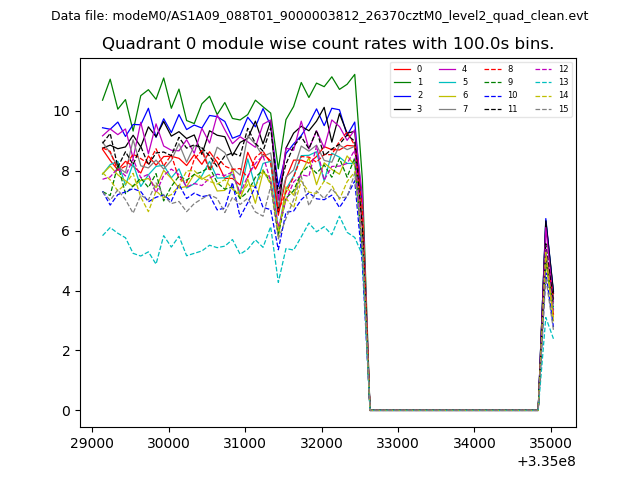 |
 |
| Module-wise count rates for Quadrant B Data is divided into 100 sec bins |
 |
 |
| Module-wise count rates for Quadrant C Data is divided into 100 sec bins |
 |
 |
| Module-wise count rates for Quadrant D Data is divided into 100 sec bins |
 |
 |
| Parameter | Plot |
|---|---|
| CZT HV Monitor |  |
| D_VDD | 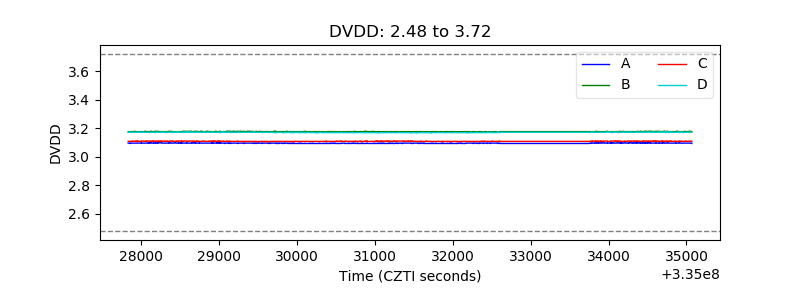 |
| Temperature 1 | 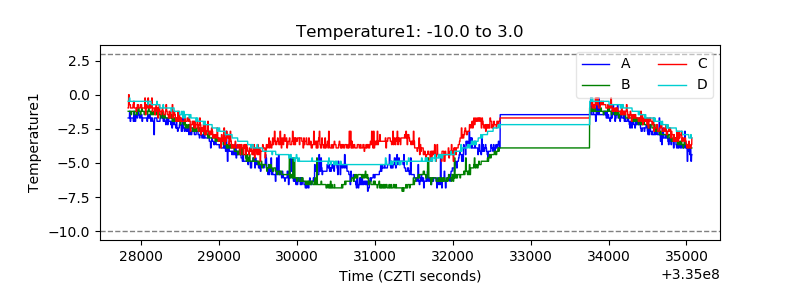 |
| Veto HV Monitor | 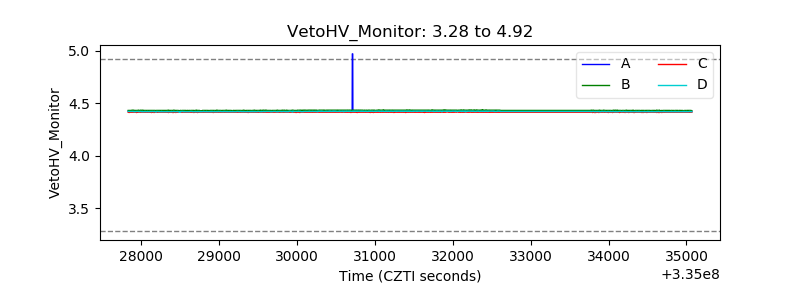 |
| Veto LLD |  |
| Alpha Counter | 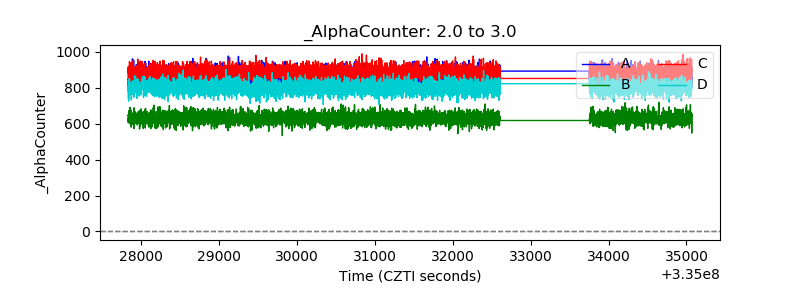 |
| _CPM_Rate | 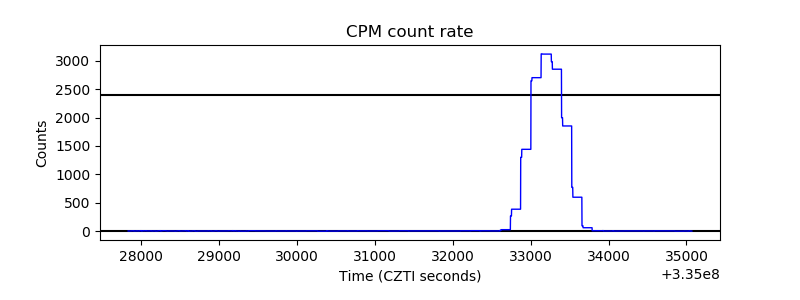 |
| CZT Counter | 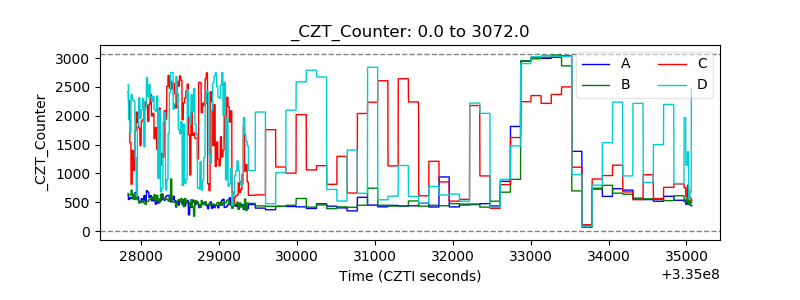 |
| +2.5 Volts monitor | 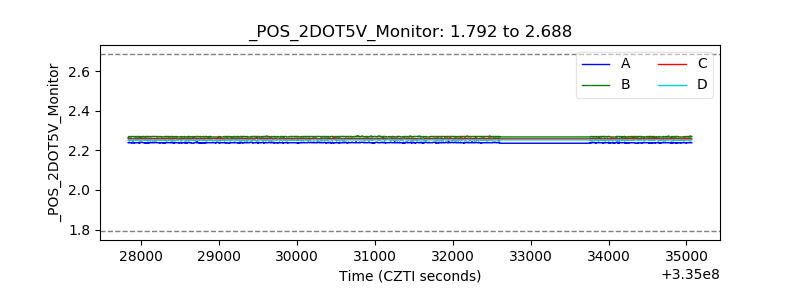 |
| +5 Volts monitor |  |
| _ROLL_ROT | 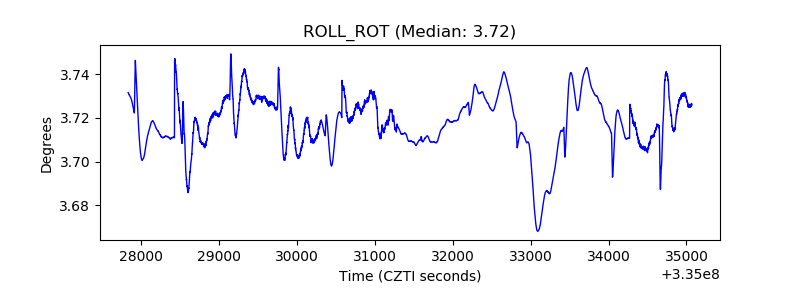 |
| _Roll_DEC | 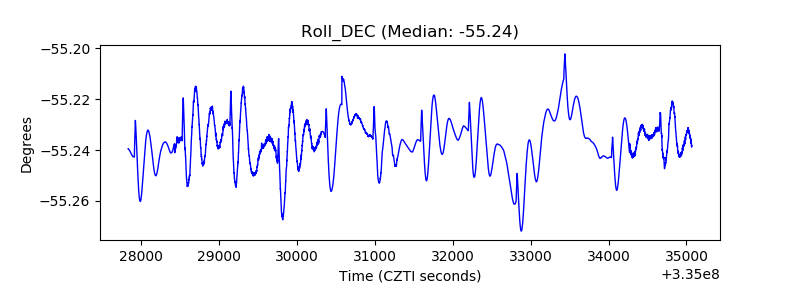 |
| _Roll_RA | 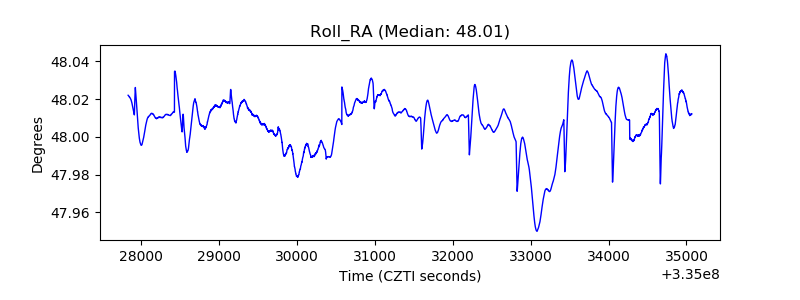 |
| Veto Counter | 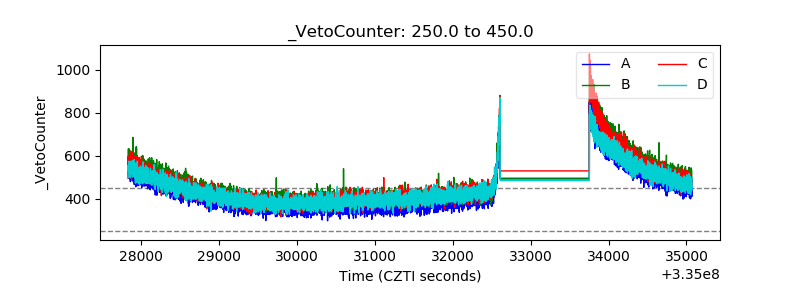 |