| Param | Original file | Final file |
|---|---|---|
| Filename | modeM0/AS1A09_088T01_9000003812_26372cztM0_level2.evt | modeM0/AS1A09_088T01_9000003812_26372cztM0_level2_quad_clean.evt |
| Size (bytes) | 755,078,400 | 105,321,600 |
| Size | 720.1 MB | 100.4 MB |
| Events in quadrant A | 3,344,260 | 743,582 |
| Events in quadrant B | 3,303,200 | 767,954 |
| Events in quadrant C | 8,257,202 | 623,754 |
| Events in quadrant D | 7,549,991 | 626,177 |
| Mode M9 | |||
|---|---|---|---|
| Quadrant | BADHDUFLAG | Total packets | Discarded packets |
| A | 0 | 20 | 0 |
| B | 0 | 21 | 0 |
| C | 0 | 21 | 0 |
| D | 0 | 21 | 0 |
| Mode M0 | |||
|---|---|---|---|
| Quadrant | BADHDUFLAG | Total packets | Discarded packets |
| A | 0 | 13854 | 0 |
| B | 0 | 13725 | 0 |
| C | 0 | 28861 | 0 |
| D | 0 | 26763 | 0 |
| Quadrant | Total seconds | Saturated seconds | Saturation percentage |
|---|---|---|---|
| A | 6121 | 64 | 1.045581% |
| B | 6121 | 65 | 1.061918% |
| C | 6120 | 2016 | 32.941176% |
| D | 6120 | 1285 | 20.996732% |
Noise dominated data is calculated using 1-second bins in cleaned event files. If a bin has >2000 counts, and if more than 50% of those come from <1% of pixels, then it is considered to be noise-dominated and hence unusable.
| Quadrant | # 1 sec bins | Bins with >0 counts | Bins with >2000 counts | High rate bins dominated by noise | Noise dominated (total time) | Noise dominated (detector-on time) | Marked lightcurve |
|---|---|---|---|---|---|---|---|
| A | 7481 | 6122 | 4 | 4 | 0.05% | 0.07% | 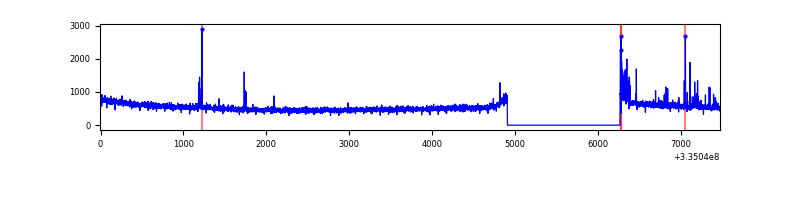 |
| B | 7481 | 6122 | 1 | 1 | 0.01% | 0.02% | 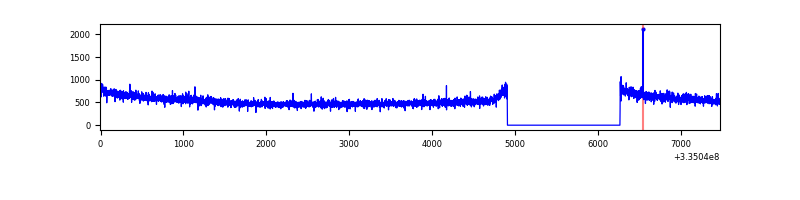 |
| C | 7480 | 6120 | 1215 | 1215 | 16.24% | 19.85% | 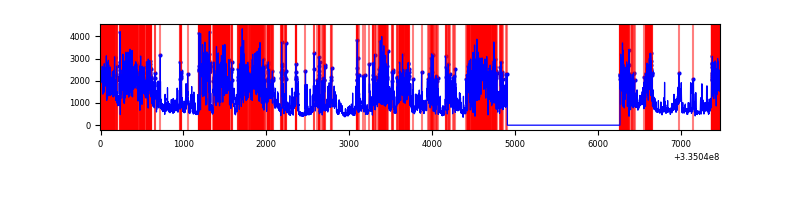 |
| D | 7480 | 6121 | 1027 | 1027 | 13.73% | 16.78% | 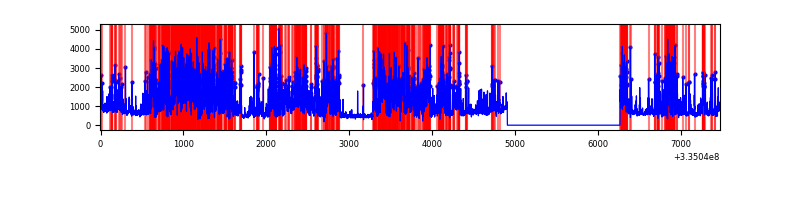 |
Top three noisy pixels from each quadrant. If the there are fewer than three noisy pixels in the level2.evt file, extra rows are filled as -1
| Pixel properties | Quadrant properties | ||||||
|---|---|---|---|---|---|---|---|
| Quadrant | DetID | PixID | Counts | Sigma | Mean | Median | Sigma |
| A | 0 | 13 | 109705 | 666.57 | 838 | 825 | 163.3 |
| A | 13 | 254 | 10204 | 57.42 | 838 | 825 | 163.3 |
| A | 0 | 226 | 7303 | 39.66 | 838 | 825 | 163.3 |
| B | 0 | 230 | 30184 | 193.0 | 840 | 821 | 152.1 |
| B | 12 | 111 | 17350 | 108.64 | 840 | 821 | 152.1 |
| B | 11 | 111 | 15658 | 97.52 | 840 | 821 | 152.1 |
| C | 3 | 233 | 5383841 | 34022.69 | 697 | 703 | 158.2 |
| C | 14 | 238 | 112372 | 705.77 | 697 | 703 | 158.2 |
| C | 4 | 254 | 23627 | 144.89 | 697 | 703 | 158.2 |
| D | 7 | 80 | 4410717 | 25407.4 | 739 | 721 | 173.6 |
| D | 11 | 176 | 132675 | 760.23 | 739 | 721 | 173.6 |
| D | 1 | 52 | 123634 | 708.14 | 739 | 721 | 173.6 |
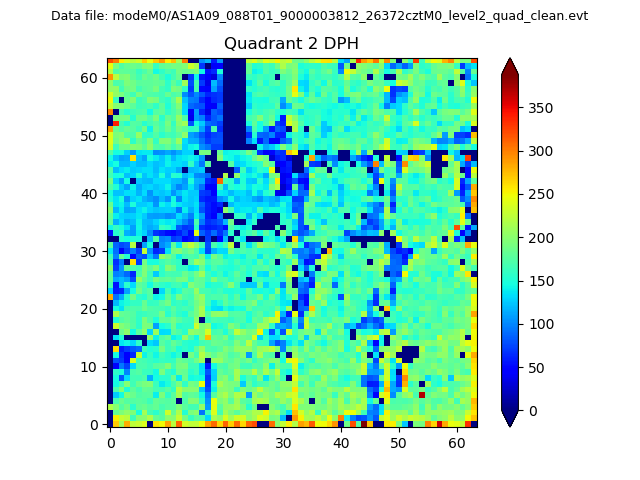
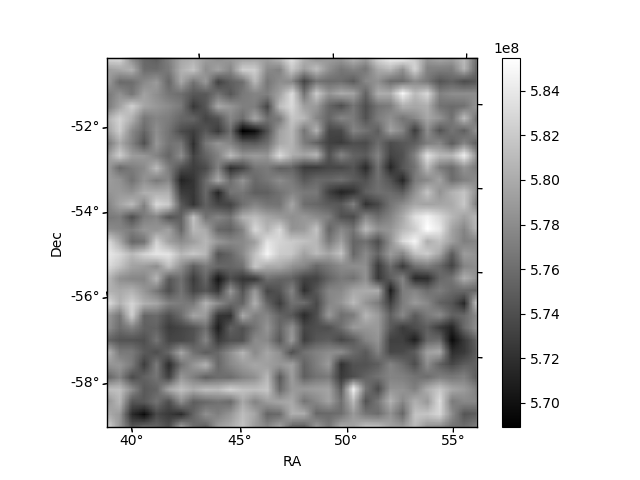
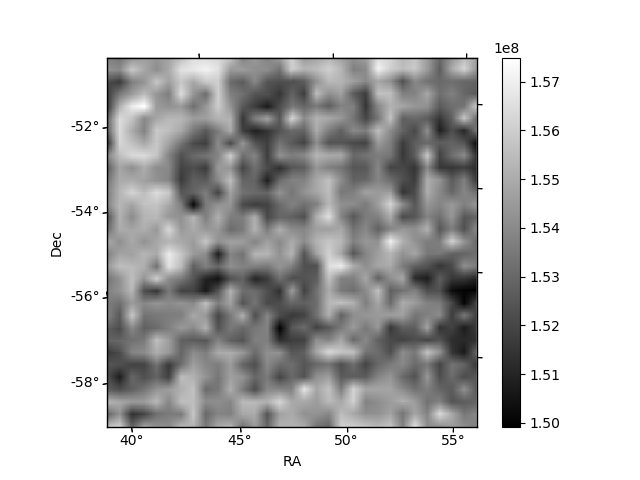
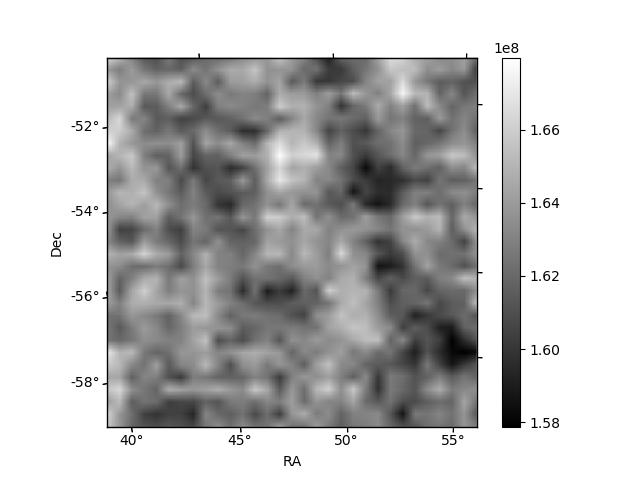
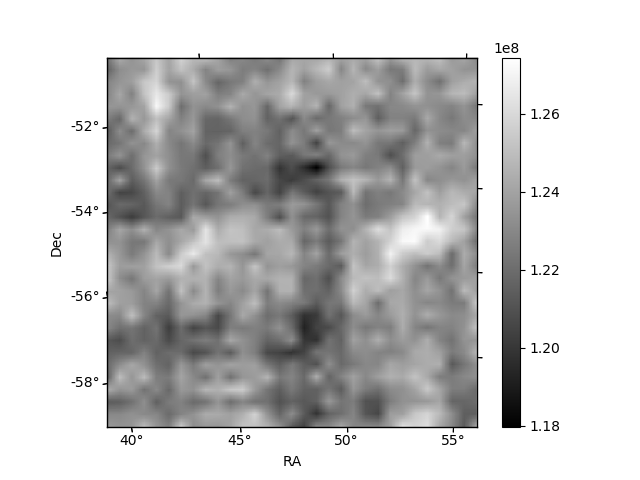
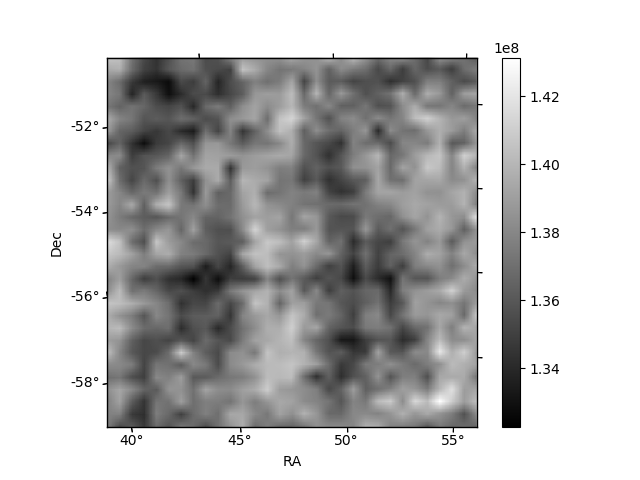
Histogram calculated using DETX and DETY for each event in the final _common_clean file
| Quadrant A | 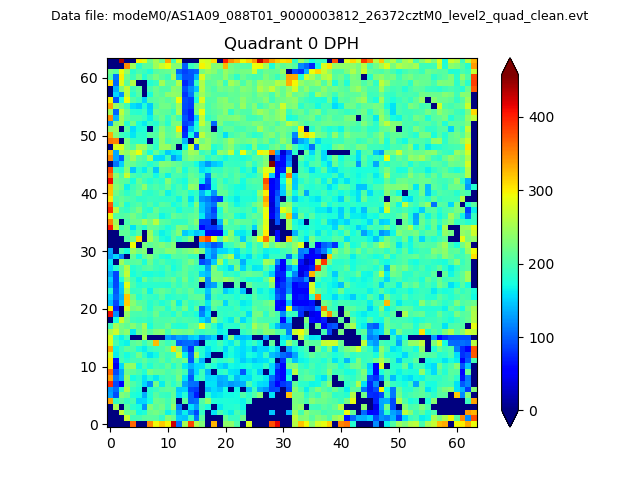 |
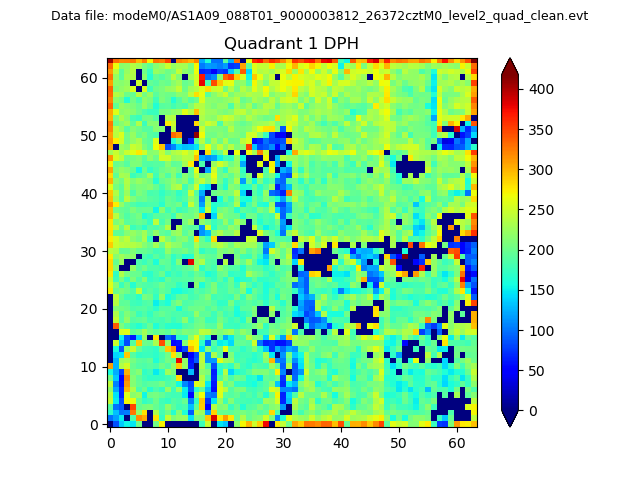 |
Quadrant B |
|---|---|---|---|
| Quadrant D | 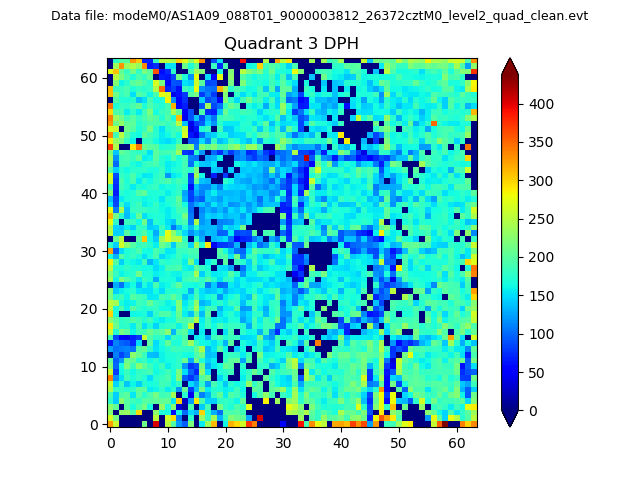 |
 |
Quadrant C |
| Plot type | Count rate plots | Images |
|---|---|---|
| Comparison with Poisson distribution Blue bars denote a histogram of data divided into 1 sec bins. Red curve is a Poisson curve with rate = median count rate of data. |
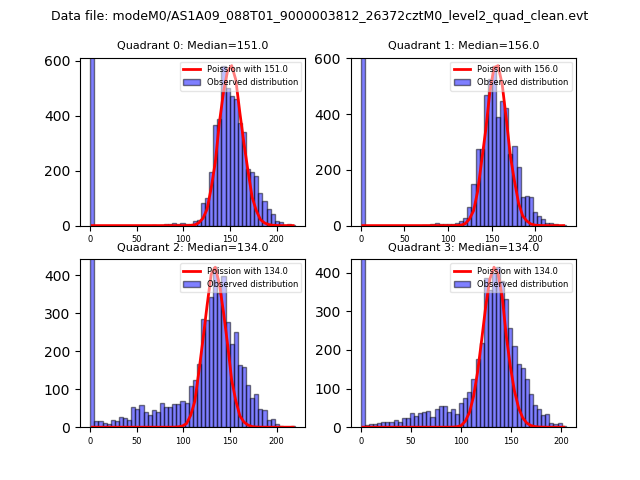 |
 |
| Quadrant-wise count rates Data is divided into 100 sec bins |
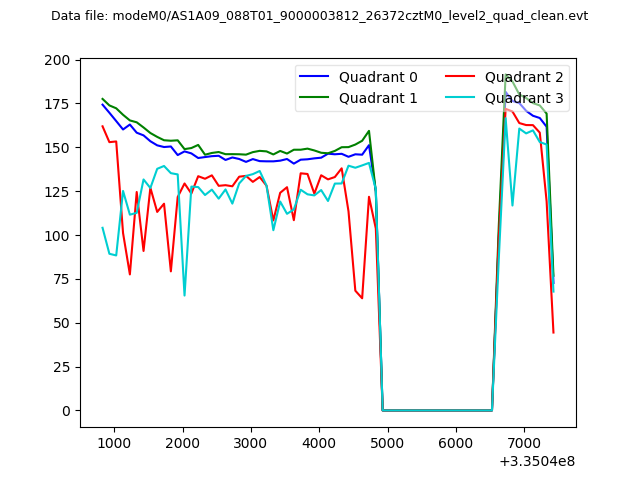 |
|
| Module-wise count rates for Quadrant A Data is divided into 100 sec bins |
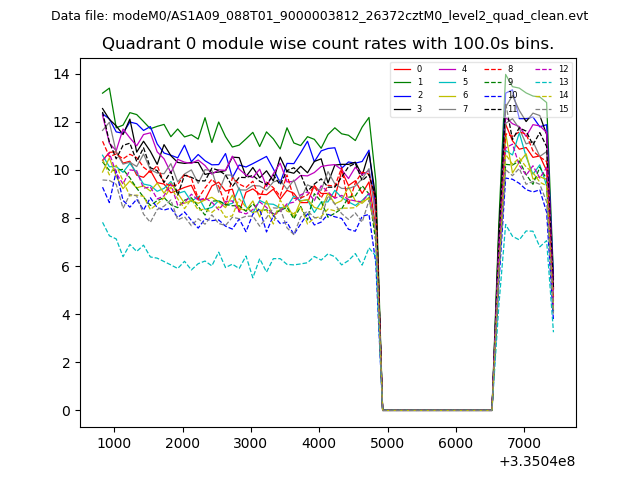 |
 |
| Module-wise count rates for Quadrant B Data is divided into 100 sec bins |
 |
 |
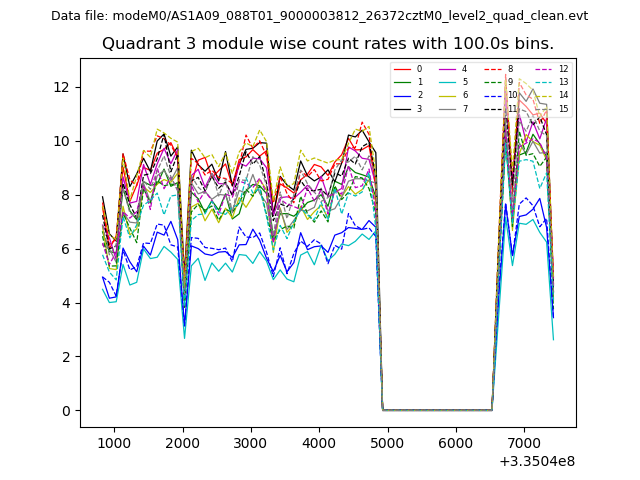
| Module-wise count rates for Quadrant C Data is divided into 100 sec bins |
 |
 |
| Module-wise count rates for Quadrant D Data is divided into 100 sec bins |
 |
 |
| Parameter | Plot |
|---|---|
| CZT HV Monitor |  |
| D_VDD | 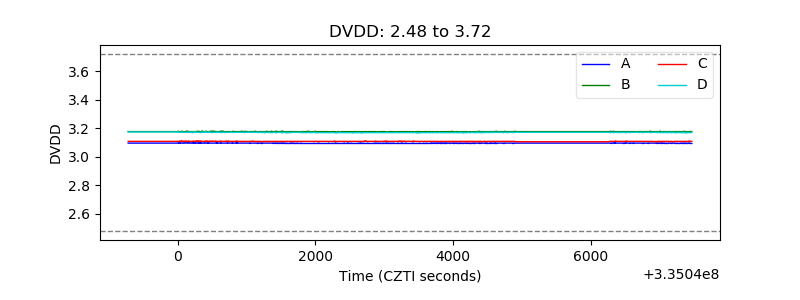 |
| Temperature 1 | 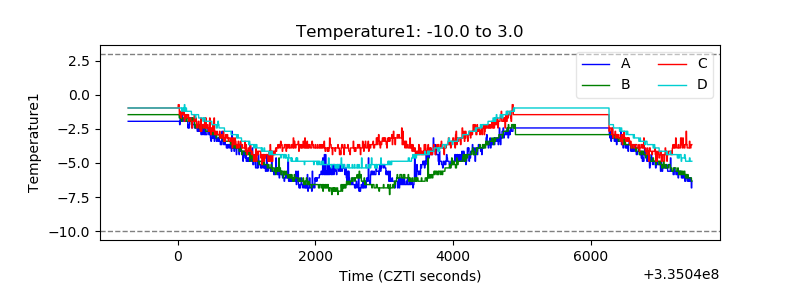 |
| Veto HV Monitor | 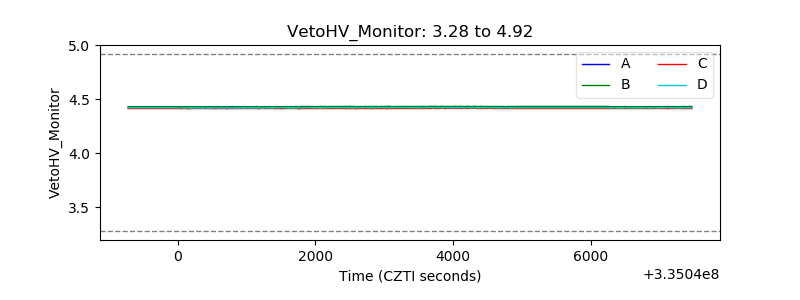 |
| Veto LLD | 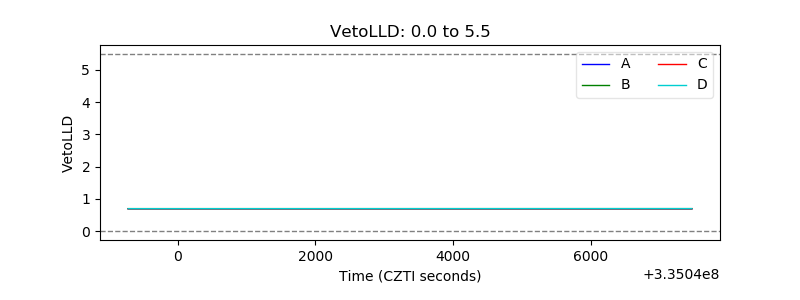 |
| Alpha Counter | 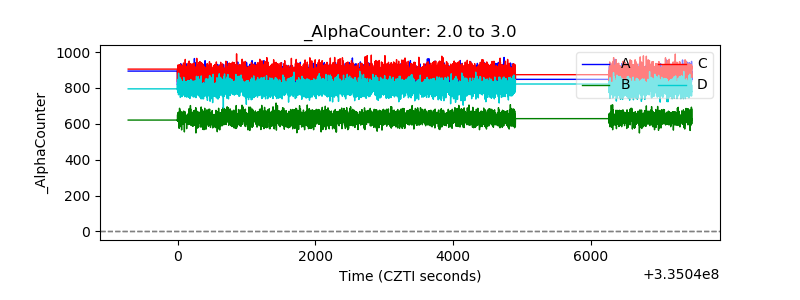 |
| _CPM_Rate | 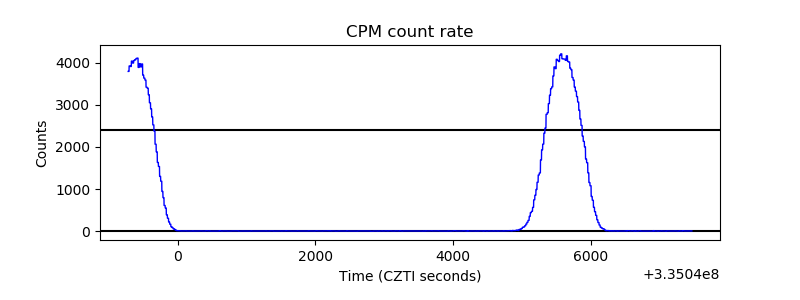 |
| CZT Counter |  |
| +2.5 Volts monitor |  |
| +5 Volts monitor | 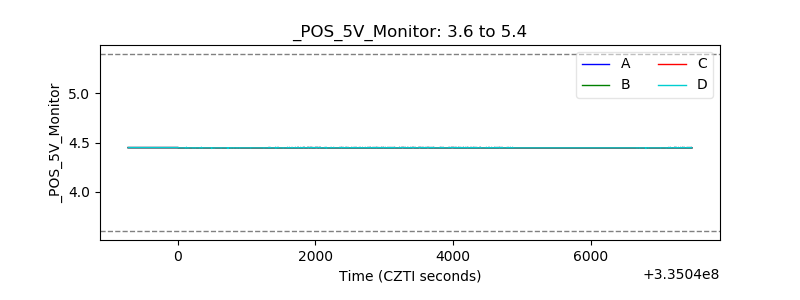 |
| _ROLL_ROT | 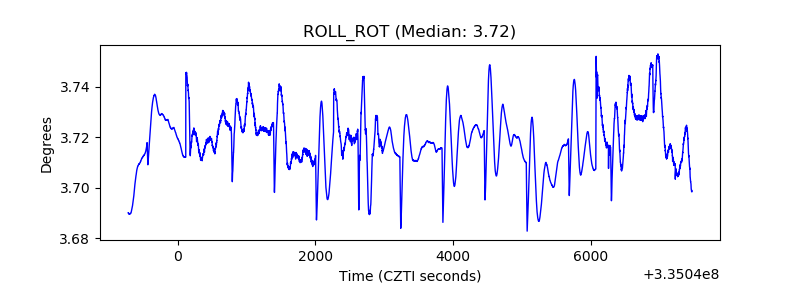 |
| _Roll_DEC | 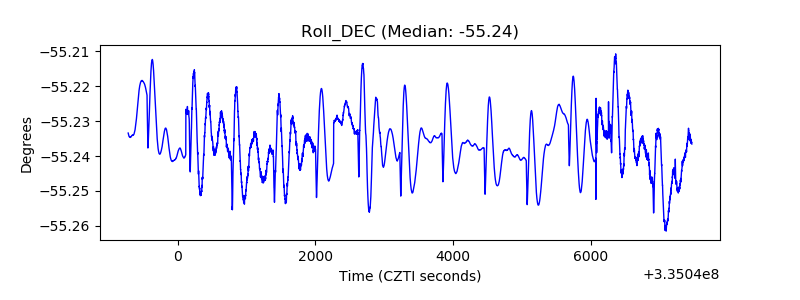 |
| _Roll_RA | 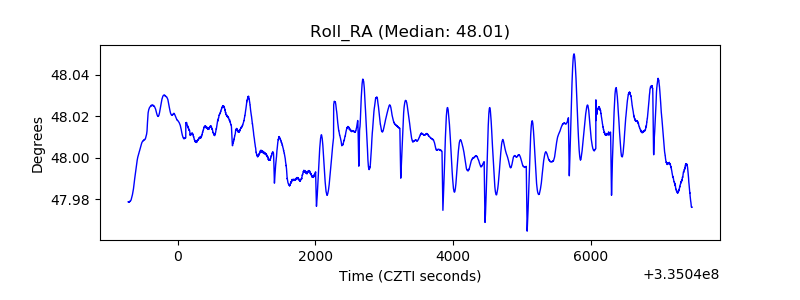 |
| Veto Counter | 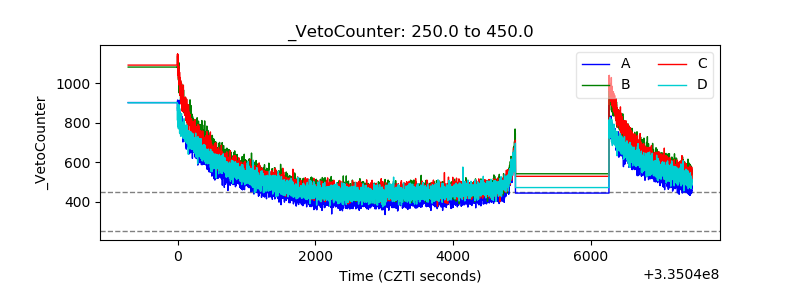 |