| Param | Original file | Final file |
|---|---|---|
| Filename | modeM0/AS1A09_088T01_9000003812_26373cztM0_level2.evt | modeM0/AS1A09_088T01_9000003812_26373cztM0_level2_quad_clean.evt |
| Size (bytes) | 638,038,080 | 123,577,920 |
| Size | 608.5 MB | 117.9 MB |
| Events in quadrant A | 3,524,652 | 858,818 |
| Events in quadrant B | 3,292,358 | 890,552 |
| Events in quadrant C | 5,762,295 | 804,371 |
| Events in quadrant D | 6,329,927 | 761,421 |
| Mode M9 | |||
|---|---|---|---|
| Quadrant | BADHDUFLAG | Total packets | Discarded packets |
| A | 0 | 13 | 0 |
| B | 0 | 13 | 0 |
| C | 0 | 13 | 0 |
| D | 0 | 13 | 0 |
| Mode M0 | |||
|---|---|---|---|
| Quadrant | BADHDUFLAG | Total packets | Discarded packets |
| A | 0 | 14261 | 0 |
| B | 0 | 13597 | 0 |
| C | 0 | 21446 | 0 |
| D | 0 | 23020 | 0 |
| Quadrant | Total seconds | Saturated seconds | Saturation percentage |
|---|---|---|---|
| A | 6115 | 94 | 1.537204% |
| B | 6116 | 54 | 0.882930% |
| C | 6116 | 760 | 12.426422% |
| D | 6116 | 915 | 14.960759% |
Noise dominated data is calculated using 1-second bins in cleaned event files. If a bin has >2000 counts, and if more than 50% of those come from <1% of pixels, then it is considered to be noise-dominated and hence unusable.
| Quadrant | # 1 sec bins | Bins with >0 counts | Bins with >2000 counts | High rate bins dominated by noise | Noise dominated (total time) | Noise dominated (detector-on time) | Marked lightcurve |
|---|---|---|---|---|---|---|---|
| A | 7475 | 6116 | 42 | 42 | 0.56% | 0.69% | 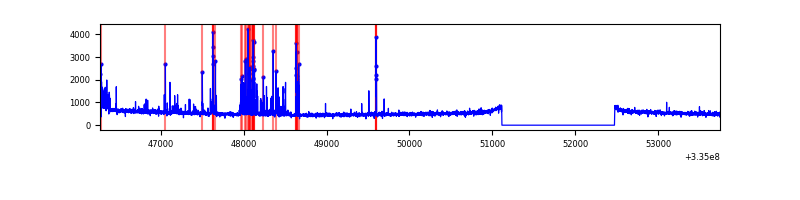 |
| B | 7476 | 6117 | 1 | 1 | 0.01% | 0.02% | 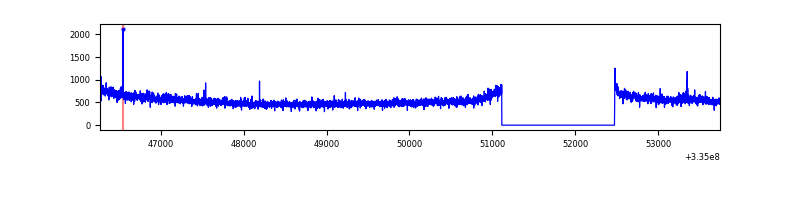 |
| C | 7476 | 6116 | 355 | 355 | 4.75% | 5.80% | 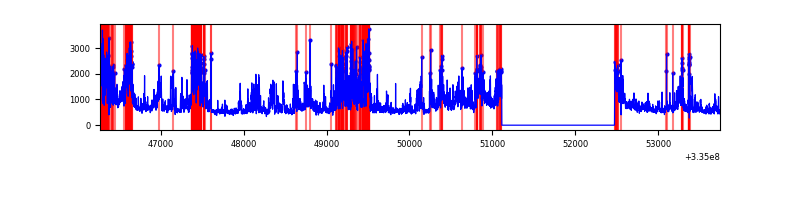 |
| D | 7476 | 6117 | 690 | 690 | 9.23% | 11.28% | 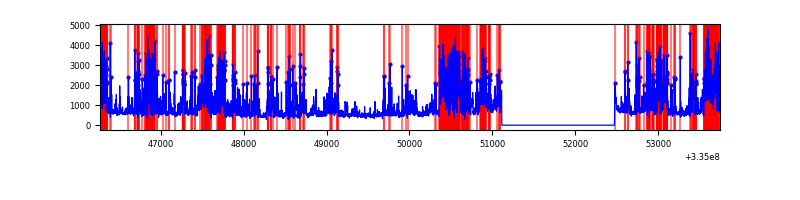 |
Top three noisy pixels from each quadrant. If the there are fewer than three noisy pixels in the level2.evt file, extra rows are filled as -1
| Pixel properties | Quadrant properties | ||||||
|---|---|---|---|---|---|---|---|
| Quadrant | DetID | PixID | Counts | Sigma | Mean | Median | Sigma |
| A | 0 | 13 | 353376 | 2182.35 | 821 | 807 | 161.6 |
| A | 13 | 254 | 9956 | 56.63 | 821 | 807 | 161.6 |
| A | 0 | 226 | 7110 | 39.01 | 821 | 807 | 161.6 |
| B | 0 | 230 | 38473 | 248.21 | 829 | 811 | 151.7 |
| B | 12 | 111 | 17507 | 110.03 | 829 | 811 | 151.7 |
| B | 11 | 111 | 15648 | 97.78 | 829 | 811 | 151.7 |
| C | 3 | 233 | 2646322 | 15151.5 | 761 | 768 | 174.6 |
| C | 14 | 238 | 123837 | 704.84 | 761 | 768 | 174.6 |
| C | 2 | 16 | 26440 | 147.03 | 761 | 768 | 174.6 |
| D | 7 | 80 | 3129481 | 17705.46 | 752 | 737 | 176.7 |
| D | 1 | 52 | 241917 | 1364.83 | 752 | 737 | 176.7 |
| D | 11 | 176 | 86693 | 486.42 | 752 | 737 | 176.7 |
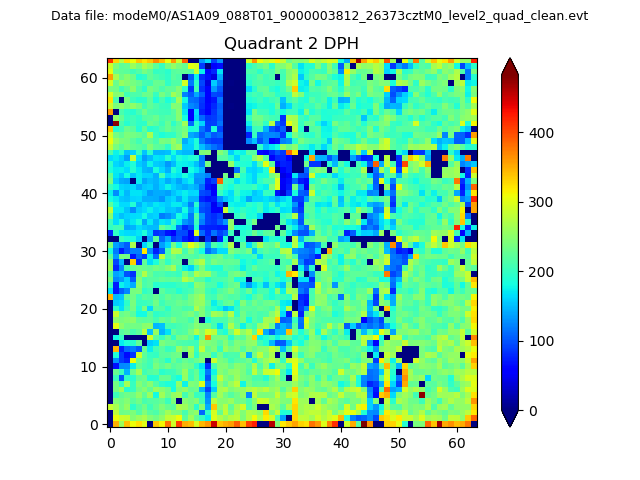
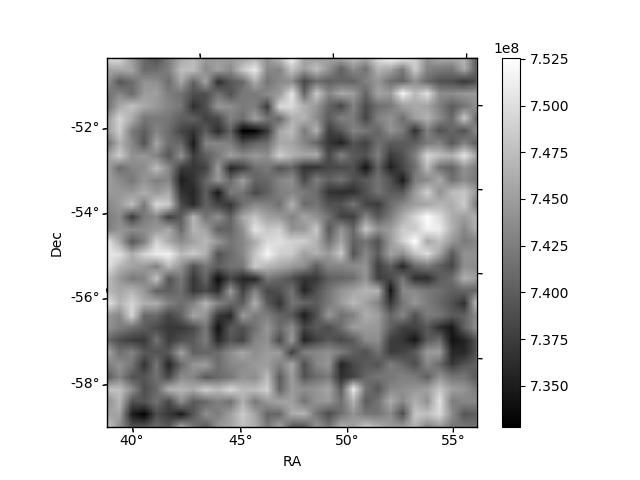
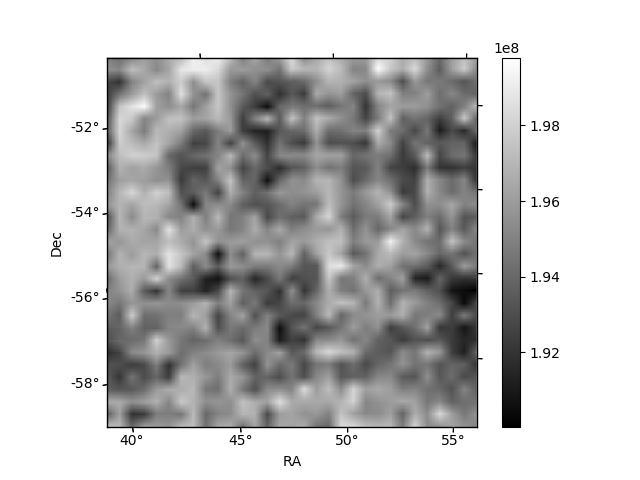
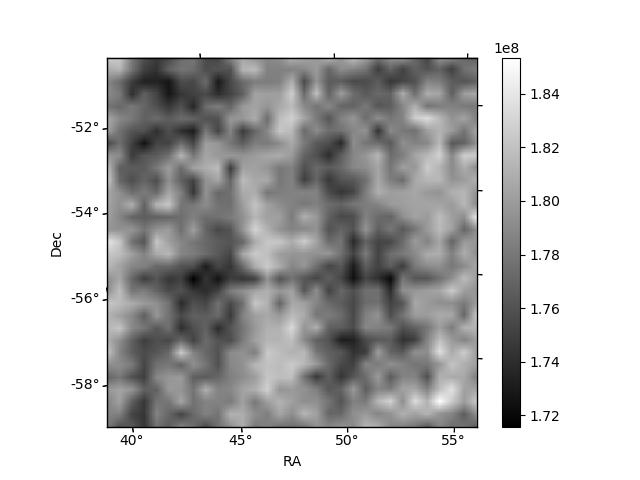
Histogram calculated using DETX and DETY for each event in the final _common_clean file
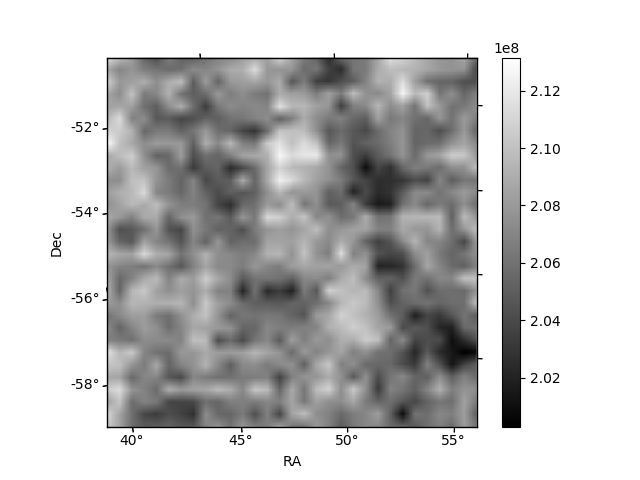
| Quadrant A | 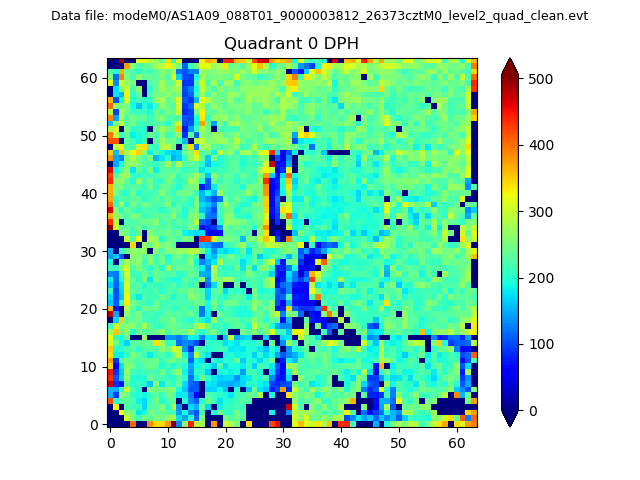 |
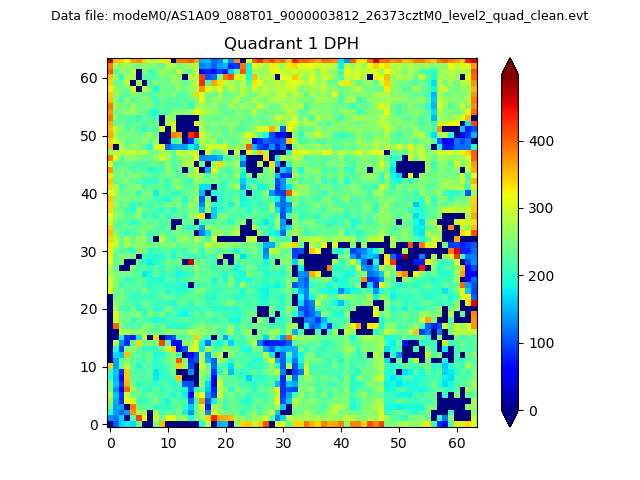 |
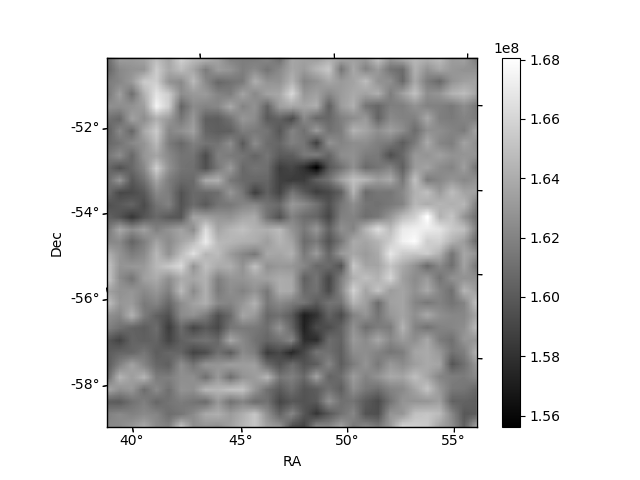
Quadrant B |
|---|---|---|---|
| Quadrant D | 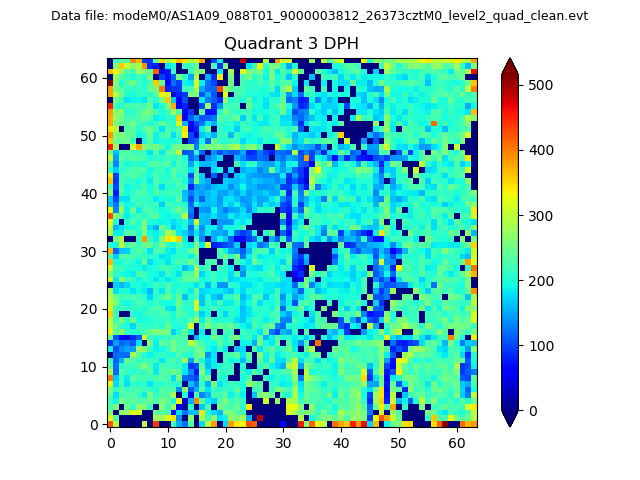 |
 |
Quadrant C |
| Plot type | Count rate plots | Images |
|---|---|---|
| Comparison with Poisson distribution Blue bars denote a histogram of data divided into 1 sec bins. Red curve is a Poisson curve with rate = median count rate of data. |
 |
 |
| Quadrant-wise count rates Data is divided into 100 sec bins |
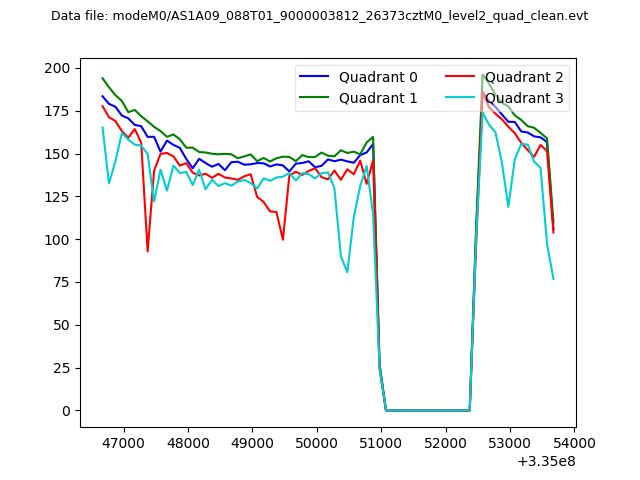 |
|
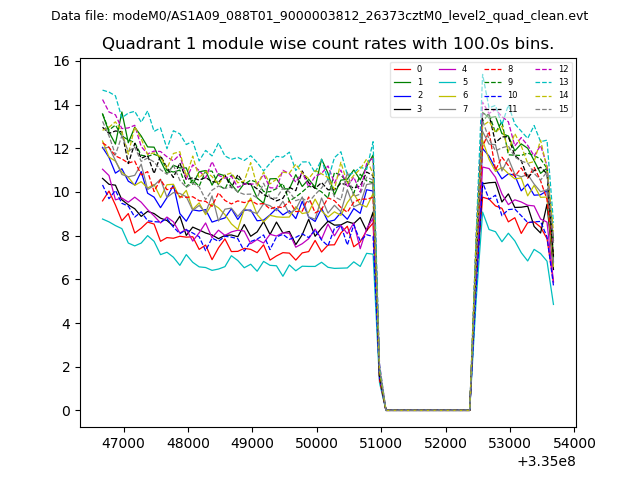
| Module-wise count rates for Quadrant A Data is divided into 100 sec bins |
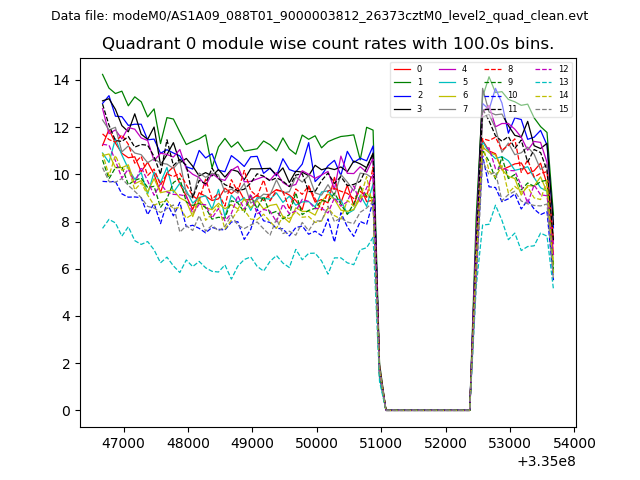 |
 |
| Module-wise count rates for Quadrant B Data is divided into 100 sec bins |
 |
 |
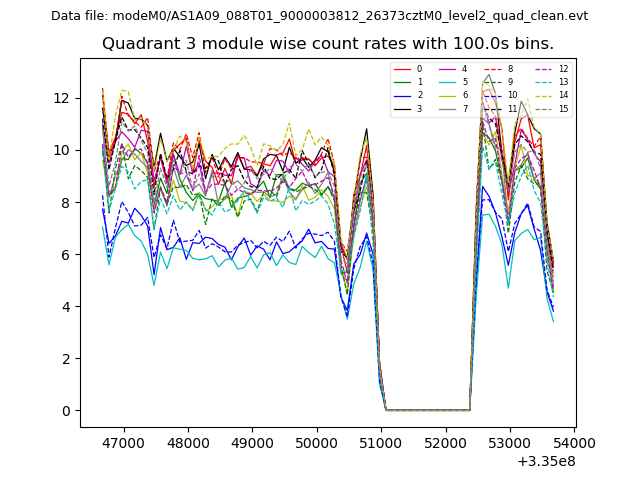
| Module-wise count rates for Quadrant C Data is divided into 100 sec bins |
 |
 |
| Module-wise count rates for Quadrant D Data is divided into 100 sec bins |
 |
 |
| Parameter | Plot |
|---|---|
| CZT HV Monitor | 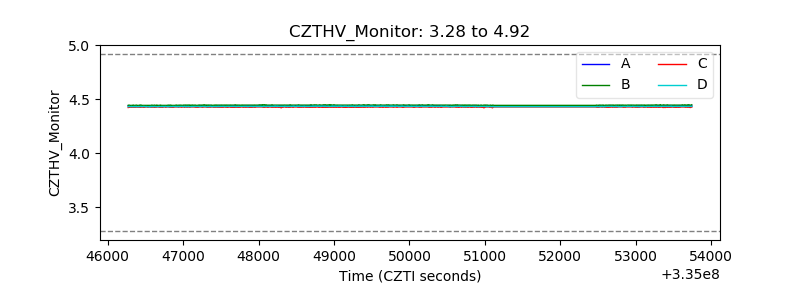 |
| D_VDD | 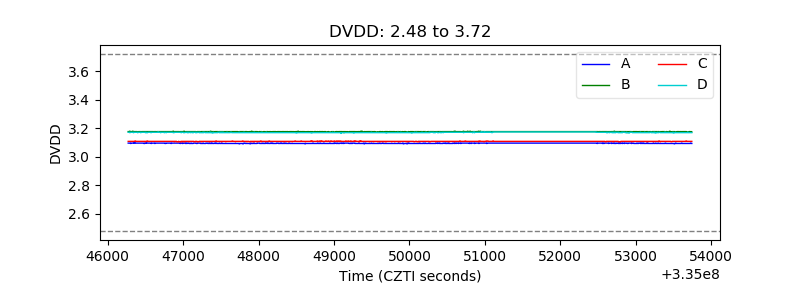 |
| Temperature 1 | 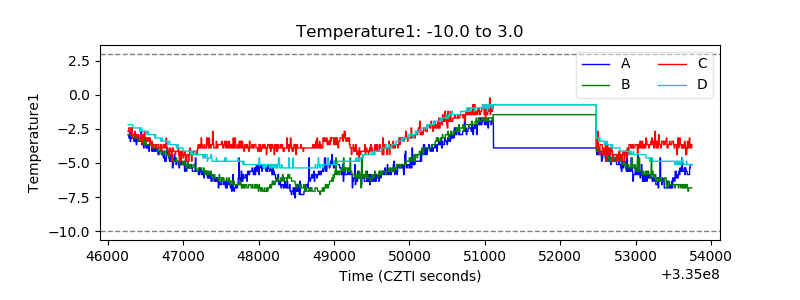 |
| Veto HV Monitor | 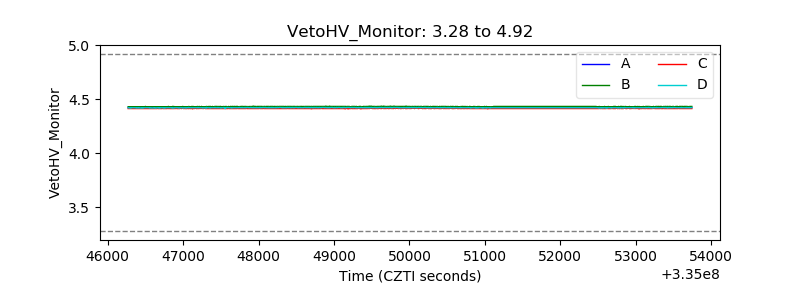 |
| Veto LLD | 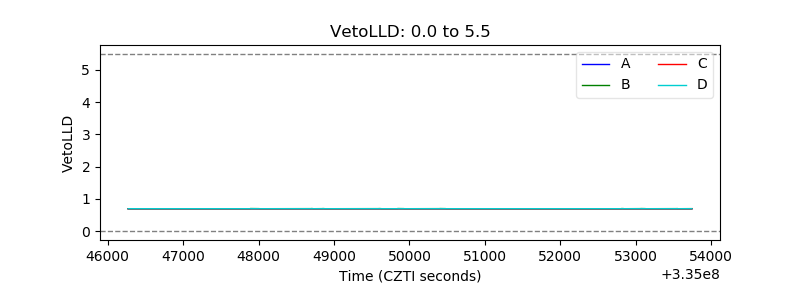 |
| Alpha Counter |  |
| _CPM_Rate | 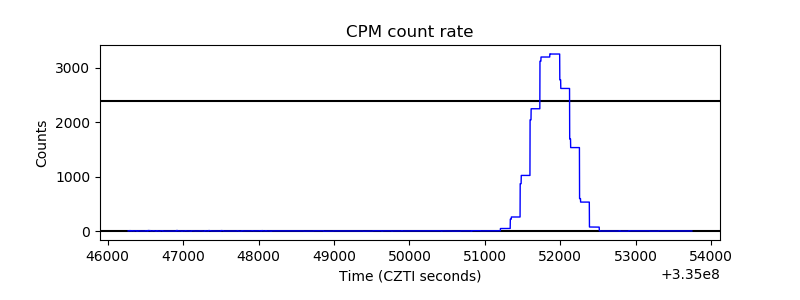 |
| CZT Counter | 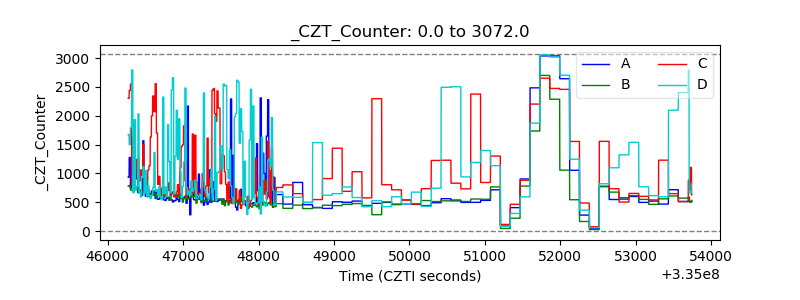 |
| +2.5 Volts monitor |  |
| +5 Volts monitor |  |
| _ROLL_ROT | 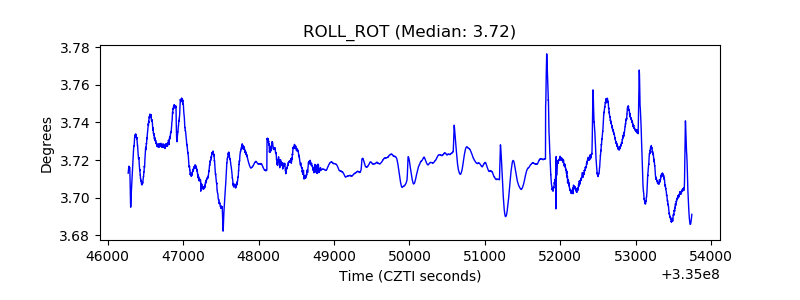 |
| _Roll_DEC | 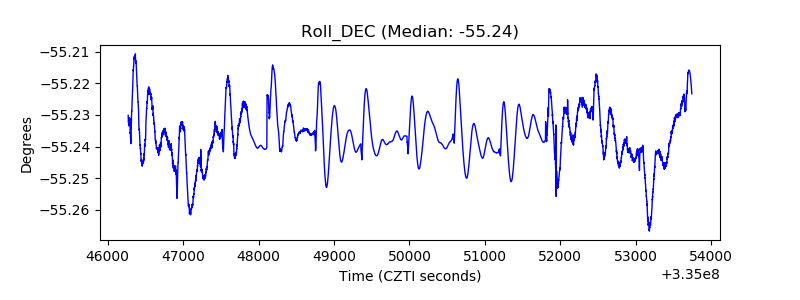 |
| _Roll_RA | 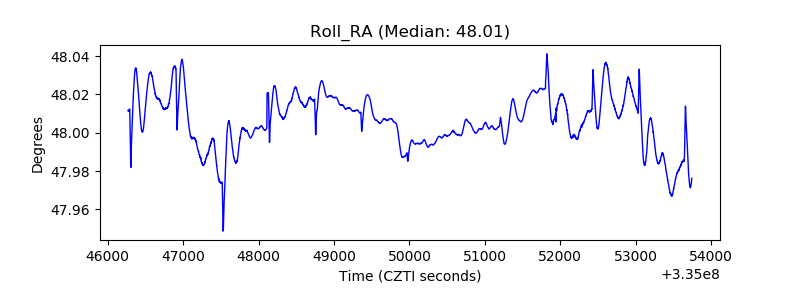 |
| Veto Counter | 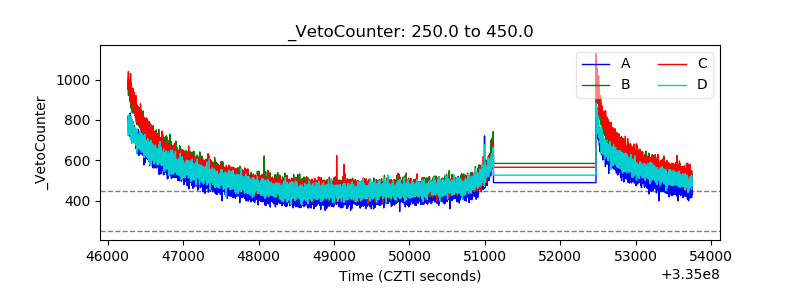 |