| Param | Original file | Final file |
|---|---|---|
| Filename | modeM0/AS1A09_088T01_9000003812_26375cztM0_level2.evt | modeM0/AS1A09_088T01_9000003812_26375cztM0_level2_quad_clean.evt |
| Size (bytes) | 808,459,200 | 106,488,000 |
| Size | 771.0 MB | 101.6 MB |
| Events in quadrant A | 3,484,919 | 734,487 |
| Events in quadrant B | 3,180,976 | 761,785 |
| Events in quadrant C | 8,700,207 | 641,587 |
| Events in quadrant D | 8,681,328 | 634,470 |
| Mode M9 | |||
|---|---|---|---|
| Quadrant | BADHDUFLAG | Total packets | Discarded packets |
| A | 0 | 21 | 0 |
| B | 0 | 22 | 0 |
| C | 0 | 22 | 0 |
| D | 0 | 22 | 0 |
| Mode M0 | |||
|---|---|---|---|
| Quadrant | BADHDUFLAG | Total packets | Discarded packets |
| A | 0 | 14581 | 0 |
| B | 0 | 13445 | 0 |
| C | 0 | 30444 | 0 |
| D | 0 | 30287 | 0 |
| Quadrant | Total seconds | Saturated seconds | Saturation percentage |
|---|---|---|---|
| A | 6474 | 111 | 1.714551% |
| B | 6474 | 28 | 0.432499% |
| C | 6473 | 1996 | 30.835779% |
| D | 6473 | 1927 | 29.769813% |
Noise dominated data is calculated using 1-second bins in cleaned event files. If a bin has >2000 counts, and if more than 50% of those come from <1% of pixels, then it is considered to be noise-dominated and hence unusable.
| Quadrant | # 1 sec bins | Bins with >0 counts | Bins with >2000 counts | High rate bins dominated by noise | Noise dominated (total time) | Noise dominated (detector-on time) | Marked lightcurve |
|---|---|---|---|---|---|---|---|
| A | 7574 | 6476 | 39 | 39 | 0.51% | 0.60% | 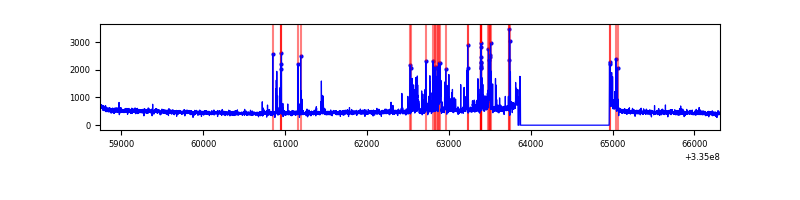 |
| B | 7574 | 6476 | 0 | 0 | 0.00% | 0.00% | 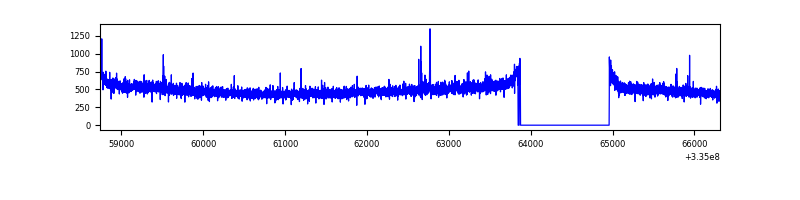 |
| C | 7573 | 6474 | 1160 | 1160 | 15.32% | 17.92% | 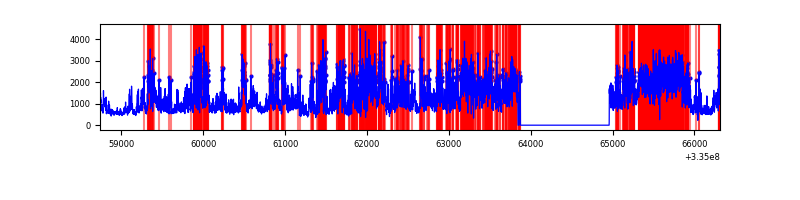 |
| D | 7573 | 6473 | 1527 | 1527 | 20.16% | 23.59% | 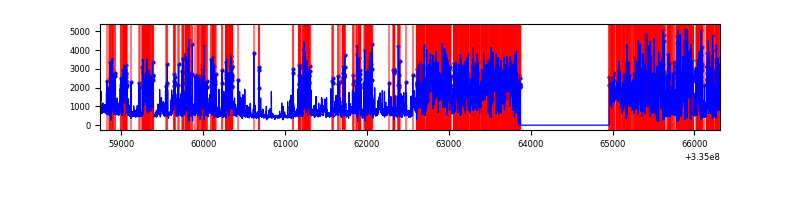 |
Top three noisy pixels from each quadrant. If the there are fewer than three noisy pixels in the level2.evt file, extra rows are filled as -1
| Pixel properties | Quadrant properties | ||||||
|---|---|---|---|---|---|---|---|
| Quadrant | DetID | PixID | Counts | Sigma | Mean | Median | Sigma |
| A | 0 | 13 | 410688 | 2604.14 | 797 | 783 | 157.4 |
| A | 13 | 254 | 10715 | 63.1 | 797 | 783 | 157.4 |
| A | 3 | 137 | 7088 | 40.06 | 797 | 783 | 157.4 |
| B | 12 | 111 | 17958 | 113.79 | 807 | 786 | 150.9 |
| B | 11 | 111 | 16000 | 100.82 | 807 | 786 | 150.9 |
| B | 14 | 111 | 14564 | 91.3 | 807 | 786 | 150.9 |
| C | 3 | 233 | 5836818 | 35952.75 | 703 | 707 | 162.3 |
| C | 14 | 238 | 112305 | 687.48 | 703 | 707 | 162.3 |
| C | 2 | 16 | 8958 | 50.83 | 703 | 707 | 162.3 |
| D | 7 | 80 | 3270150 | 20395.33 | 678 | 663 | 160.3 |
| D | 1 | 52 | 2655237 | 16559.46 | 678 | 663 | 160.3 |
| D | 11 | 176 | 78034 | 482.65 | 678 | 663 | 160.3 |
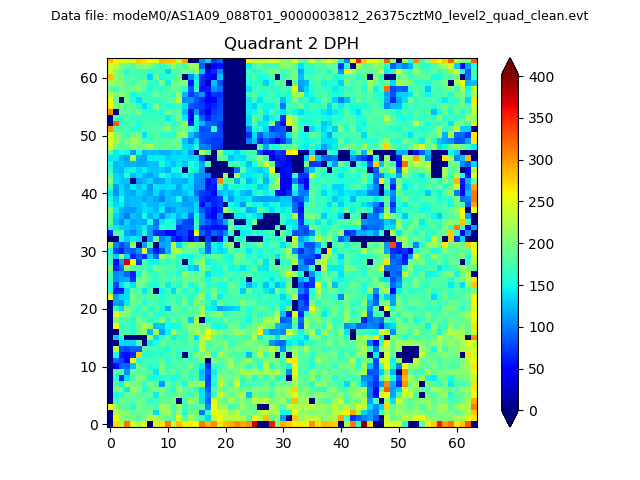
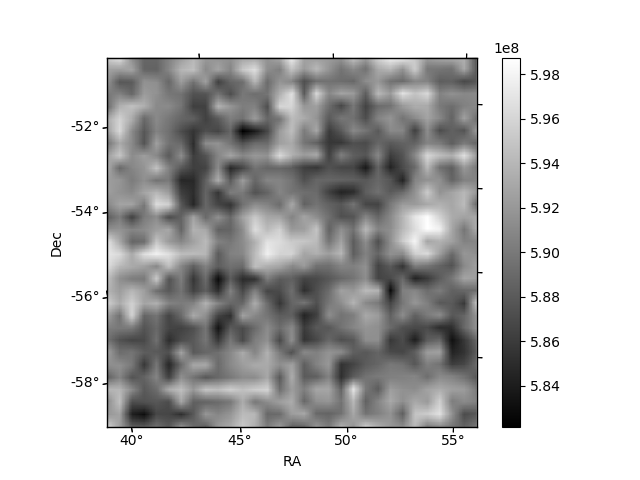
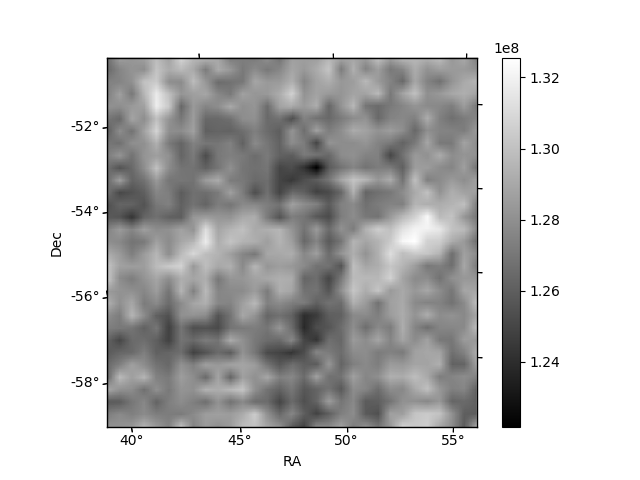
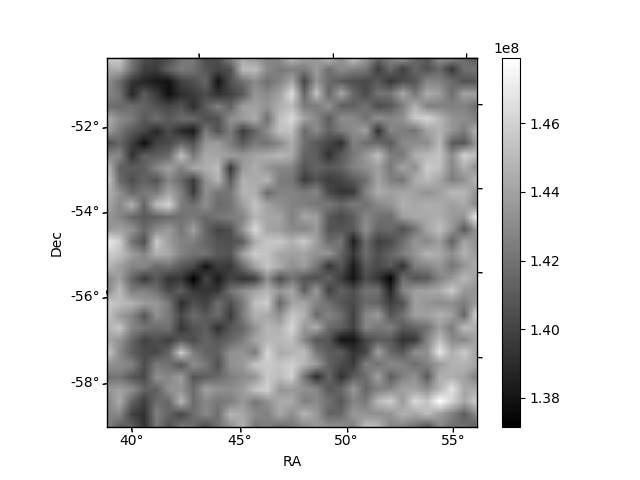
Histogram calculated using DETX and DETY for each event in the final _common_clean file
| Quadrant A | 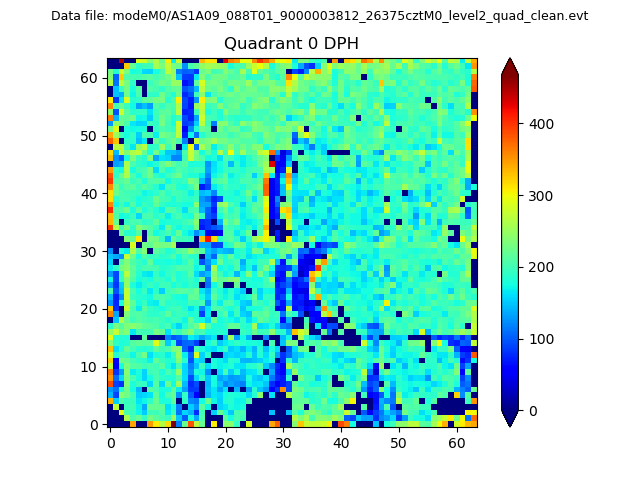 |
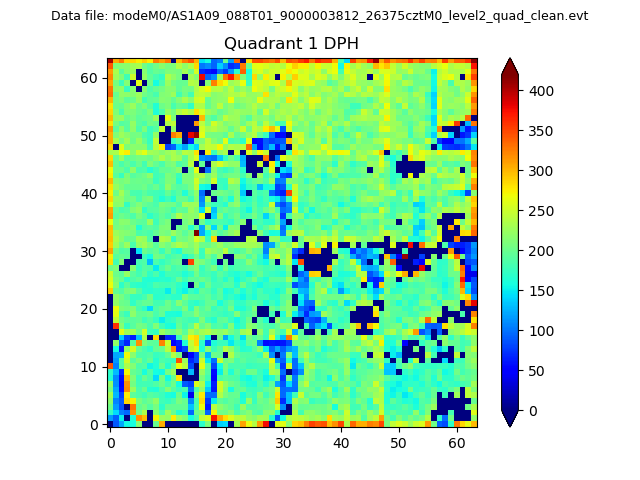 |
Quadrant B |
|---|---|---|---|
| Quadrant D | 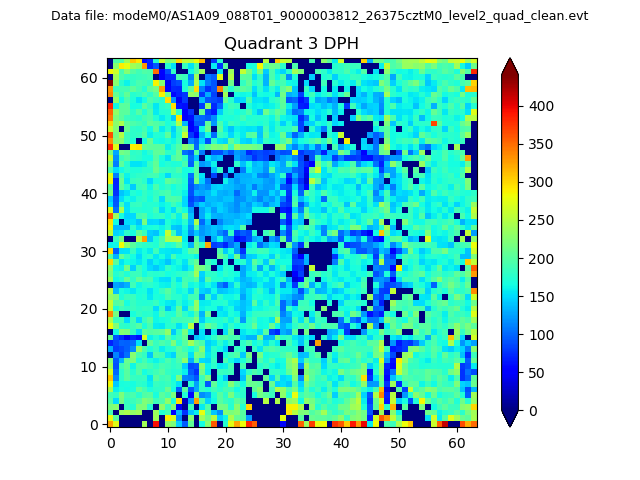 |
 |
Quadrant C |
| Plot type | Count rate plots | Images |
|---|---|---|
| Comparison with Poisson distribution Blue bars denote a histogram of data divided into 1 sec bins. Red curve is a Poisson curve with rate = median count rate of data. |
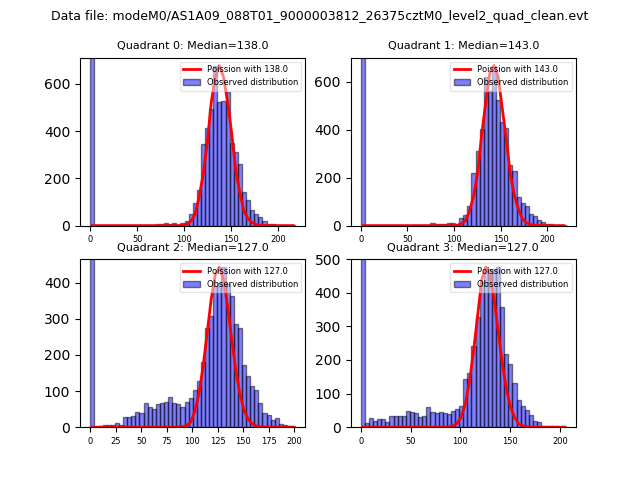 |
 |
| Quadrant-wise count rates Data is divided into 100 sec bins |
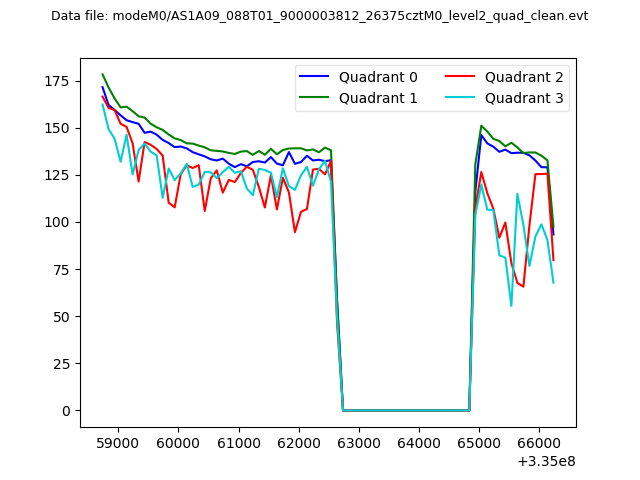 |
|
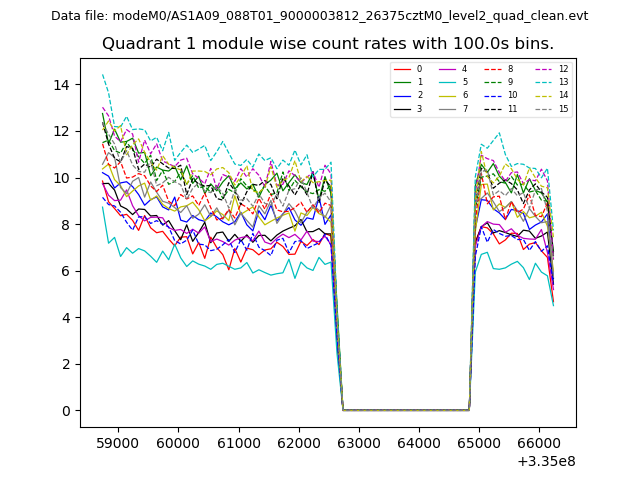
| Module-wise count rates for Quadrant A Data is divided into 100 sec bins |
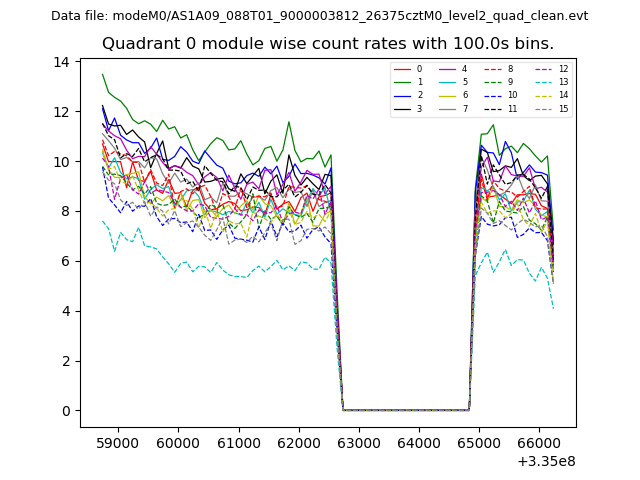 |
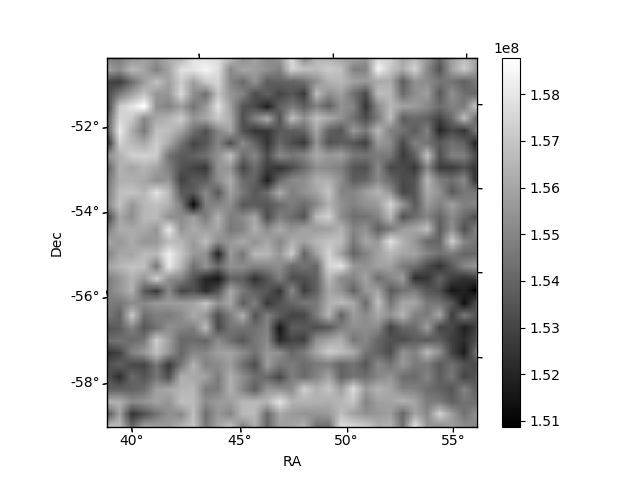 |
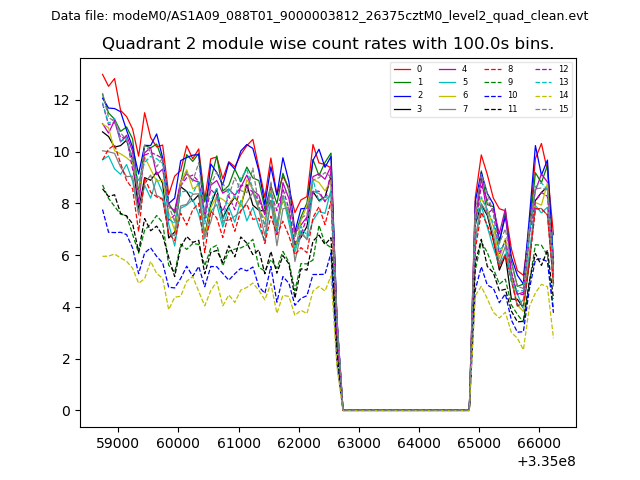
| Module-wise count rates for Quadrant B Data is divided into 100 sec bins |
 |
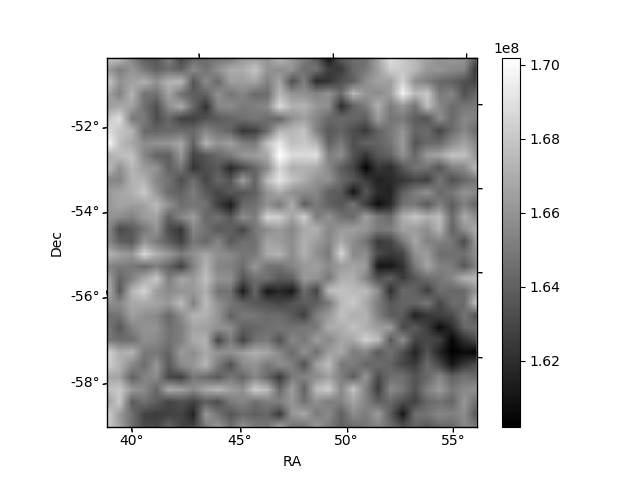 |
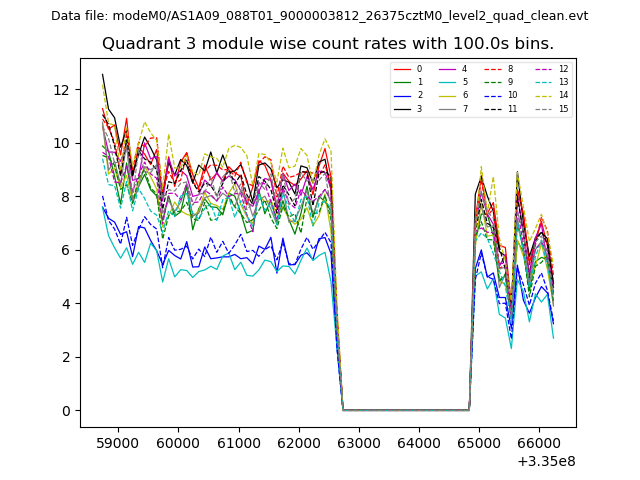
| Module-wise count rates for Quadrant C Data is divided into 100 sec bins |
 |
 |
| Module-wise count rates for Quadrant D Data is divided into 100 sec bins |
 |
 |
| Parameter | Plot |
|---|---|
| CZT HV Monitor | 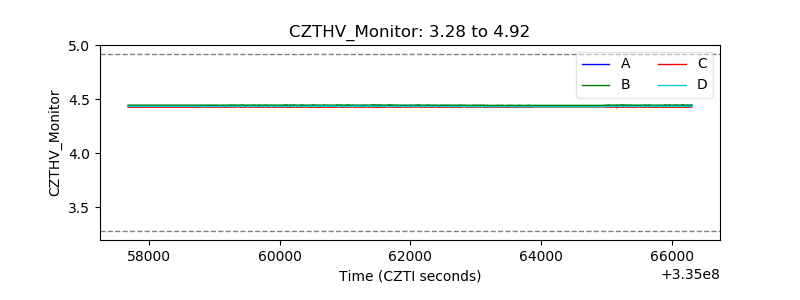 |
| D_VDD | 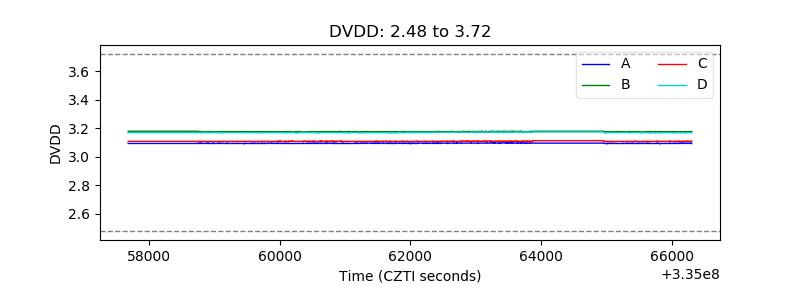 |
| Temperature 1 | 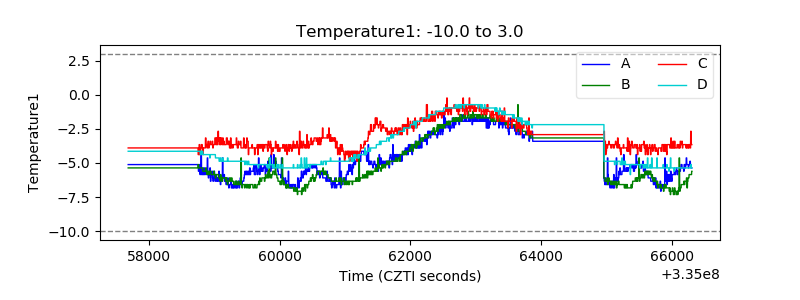 |
| Veto HV Monitor | 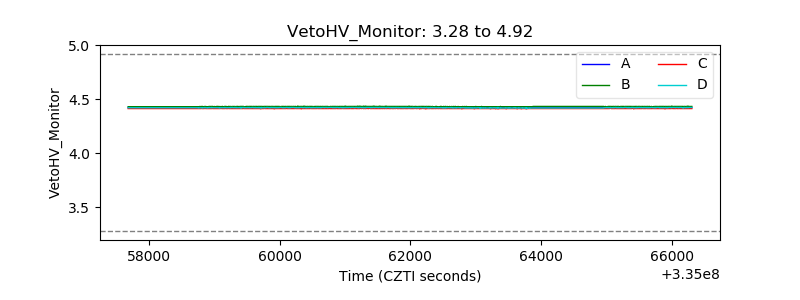 |
| Veto LLD | 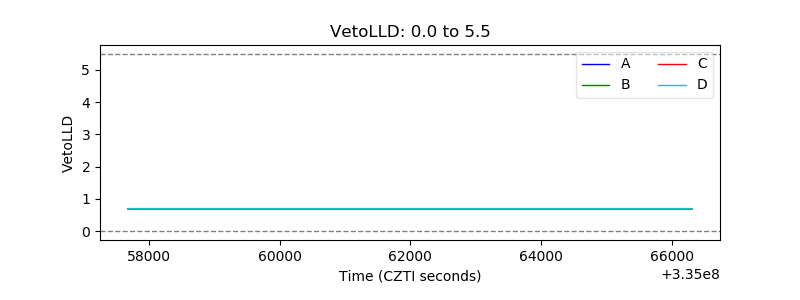 |
| Alpha Counter | 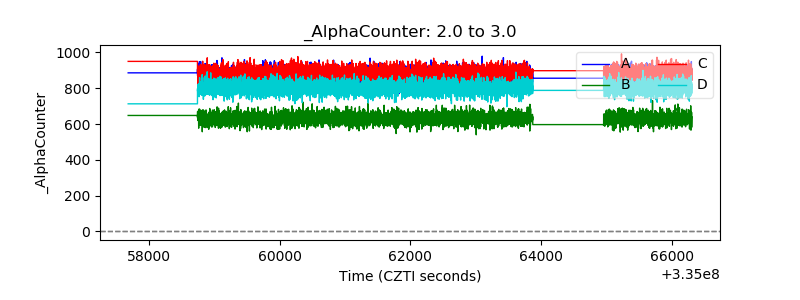 |
| _CPM_Rate | 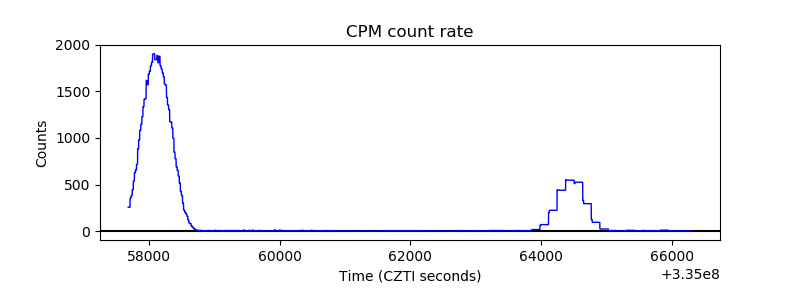 |
| CZT Counter | 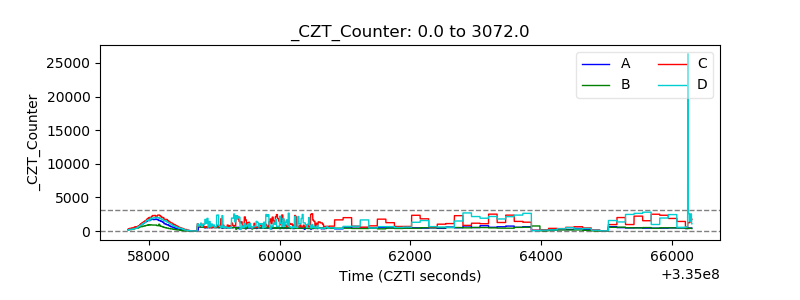 |
| +2.5 Volts monitor |  |
| +5 Volts monitor |  |
| _ROLL_ROT | 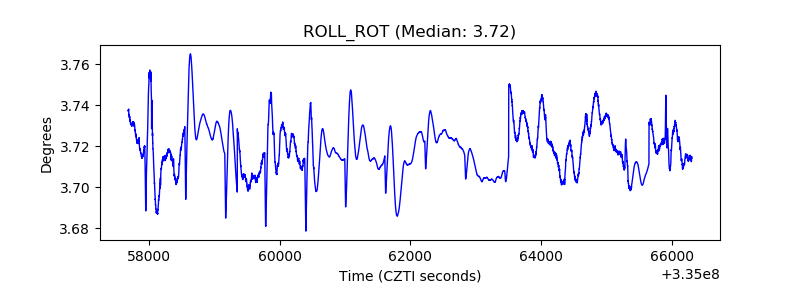 |
| _Roll_DEC | 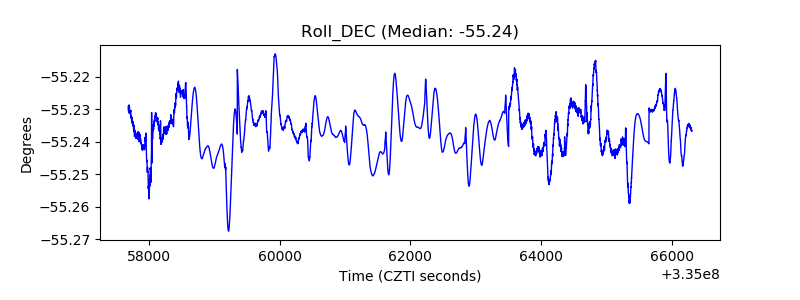 |
| _Roll_RA | 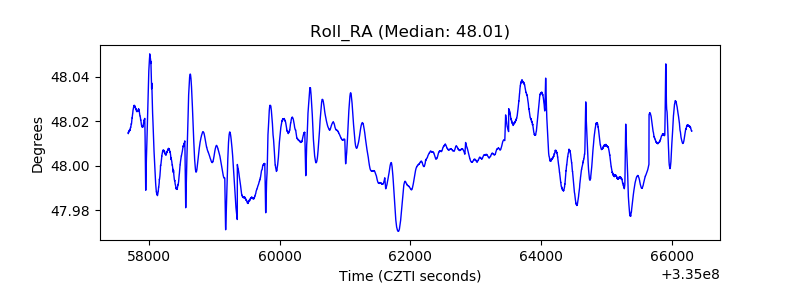 |
| Veto Counter | 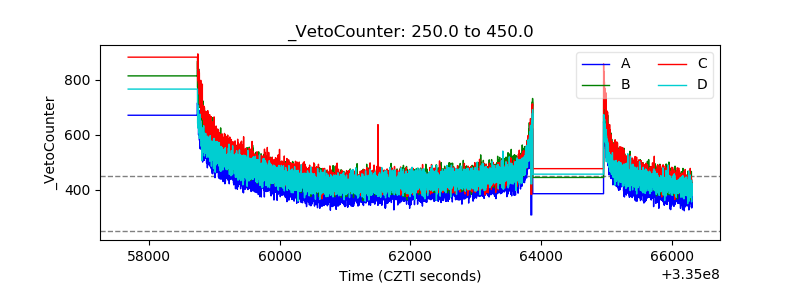 |