| Param | Original file | Final file |
|---|---|---|
| Filename | modeM0/AS1A09_088T01_9000003812_26376cztM0_level2.evt | modeM0/AS1A09_088T01_9000003812_26376cztM0_level2_quad_clean.evt |
| Size (bytes) | 961,369,920 | 98,372,160 |
| Size | 916.8 MB | 93.8 MB |
| Events in quadrant A | 3,486,126 | 700,522 |
| Events in quadrant B | 3,284,688 | 727,919 |
| Events in quadrant C | 10,953,326 | 542,271 |
| Events in quadrant D | 10,924,507 | 524,137 |
| Mode M9 | |||
|---|---|---|---|
| Quadrant | BADHDUFLAG | Total packets | Discarded packets |
| A | 0 | 19 | 0 |
| B | 0 | 19 | 0 |
| C | 0 | 19 | 0 |
| D | 0 | 19 | 0 |
| Mode M0 | |||
|---|---|---|---|
| Quadrant | BADHDUFLAG | Total packets | Discarded packets |
| A | 0 | 14922 | 0 |
| B | 0 | 14183 | 0 |
| C | 0 | 37431 | 0 |
| D | 0 | 37203 | 0 |
| Quadrant | Total seconds | Saturated seconds | Saturation percentage |
|---|---|---|---|
| A | 6924 | 96 | 1.386482% |
| B | 6924 | 32 | 0.462161% |
| C | 6923 | 3198 | 46.193847% |
| D | 6923 | 2889 | 41.730464% |
Noise dominated data is calculated using 1-second bins in cleaned event files. If a bin has >2000 counts, and if more than 50% of those come from <1% of pixels, then it is considered to be noise-dominated and hence unusable.
| Quadrant | # 1 sec bins | Bins with >0 counts | Bins with >2000 counts | High rate bins dominated by noise | Noise dominated (total time) | Noise dominated (detector-on time) | Marked lightcurve |
|---|---|---|---|---|---|---|---|
| A | 8769 | 6926 | 41 | 41 | 0.47% | 0.59% | 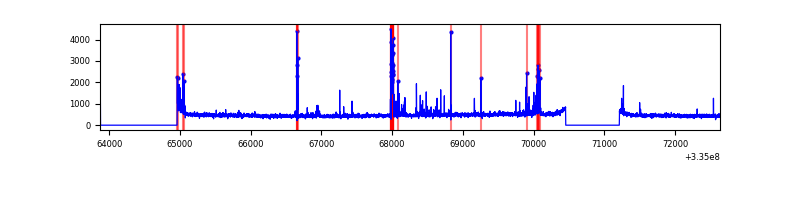 |
| B | 8769 | 6926 | 0 | 0 | 0.00% | 0.00% | 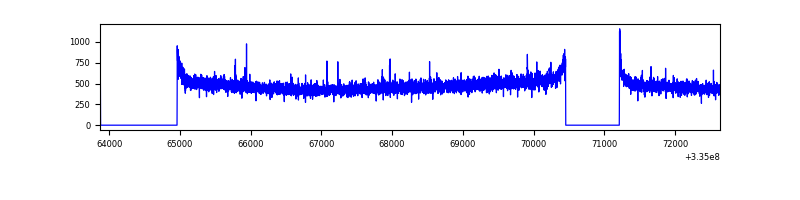 |
| C | 8768 | 6924 | 1967 | 1967 | 22.43% | 28.41% | 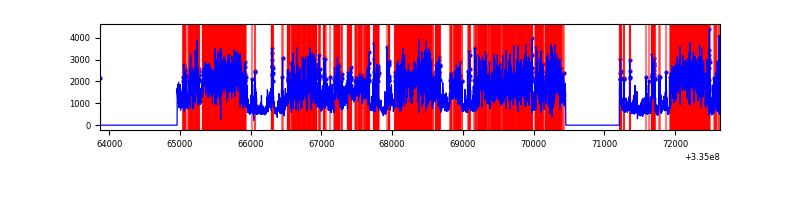 |
| D | 8768 | 6924 | 2294 | 2294 | 26.16% | 33.13% | 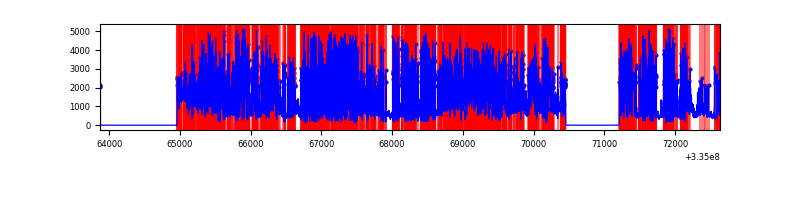 |
Top three noisy pixels from each quadrant. If the there are fewer than three noisy pixels in the level2.evt file, extra rows are filled as -1
| Pixel properties | Quadrant properties | ||||||
|---|---|---|---|---|---|---|---|
| Quadrant | DetID | PixID | Counts | Sigma | Mean | Median | Sigma |
| A | 0 | 13 | 291263 | 1754.17 | 826 | 808 | 165.6 |
| A | 13 | 254 | 11615 | 65.27 | 826 | 808 | 165.6 |
| A | 3 | 137 | 7624 | 41.16 | 826 | 808 | 165.6 |
| B | 0 | 230 | 21560 | 132.13 | 833 | 813 | 157.0 |
| B | 12 | 111 | 19138 | 116.71 | 833 | 813 | 157.0 |
| B | 11 | 111 | 16877 | 102.31 | 833 | 813 | 157.0 |
| C | 3 | 233 | 8220177 | 52481.53 | 670 | 674 | 156.6 |
| C | 14 | 238 | 105029 | 666.31 | 670 | 674 | 156.6 |
| C | 2 | 16 | 16504 | 101.07 | 670 | 674 | 156.6 |
| D | 1 | 52 | 4924363 | 32197.18 | 646 | 631 | 152.9 |
| D | 7 | 80 | 3394169 | 22190.96 | 646 | 631 | 152.9 |
| D | 11 | 176 | 64521 | 417.79 | 646 | 631 | 152.9 |
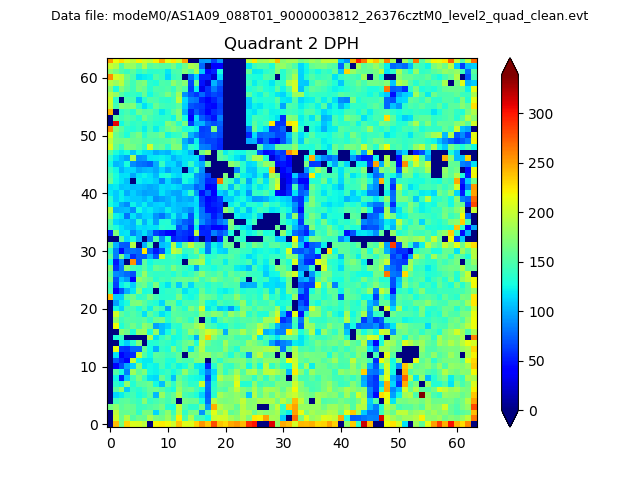
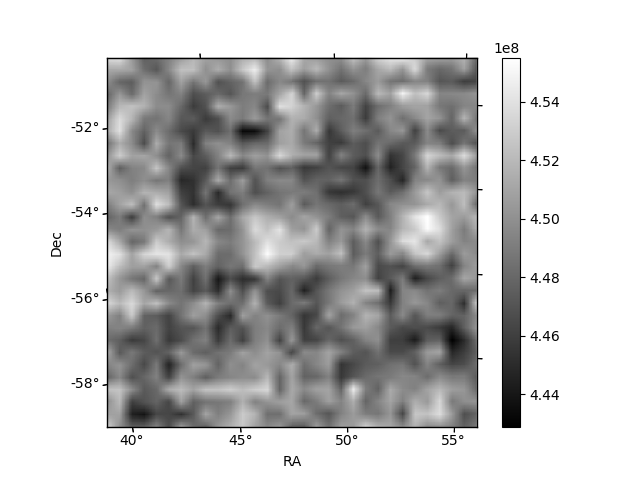
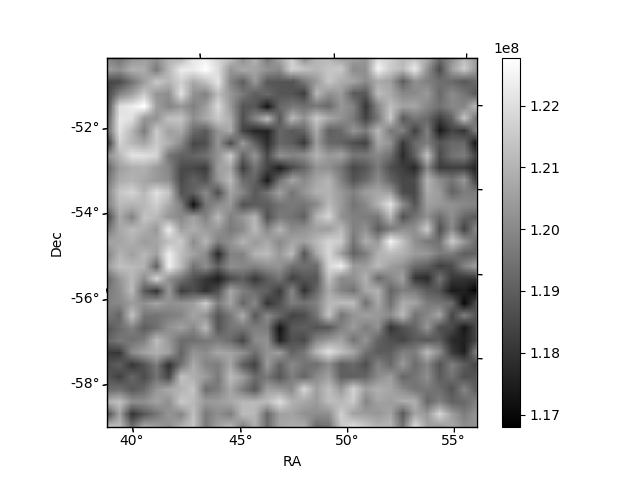
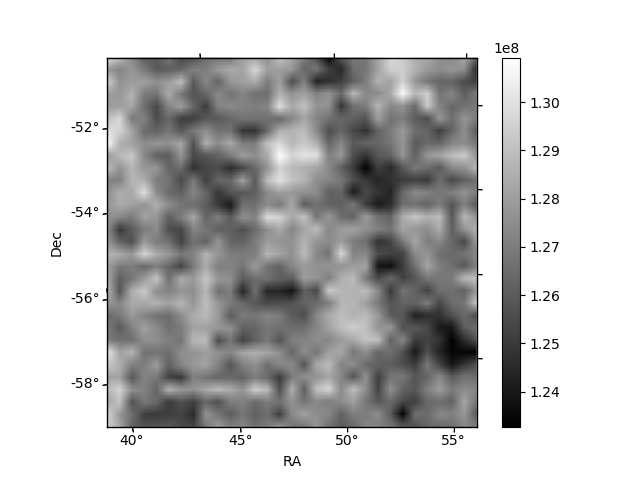
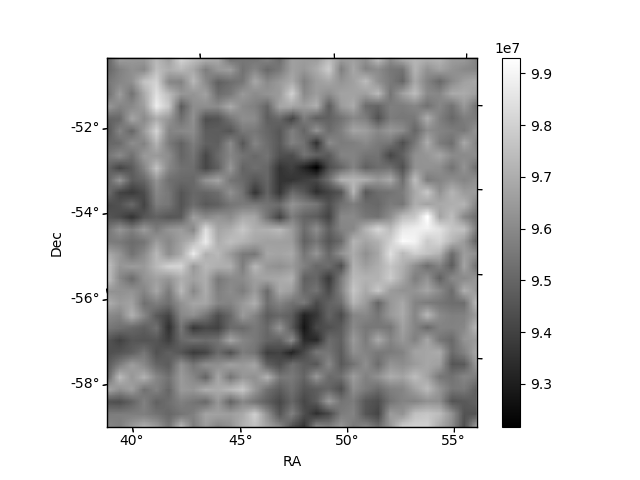
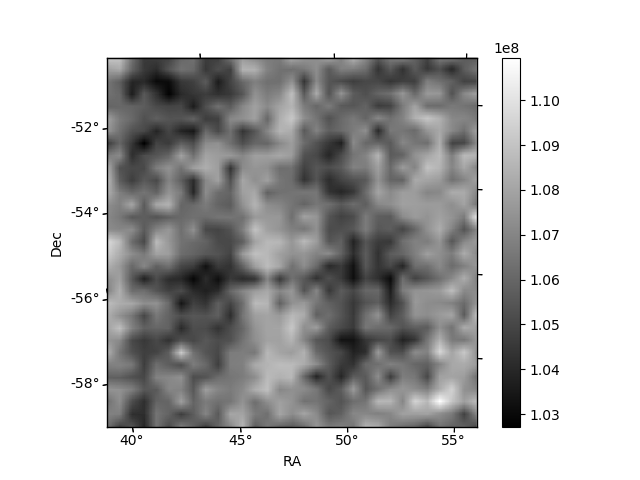
Histogram calculated using DETX and DETY for each event in the final _common_clean file
| Quadrant A | 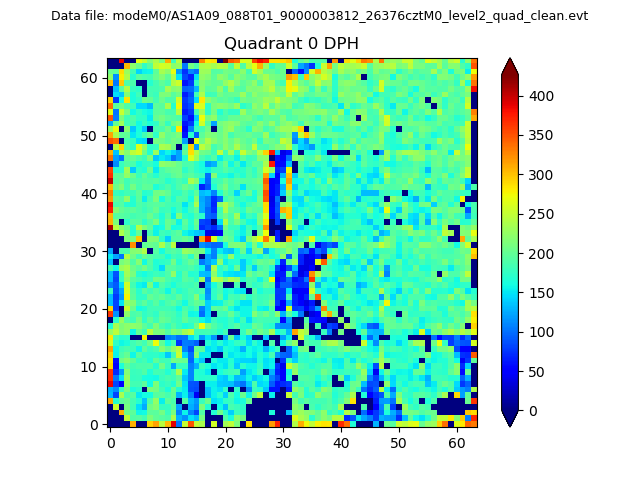 |
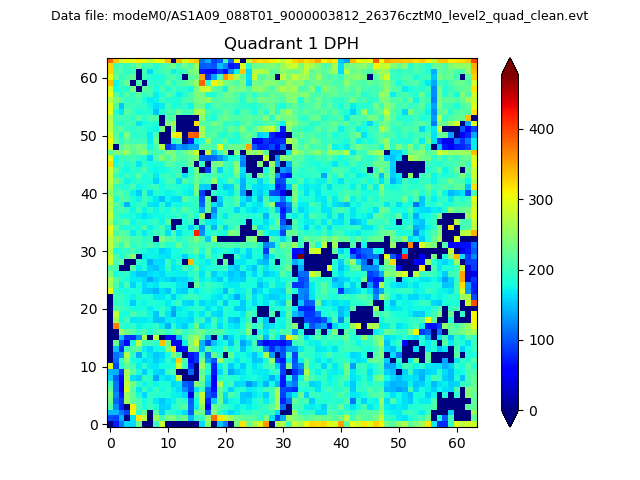 |
Quadrant B |
|---|---|---|---|
| Quadrant D | 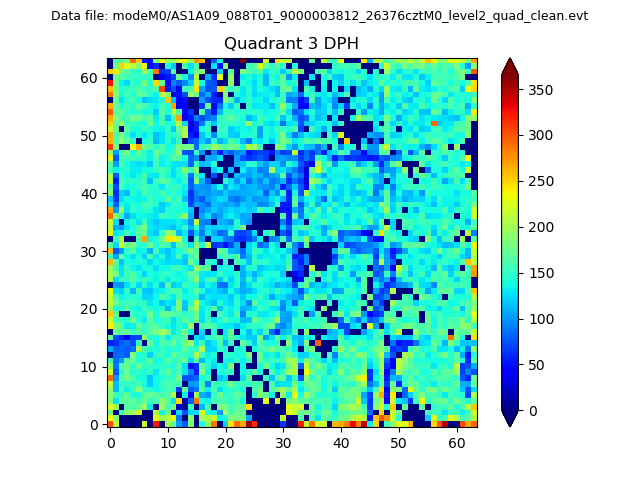 |
 |
Quadrant C |
| Plot type | Count rate plots | Images |
|---|---|---|
| Comparison with Poisson distribution Blue bars denote a histogram of data divided into 1 sec bins. Red curve is a Poisson curve with rate = median count rate of data. |
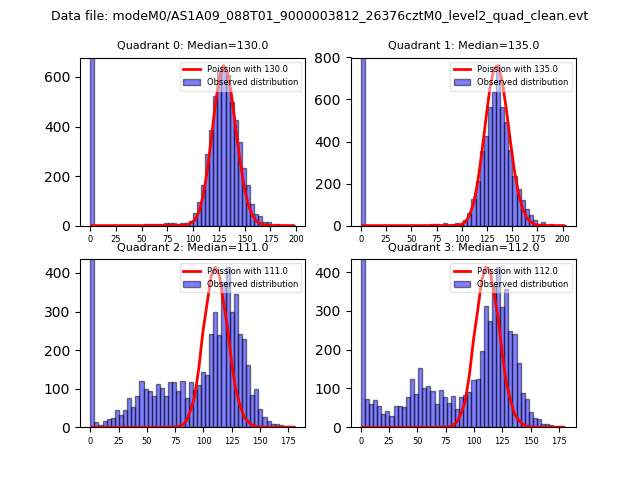 |
 |
| Quadrant-wise count rates Data is divided into 100 sec bins |
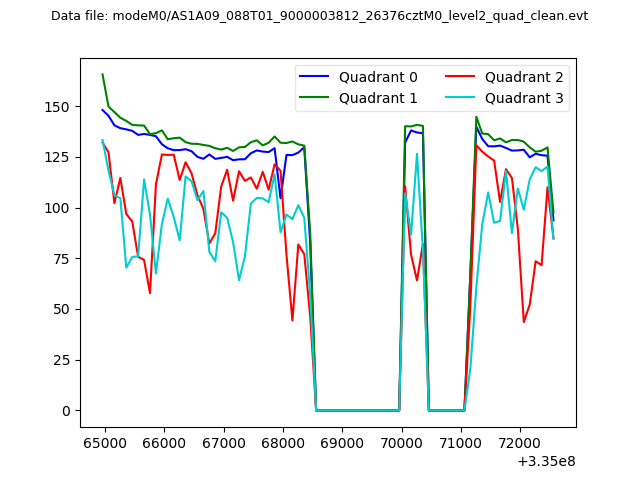 |
|
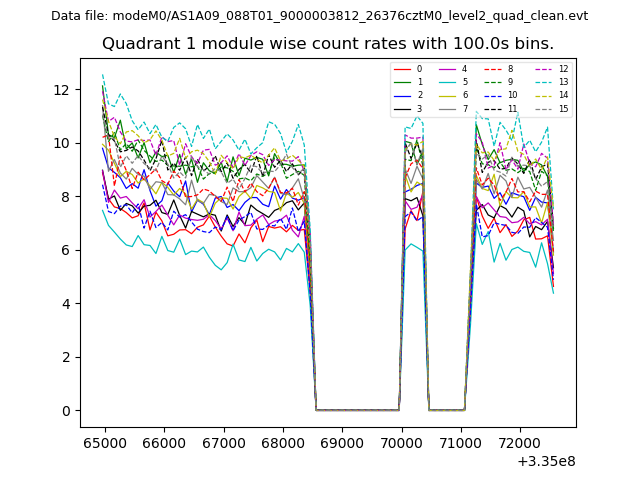
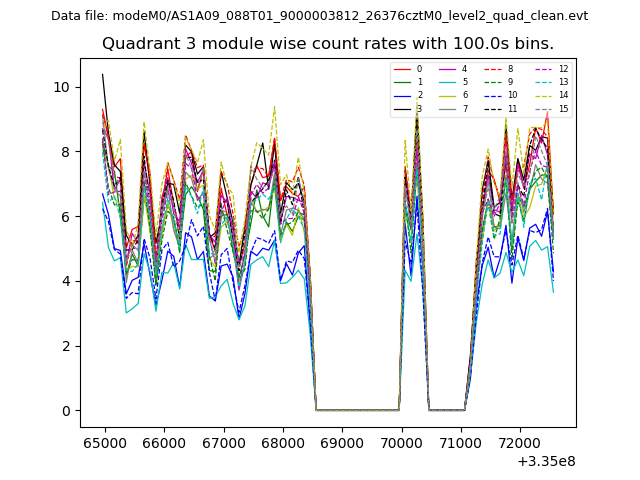
| Module-wise count rates for Quadrant A Data is divided into 100 sec bins |
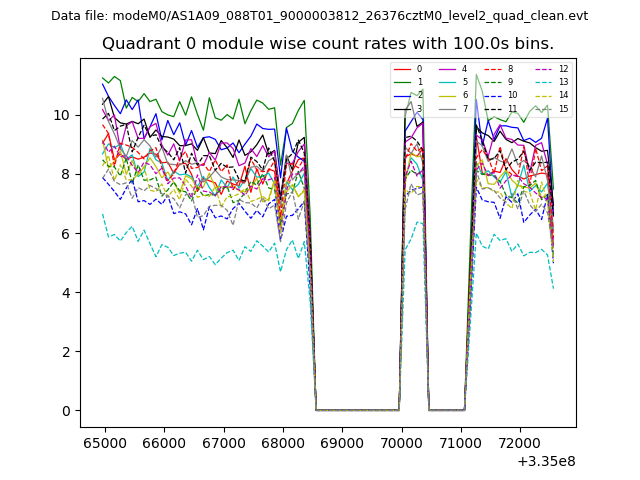 |
 |
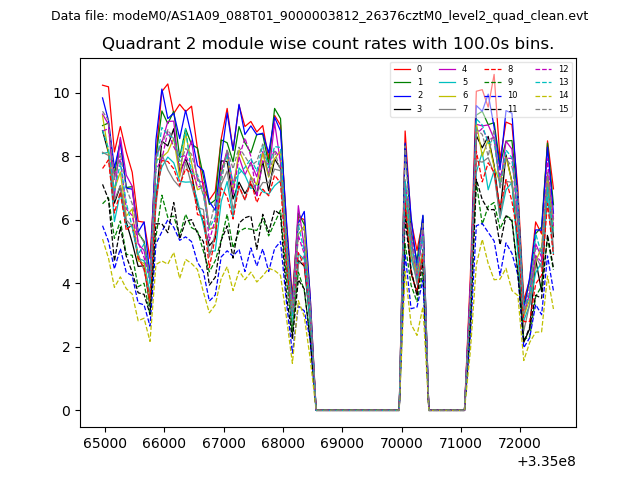
| Module-wise count rates for Quadrant B Data is divided into 100 sec bins |
 |
 |
| Module-wise count rates for Quadrant C Data is divided into 100 sec bins |
 |
 |
| Module-wise count rates for Quadrant D Data is divided into 100 sec bins |
 |
 |
| Parameter | Plot |
|---|---|
| CZT HV Monitor | 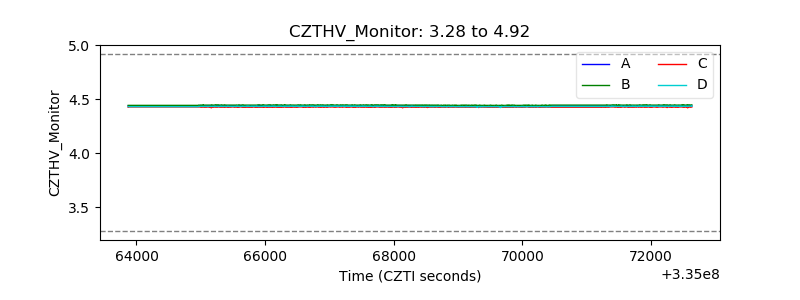 |
| D_VDD | 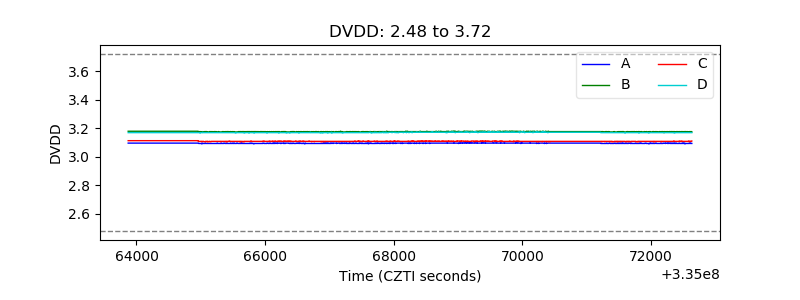 |
| Temperature 1 | 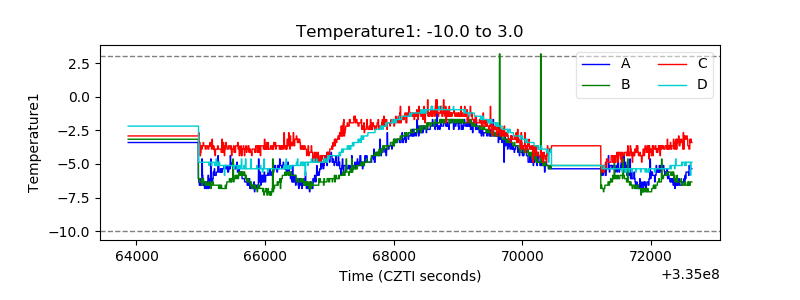 |
| Veto HV Monitor | 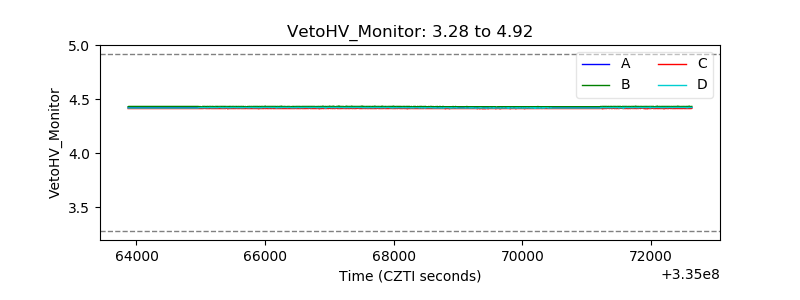 |
| Veto LLD |  |
| Alpha Counter |  |
| _CPM_Rate | 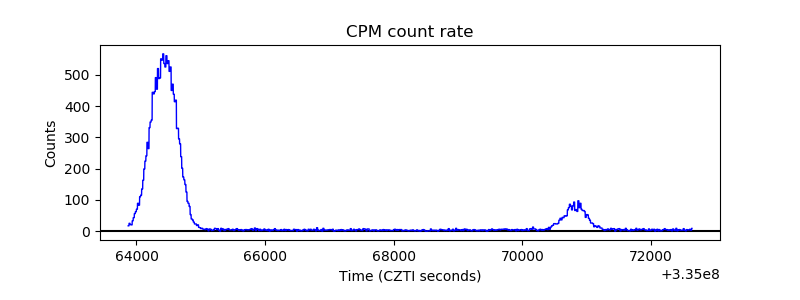 |
| CZT Counter | 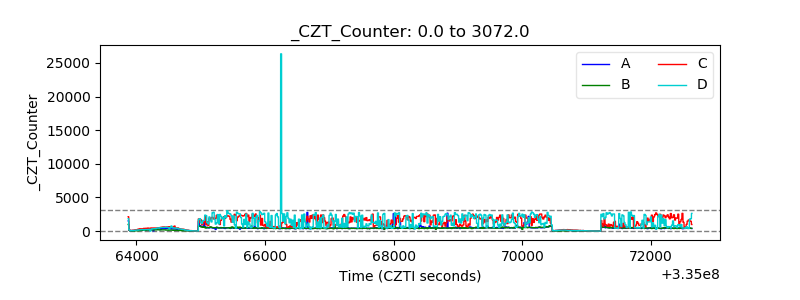 |
| +2.5 Volts monitor |  |
| +5 Volts monitor |  |
| _ROLL_ROT | 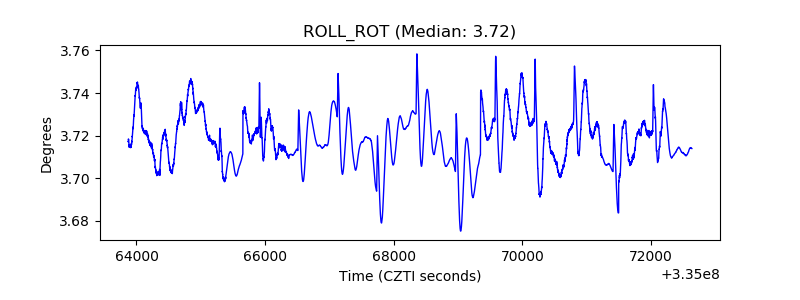 |
| _Roll_DEC | 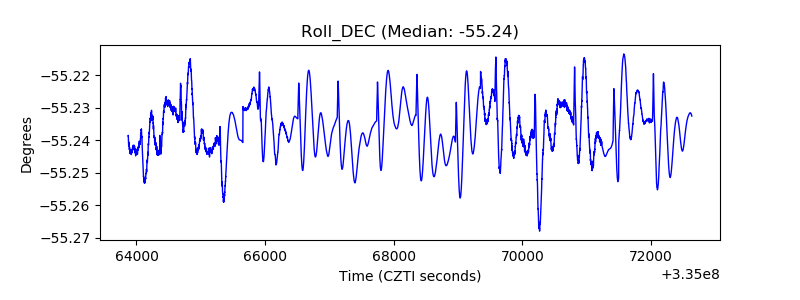 |
| _Roll_RA | 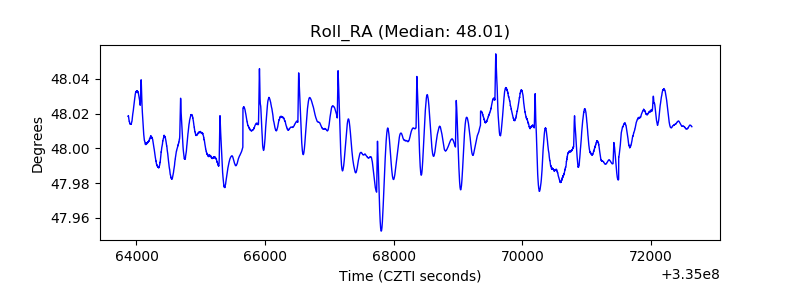 |
| Veto Counter | 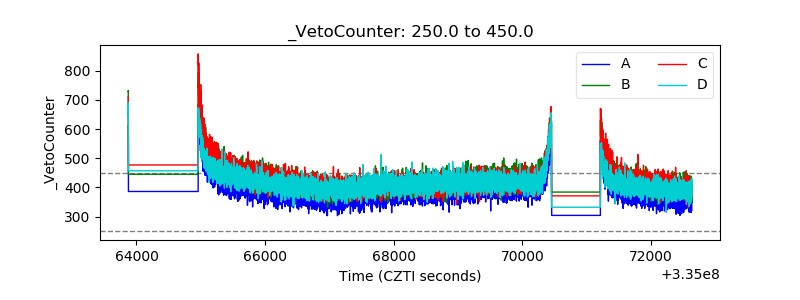 |