| Param | Original file | Final file |
|---|---|---|
| Filename | modeM0/AS1A09_088T01_9000003812_26377cztM0_level2.evt | modeM0/AS1A09_088T01_9000003812_26377cztM0_level2_quad_clean.evt |
| Size (bytes) | 861,819,840 | 101,324,160 |
| Size | 821.9 MB | 96.6 MB |
| Events in quadrant A | 3,232,950 | 693,272 |
| Events in quadrant B | 3,277,442 | 714,463 |
| Events in quadrant C | 9,953,948 | 575,110 |
| Events in quadrant D | 9,163,715 | 596,900 |
| Mode M9 | |||
|---|---|---|---|
| Quadrant | BADHDUFLAG | Total packets | Discarded packets |
| A | 0 | 3 | 0 |
| B | 0 | 3 | 0 |
| C | 0 | 3 | 0 |
| D | 0 | 3 | 0 |
| Mode M0 | |||
|---|---|---|---|
| Quadrant | BADHDUFLAG | Total packets | Discarded packets |
| A | 0 | 14306 | 0 |
| B | 0 | 14331 | 0 |
| C | 0 | 34498 | 0 |
| D | 0 | 32063 | 0 |
| Quadrant | Total seconds | Saturated seconds | Saturation percentage |
|---|---|---|---|
| A | 6999 | 89 | 1.271610% |
| B | 6998 | 95 | 1.357531% |
| C | 6998 | 2675 | 38.225207% |
| D | 6999 | 1742 | 24.889270% |
Noise dominated data is calculated using 1-second bins in cleaned event files. If a bin has >2000 counts, and if more than 50% of those come from <1% of pixels, then it is considered to be noise-dominated and hence unusable.
| Quadrant | # 1 sec bins | Bins with >0 counts | Bins with >2000 counts | High rate bins dominated by noise | Noise dominated (total time) | Noise dominated (detector-on time) | Marked lightcurve |
|---|---|---|---|---|---|---|---|
| A | 7279 | 7001 | 0 | 0 | 0.00% | 0.00% | 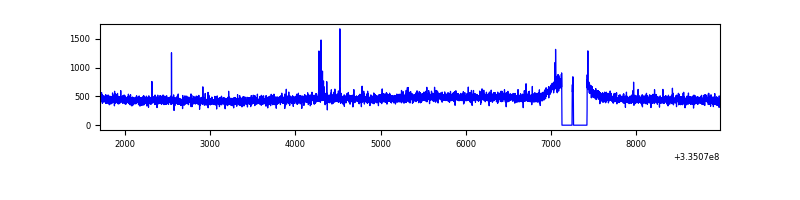 |
| B | 7278 | 7000 | 0 | 0 | 0.00% | 0.00% | 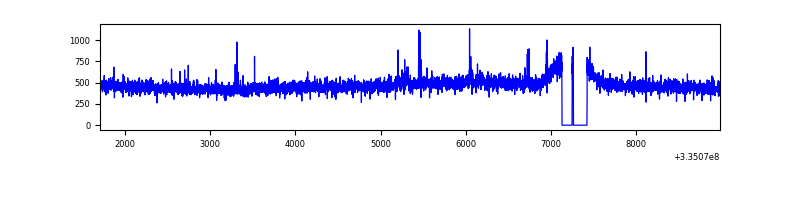 |
| C | 7278 | 6999 | 1645 | 1645 | 22.60% | 23.50% | 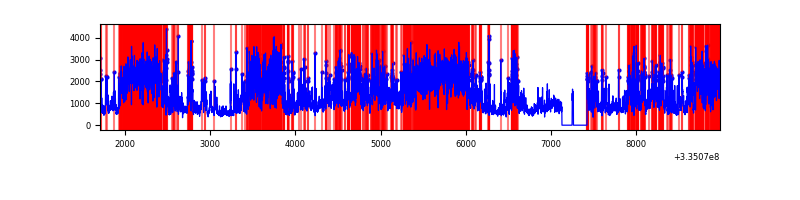 |
| D | 7279 | 7001 | 1293 | 1293 | 17.76% | 18.47% | 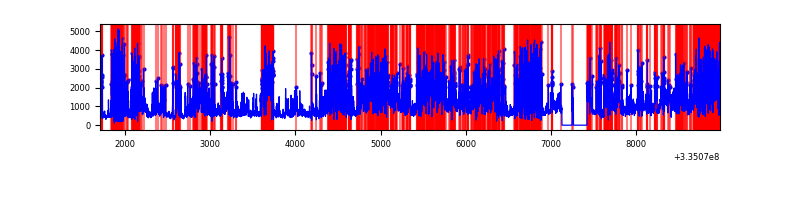 |
Top three noisy pixels from each quadrant. If the there are fewer than three noisy pixels in the level2.evt file, extra rows are filled as -1
| Pixel properties | Quadrant properties | ||||||
|---|---|---|---|---|---|---|---|
| Quadrant | DetID | PixID | Counts | Sigma | Mean | Median | Sigma |
| A | 0 | 13 | 27758 | 161.56 | 829 | 812 | 166.8 |
| A | 13 | 254 | 11400 | 63.48 | 829 | 812 | 166.8 |
| A | 3 | 137 | 7670 | 41.12 | 829 | 812 | 166.8 |
| B | 0 | 230 | 33606 | 211.14 | 828 | 807 | 155.3 |
| B | 12 | 111 | 19087 | 117.68 | 828 | 807 | 155.3 |
| B | 11 | 111 | 17357 | 106.54 | 828 | 807 | 155.3 |
| C | 3 | 233 | 7128950 | 44386.74 | 691 | 695 | 160.6 |
| C | 14 | 238 | 108383 | 670.56 | 691 | 695 | 160.6 |
| C | 2 | 16 | 16885 | 100.81 | 691 | 695 | 160.6 |
| D | 7 | 80 | 3334077 | 18917.47 | 737 | 716 | 176.2 |
| D | 1 | 52 | 2871468 | 16292.08 | 737 | 716 | 176.2 |
| D | 11 | 176 | 78895 | 443.68 | 737 | 716 | 176.2 |
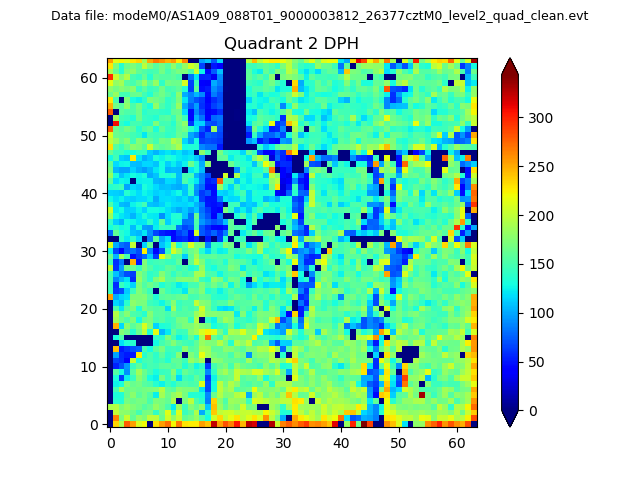
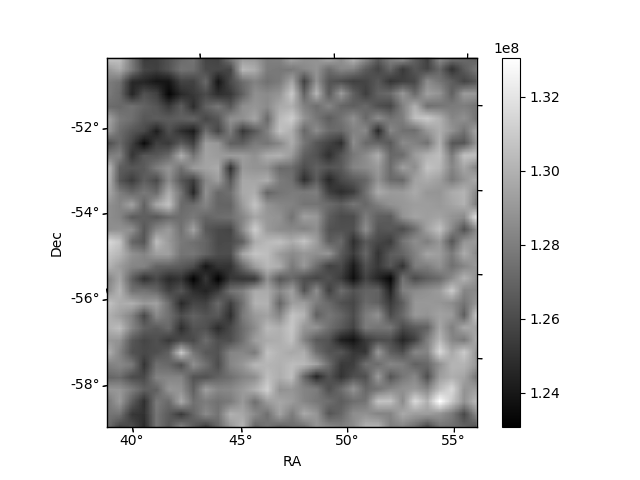
Histogram calculated using DETX and DETY for each event in the final _common_clean file
| Quadrant A | 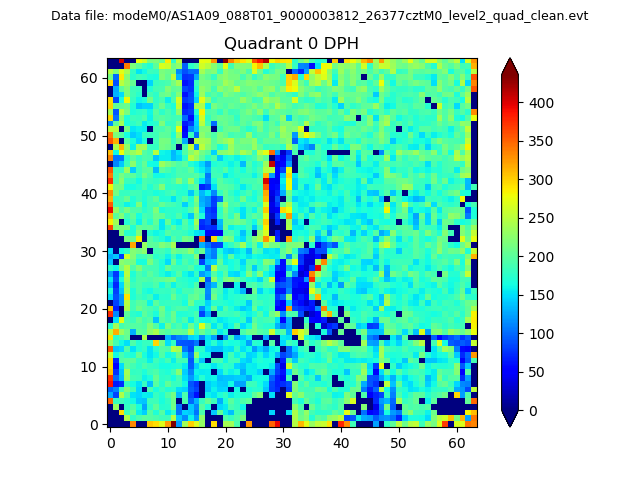 |
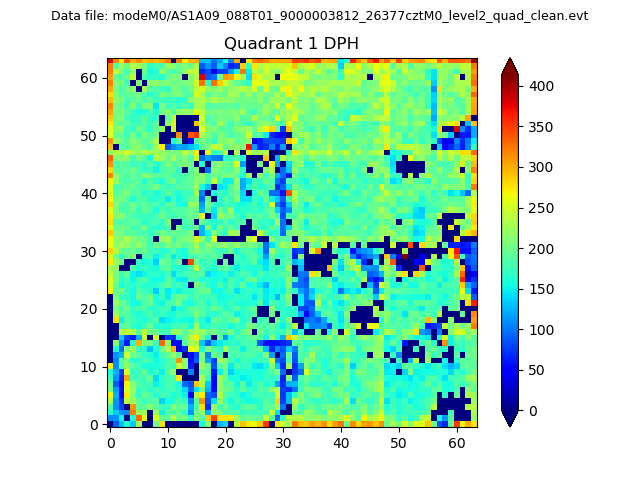 |
Quadrant B |
|---|---|---|---|
| Quadrant D | 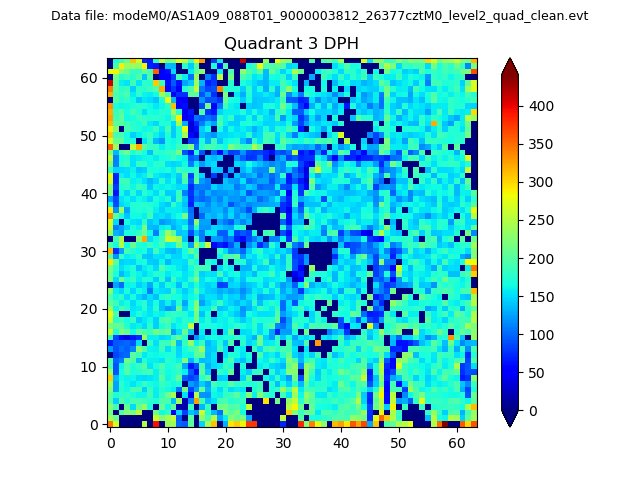 |
 |
Quadrant C |
| Plot type | Count rate plots | Images |
|---|---|---|
| Comparison with Poisson distribution Blue bars denote a histogram of data divided into 1 sec bins. Red curve is a Poisson curve with rate = median count rate of data. |
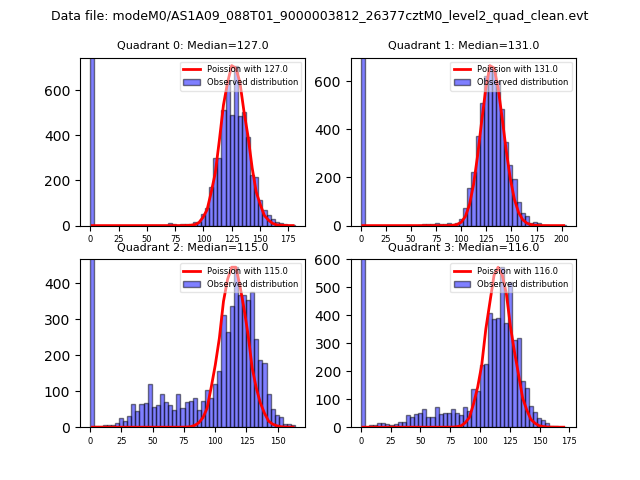 |
 |
| Quadrant-wise count rates Data is divided into 100 sec bins |
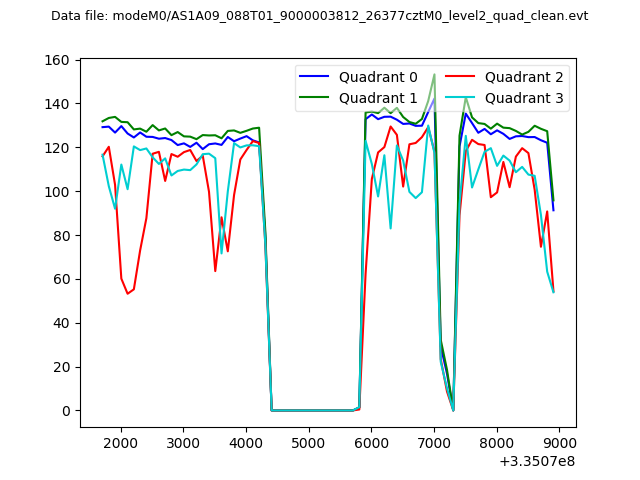 |
|
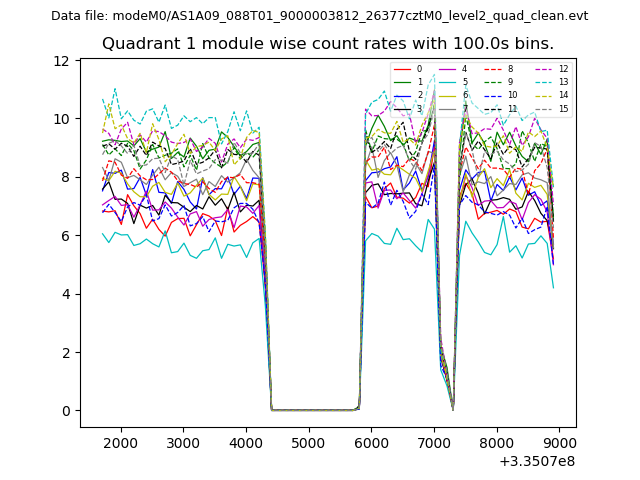
| Module-wise count rates for Quadrant A Data is divided into 100 sec bins |
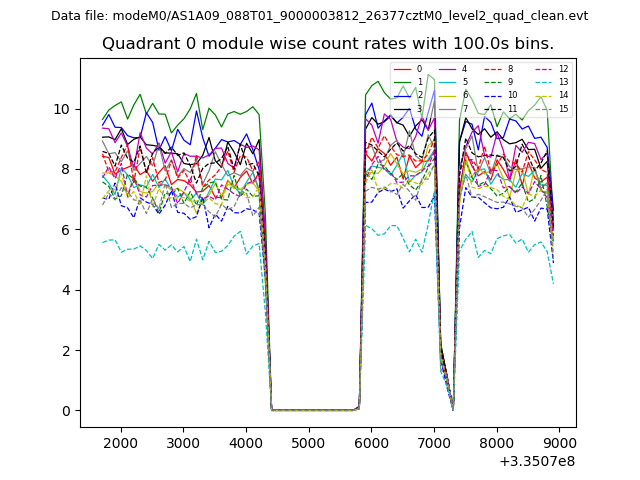 |
 |
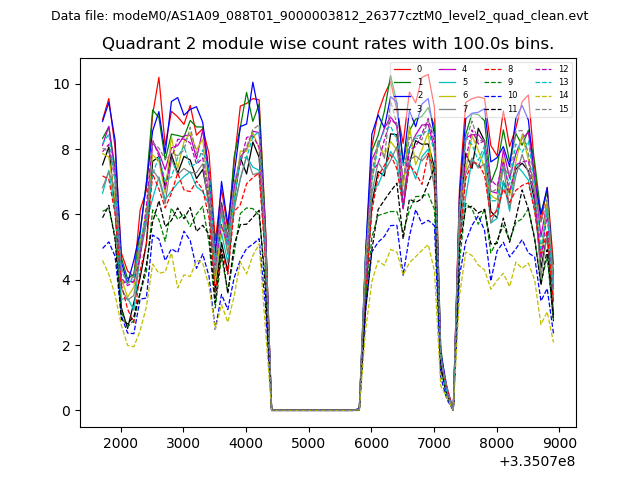
| Module-wise count rates for Quadrant B Data is divided into 100 sec bins |
 |
 |
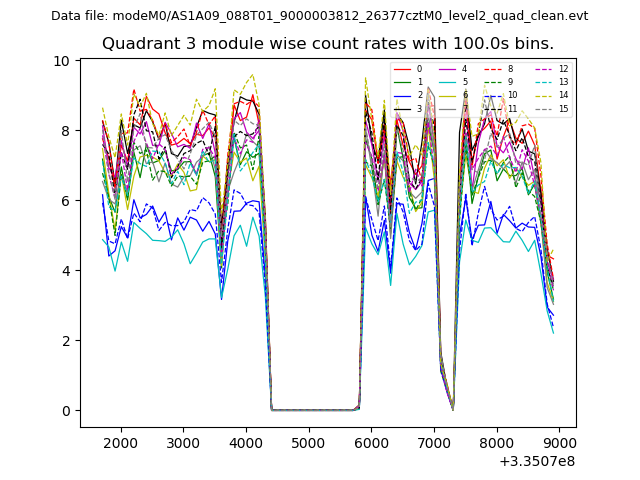
| Module-wise count rates for Quadrant C Data is divided into 100 sec bins |
 |
 |
| Module-wise count rates for Quadrant D Data is divided into 100 sec bins |
 |
 |
| Parameter | Plot |
|---|---|
| CZT HV Monitor |  |
| D_VDD | 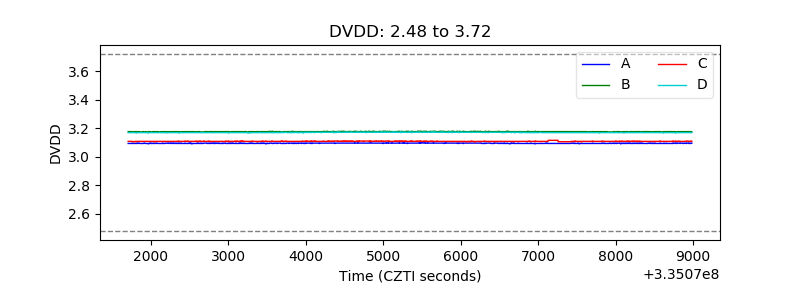 |
| Temperature 1 | 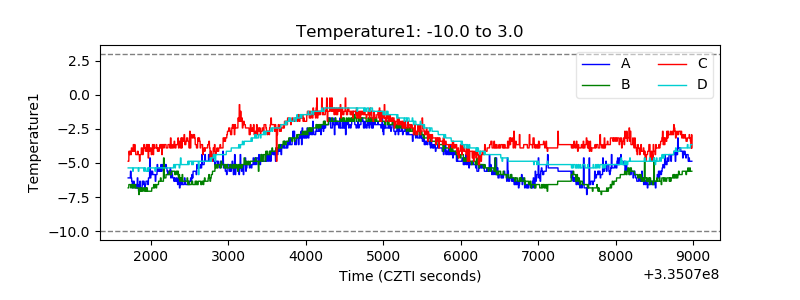 |
| Veto HV Monitor | 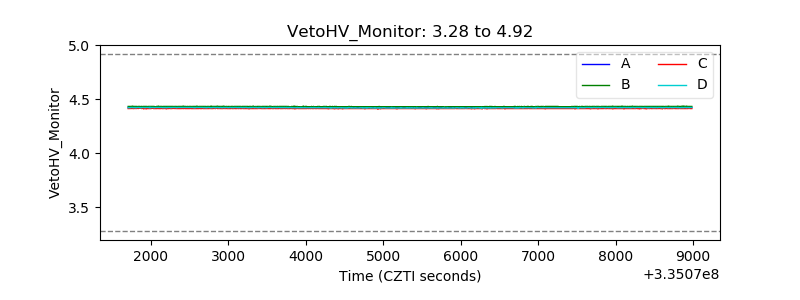 |
| Veto LLD | 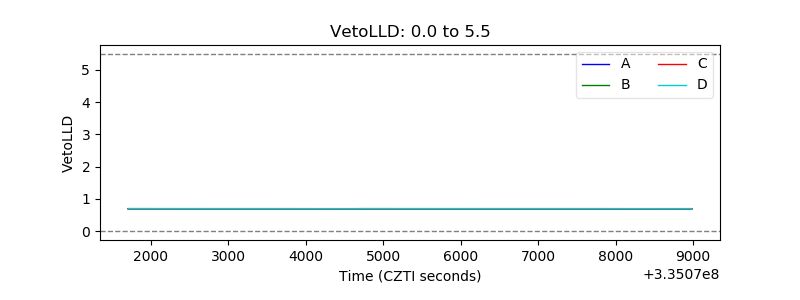 |
| Alpha Counter | 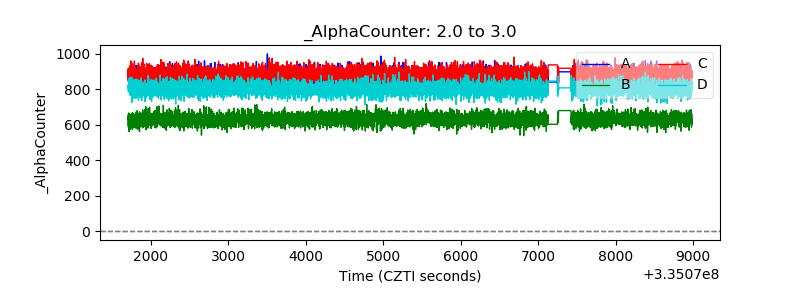 |
| _CPM_Rate | 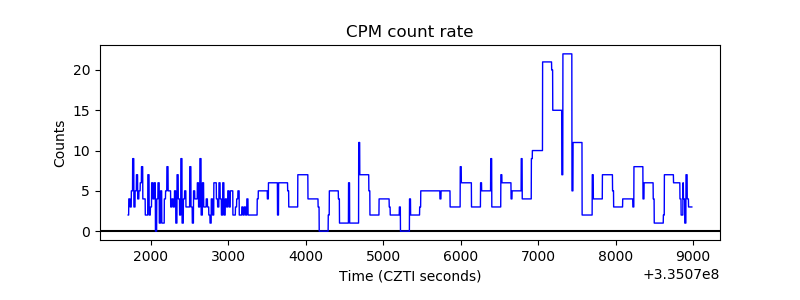 |
| CZT Counter |  |
| +2.5 Volts monitor | 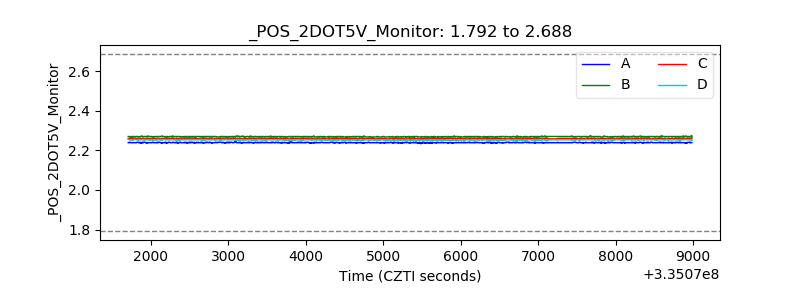 |
| +5 Volts monitor |  |
| _ROLL_ROT | 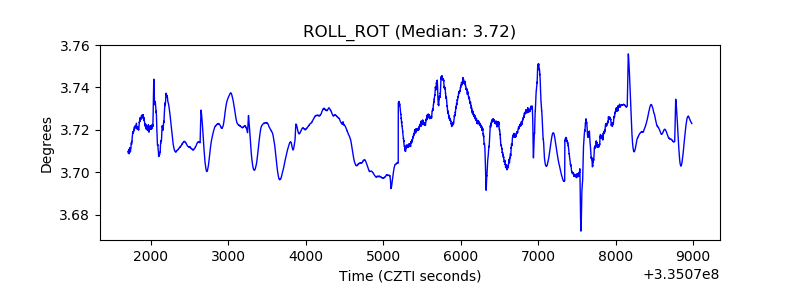 |
| _Roll_DEC | 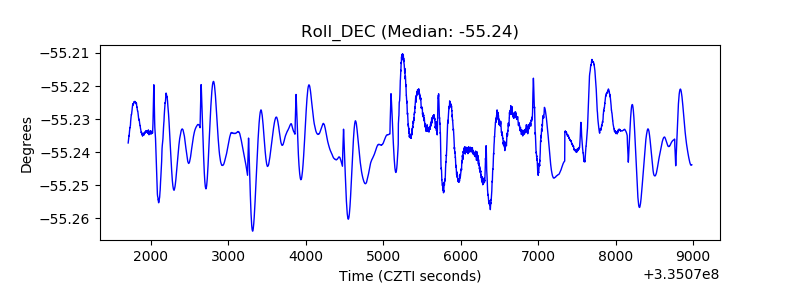 |
| _Roll_RA | 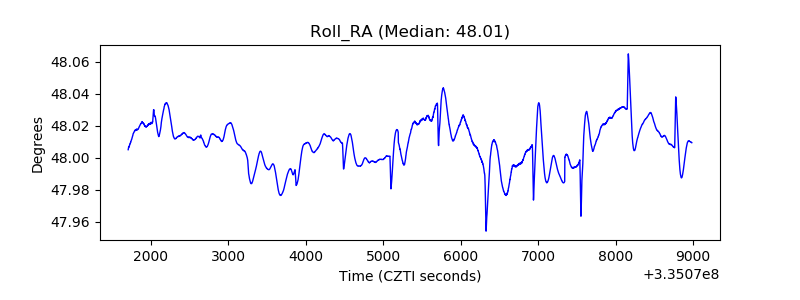 |
| Veto Counter | 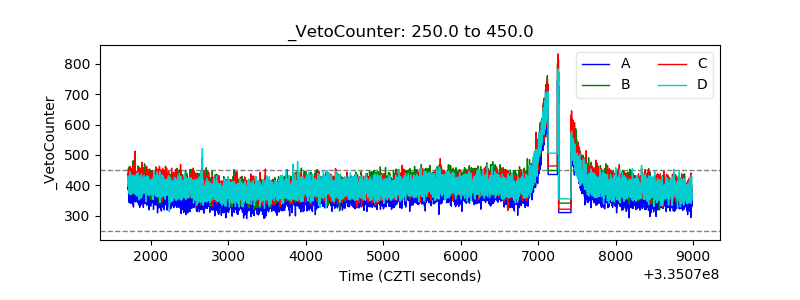 |