| Param | Original file | Final file |
|---|---|---|
| Filename | modeM0/AS1A09_088T01_9000003812_26381cztM0_level2.evt | modeM0/AS1A09_088T01_9000003812_26381cztM0_level2_quad_clean.evt |
| Size (bytes) | 882,426,240 | 107,115,840 |
| Size | 841.5 MB | 102.2 MB |
| Events in quadrant A | 3,800,436 | 729,422 |
| Events in quadrant B | 3,436,962 | 753,553 |
| Events in quadrant C | 10,173,111 | 612,025 |
| Events in quadrant D | 8,816,437 | 634,757 |
| Mode M9 | |||
|---|---|---|---|
| Quadrant | BADHDUFLAG | Total packets | Discarded packets |
| A | 0 | 1 | 0 |
| B | 0 | 1 | 0 |
| C | 0 | 1 | 0 |
| D | 0 | 1 | 0 |
| Mode M0 | |||
|---|---|---|---|
| Quadrant | BADHDUFLAG | Total packets | Discarded packets |
| A | 0 | 16274 | 0 |
| B | 0 | 15081 | 0 |
| C | 0 | 35306 | 0 |
| D | 0 | 31182 | 0 |
| Quadrant | Total seconds | Saturated seconds | Saturation percentage |
|---|---|---|---|
| A | 7362 | 328 | 4.455311% |
| B | 7363 | 187 | 2.539726% |
| C | 7363 | 2828 | 38.408258% |
| D | 7363 | 1844 | 25.044140% |
Noise dominated data is calculated using 1-second bins in cleaned event files. If a bin has >2000 counts, and if more than 50% of those come from <1% of pixels, then it is considered to be noise-dominated and hence unusable.
| Quadrant | # 1 sec bins | Bins with >0 counts | Bins with >2000 counts | High rate bins dominated by noise | Noise dominated (total time) | Noise dominated (detector-on time) | Marked lightcurve |
|---|---|---|---|---|---|---|---|
| A | 7502 | 7363 | 120 | 120 | 1.60% | 1.63% | 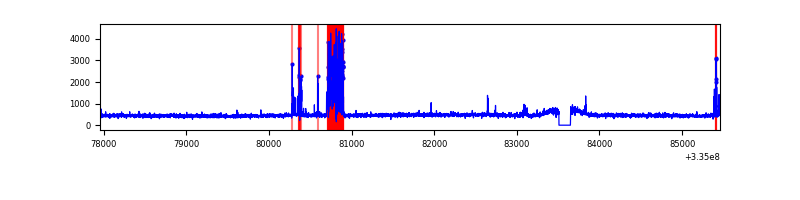 |
| B | 7503 | 7364 | 0 | 0 | 0.00% | 0.00% | 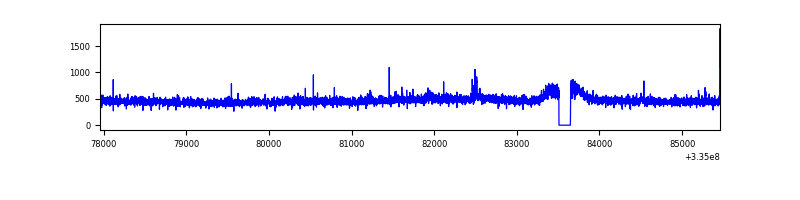 |
| C | 7503 | 7364 | 1695 | 1695 | 22.59% | 23.02% | 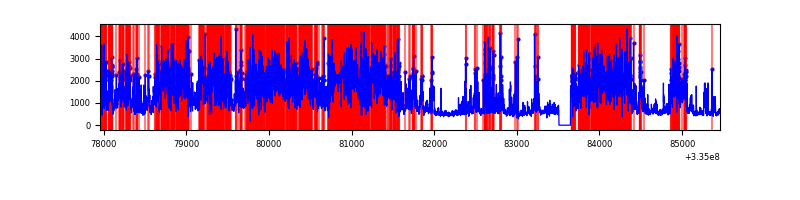 |
| D | 7503 | 7364 | 1402 | 1402 | 18.69% | 19.04% | 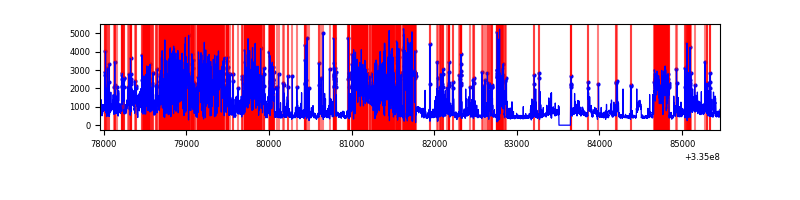 |
Top three noisy pixels from each quadrant. If the there are fewer than three noisy pixels in the level2.evt file, extra rows are filled as -1
| Pixel properties | Quadrant properties | ||||||
|---|---|---|---|---|---|---|---|
| Quadrant | DetID | PixID | Counts | Sigma | Mean | Median | Sigma |
| A | 0 | 13 | 471998 | 2699.69 | 862 | 842 | 174.5 |
| A | 13 | 254 | 11674 | 62.07 | 862 | 842 | 174.5 |
| A | 3 | 137 | 8212 | 42.23 | 862 | 842 | 174.5 |
| B | 0 | 230 | 29487 | 173.75 | 869 | 846 | 164.8 |
| B | 12 | 111 | 20216 | 117.51 | 869 | 846 | 164.8 |
| B | 11 | 111 | 18514 | 107.18 | 869 | 846 | 164.8 |
| C | 3 | 233 | 7172655 | 41481.69 | 732 | 736 | 172.9 |
| C | 14 | 238 | 112788 | 648.1 | 732 | 736 | 172.9 |
| C | 2 | 16 | 16680 | 92.22 | 732 | 736 | 172.9 |
| D | 1 | 52 | 3658129 | 19905.64 | 769 | 748 | 183.7 |
| D | 7 | 80 | 2047974 | 11142.22 | 769 | 748 | 183.7 |
| D | 11 | 176 | 143594 | 777.45 | 769 | 748 | 183.7 |
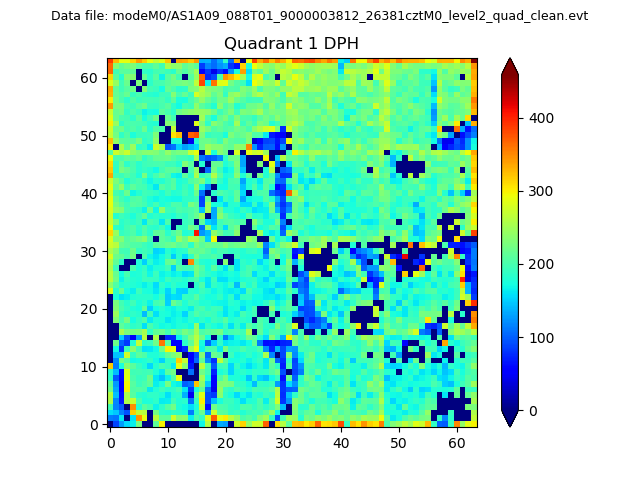
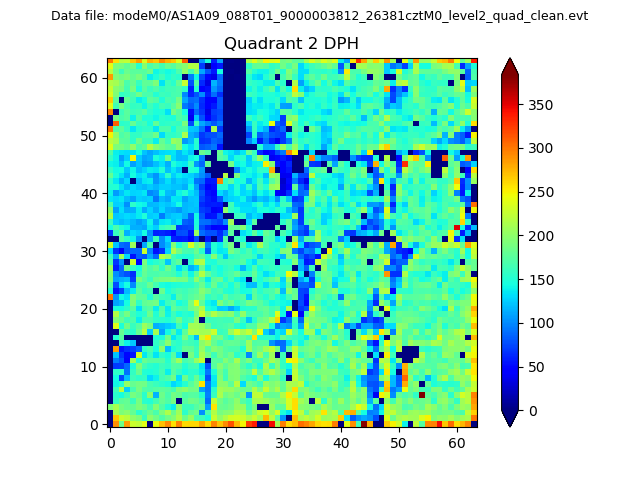
Histogram calculated using DETX and DETY for each event in the final _common_clean file
| Quadrant A |  |
 |
Quadrant B |
|---|---|---|---|
| Quadrant D |  |
 |
Quadrant C |
| Plot type | Count rate plots | Images |
|---|---|---|
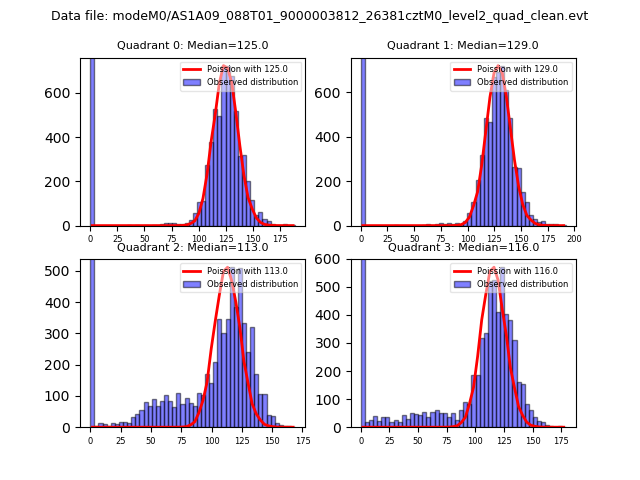
| Comparison with Poisson distribution Blue bars denote a histogram of data divided into 1 sec bins. Red curve is a Poisson curve with rate = median count rate of data. |
 |
 |
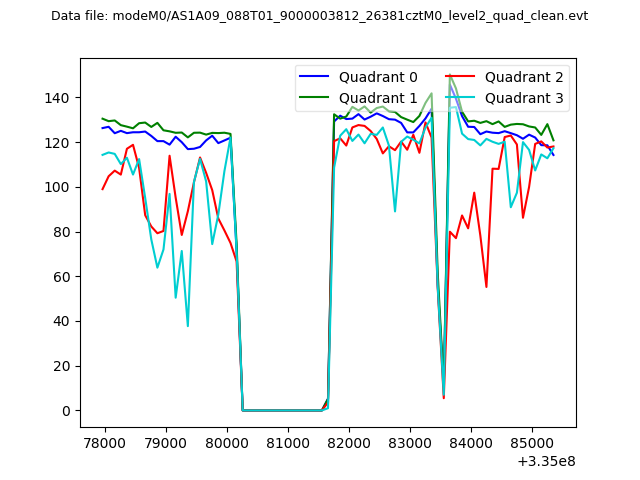
| Quadrant-wise count rates Data is divided into 100 sec bins |
 |
|
| Module-wise count rates for Quadrant A Data is divided into 100 sec bins |
 |
 |
| Module-wise count rates for Quadrant B Data is divided into 100 sec bins |
 |
 |
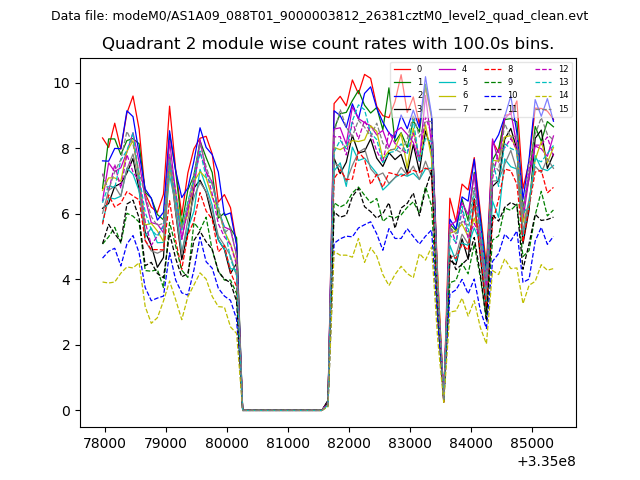
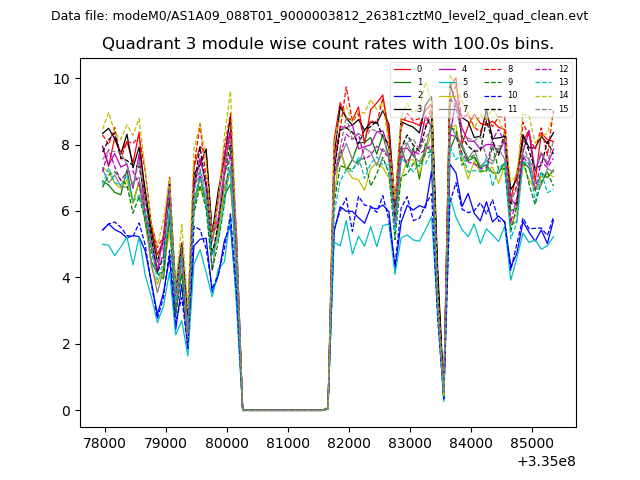
| Module-wise count rates for Quadrant C Data is divided into 100 sec bins |
 |
 |
| Module-wise count rates for Quadrant D Data is divided into 100 sec bins |
 |
 |
| Parameter | Plot |
|---|---|
| CZT HV Monitor | 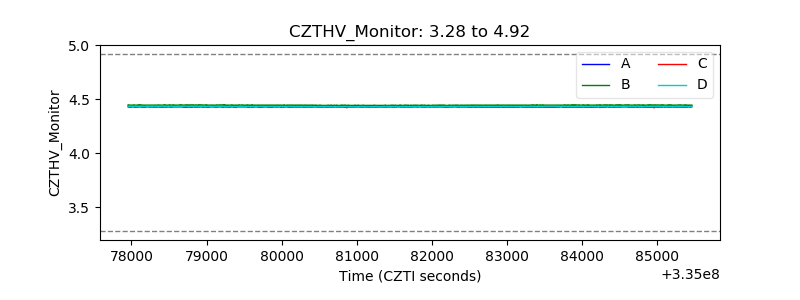 |
| D_VDD | 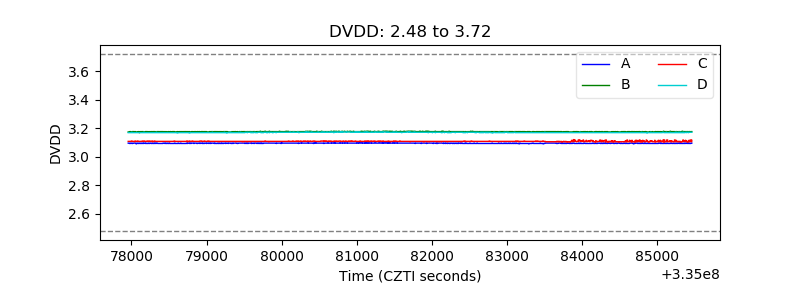 |
| Temperature 1 | 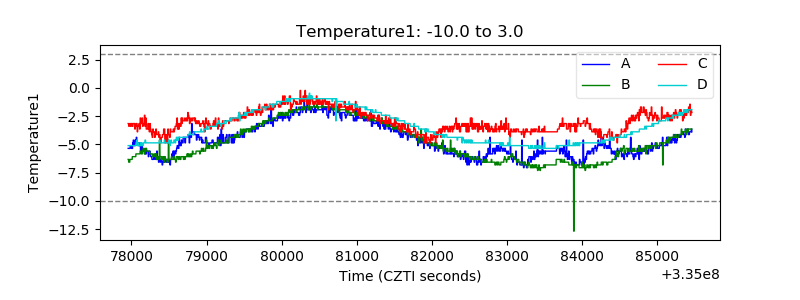 |
| Veto HV Monitor | 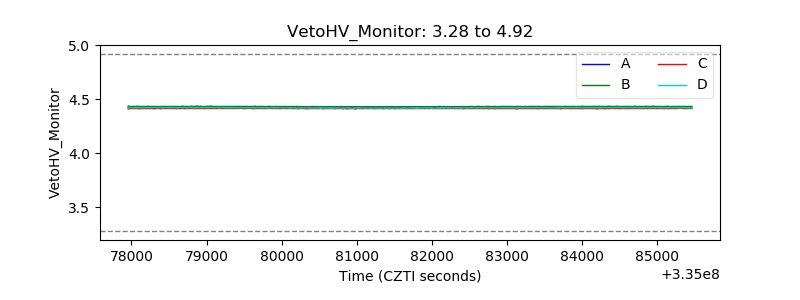 |
| Veto LLD | 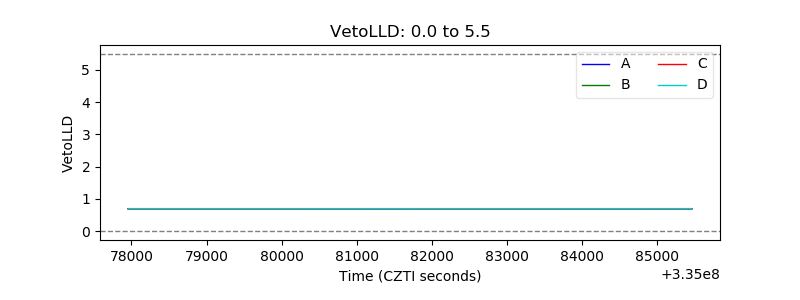 |
| Alpha Counter | 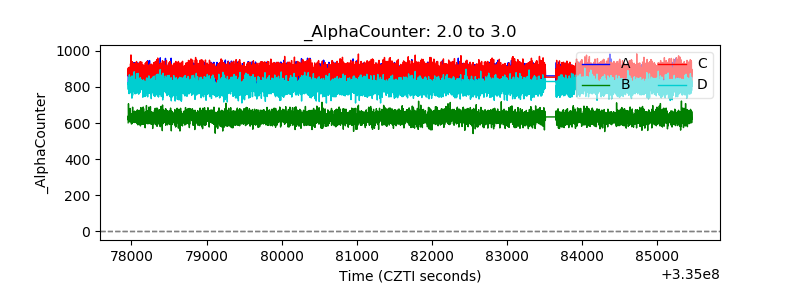 |
| _CPM_Rate | 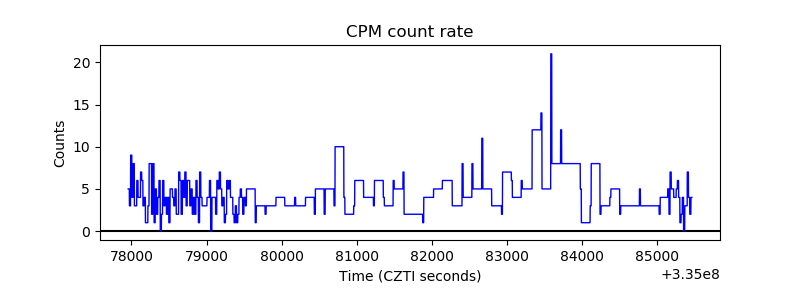 |
| CZT Counter | 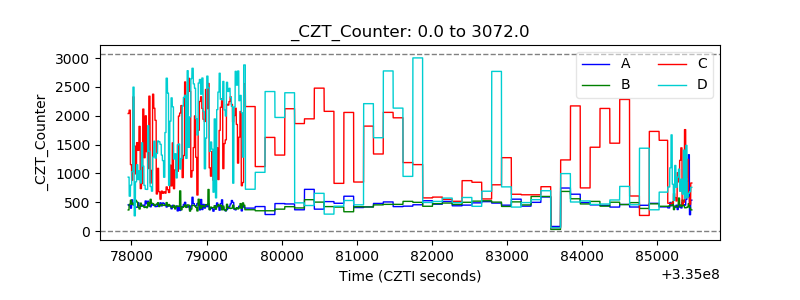 |
| +2.5 Volts monitor |  |
| +5 Volts monitor | 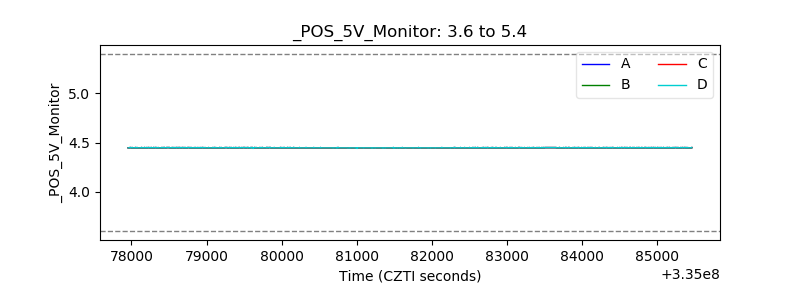 |
| _ROLL_ROT | 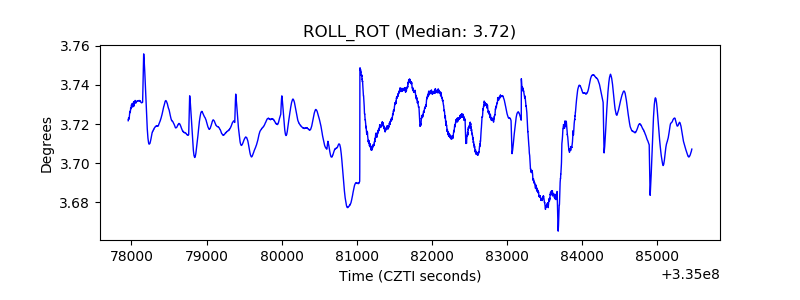 |
| _Roll_DEC | 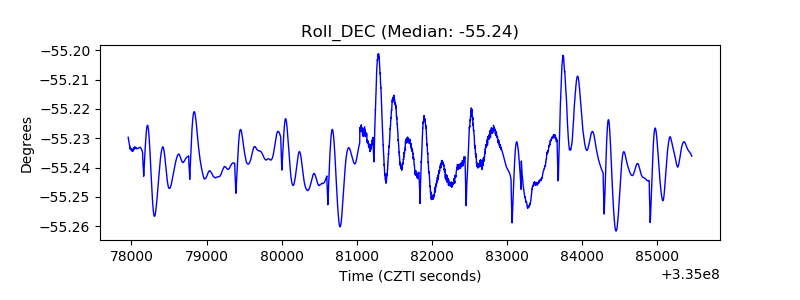 |
| _Roll_RA | 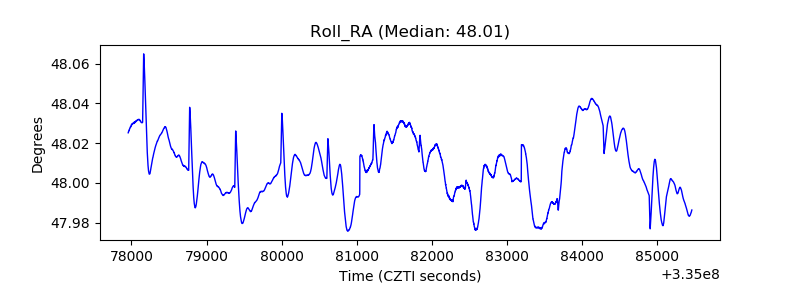 |
| Veto Counter | 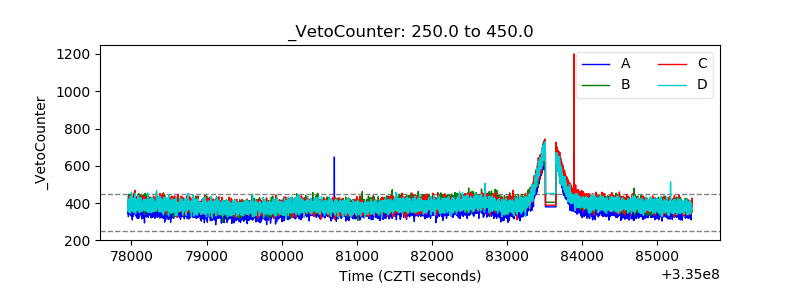 |