| Param | Original file | Final file |
|---|---|---|
| Filename | modeM0/AS1A09_088T01_9000003812_26387cztM0_level2.evt | modeM0/AS1A09_088T01_9000003812_26387cztM0_level2_quad_clean.evt |
| Size (bytes) | 587,566,080 | 114,972,480 |
| Size | 560.3 MB | 109.6 MB |
| Events in quadrant A | 3,553,238 | 785,335 |
| Events in quadrant B | 3,412,583 | 813,547 |
| Events in quadrant C | 4,389,195 | 743,648 |
| Events in quadrant D | 6,018,253 | 705,211 |
| Mode M9 | |||
|---|---|---|---|
| Quadrant | BADHDUFLAG | Total packets | Discarded packets |
| A | 0 | 21 | 0 |
| B | 0 | 22 | 0 |
| C | 0 | 22 | 0 |
| D | 0 | 22 | 0 |
| Mode M0 | |||
|---|---|---|---|
| Quadrant | BADHDUFLAG | Total packets | Discarded packets |
| A | 0 | 14418 | 0 |
| B | 0 | 14050 | 0 |
| C | 0 | 17249 | 0 |
| D | 0 | 22030 | 0 |
| Quadrant | Total seconds | Saturated seconds | Saturation percentage |
|---|---|---|---|
| A | 6224 | 124 | 1.992288% |
| B | 6224 | 67 | 1.076478% |
| C | 6224 | 309 | 4.964653% |
| D | 6224 | 790 | 12.692802% |
Noise dominated data is calculated using 1-second bins in cleaned event files. If a bin has >2000 counts, and if more than 50% of those come from <1% of pixels, then it is considered to be noise-dominated and hence unusable.
| Quadrant | # 1 sec bins | Bins with >0 counts | Bins with >2000 counts | High rate bins dominated by noise | Noise dominated (total time) | Noise dominated (detector-on time) | Marked lightcurve |
|---|---|---|---|---|---|---|---|
| A | 7579 | 6225 | 51 | 51 | 0.67% | 0.82% | 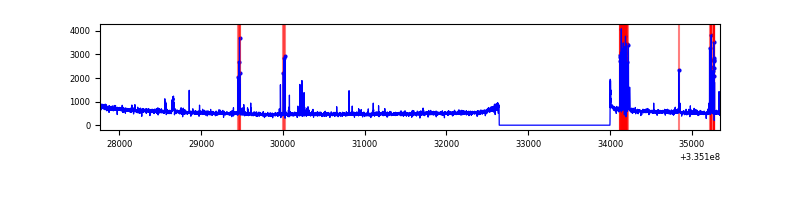 |
| B | 7579 | 6225 | 0 | 0 | 0.00% | 0.00% | 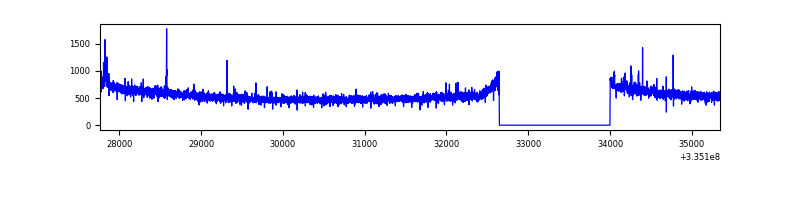 |
| C | 7579 | 6225 | 95 | 95 | 1.25% | 1.53% | 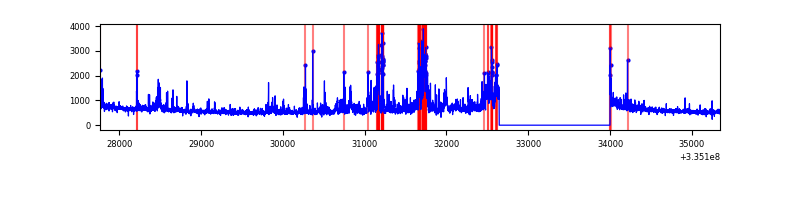 |
| D | 7579 | 6224 | 630 | 630 | 8.31% | 10.12% | 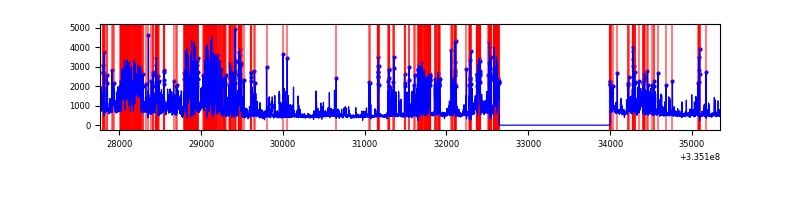 |
Top three noisy pixels from each quadrant. If the there are fewer than three noisy pixels in the level2.evt file, extra rows are filled as -1
| Pixel properties | Quadrant properties | ||||||
|---|---|---|---|---|---|---|---|
| Quadrant | DetID | PixID | Counts | Sigma | Mean | Median | Sigma |
| A | 0 | 13 | 266668 | 1597.29 | 851 | 839 | 166.4 |
| A | 13 | 254 | 10456 | 57.79 | 851 | 839 | 166.4 |
| A | 0 | 226 | 7414 | 39.51 | 851 | 839 | 166.4 |
| B | 0 | 230 | 31982 | 199.09 | 861 | 844 | 156.4 |
| B | 5 | 172 | 26666 | 165.1 | 861 | 844 | 156.4 |
| B | 12 | 111 | 17774 | 108.24 | 861 | 844 | 156.4 |
| C | 3 | 233 | 1012394 | 5509.04 | 807 | 816 | 183.6 |
| C | 14 | 238 | 134602 | 728.6 | 807 | 816 | 183.6 |
| C | 2 | 16 | 91522 | 493.98 | 807 | 816 | 183.6 |
| D | 7 | 80 | 1767368 | 9590.18 | 785 | 769 | 184.2 |
| D | 1 | 52 | 1152255 | 6250.97 | 785 | 769 | 184.2 |
| D | 12 | 233 | 121373 | 654.71 | 785 | 769 | 184.2 |
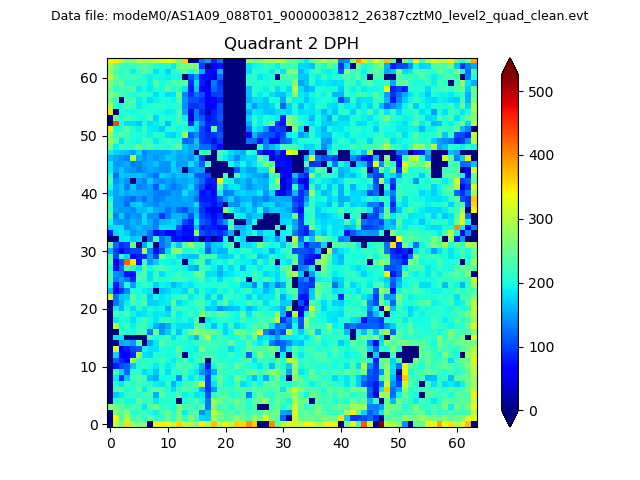
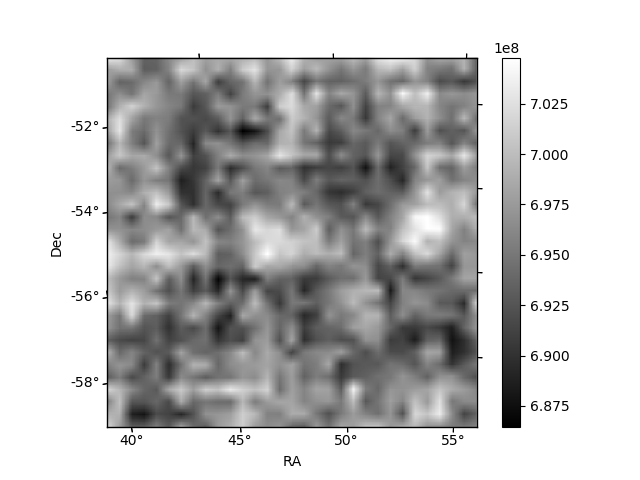
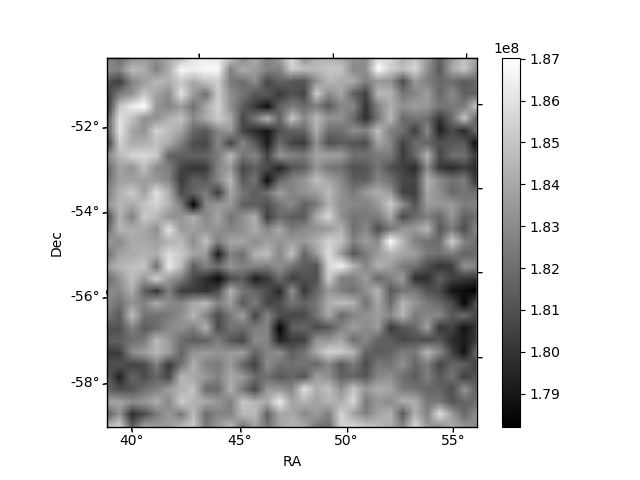
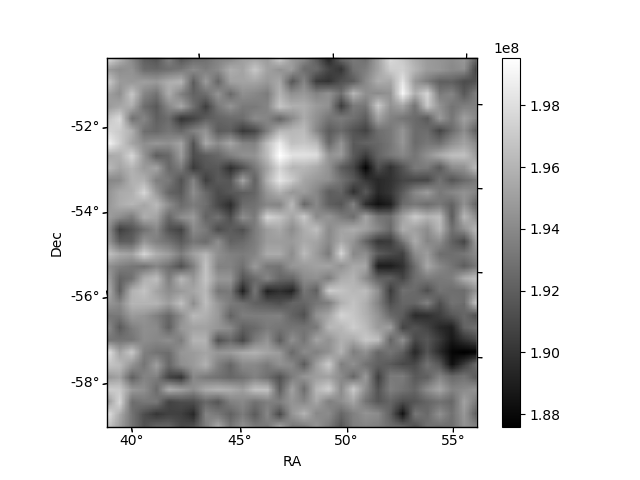
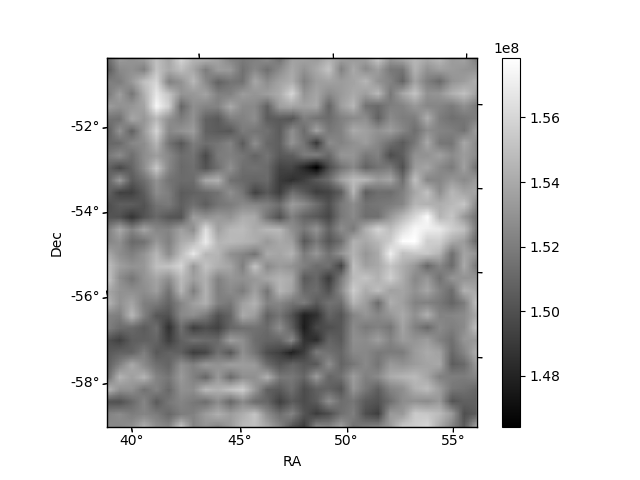
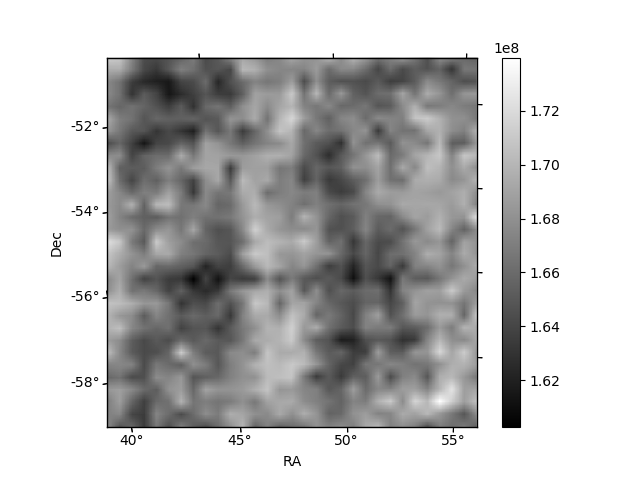
Histogram calculated using DETX and DETY for each event in the final _common_clean file
| Quadrant A | 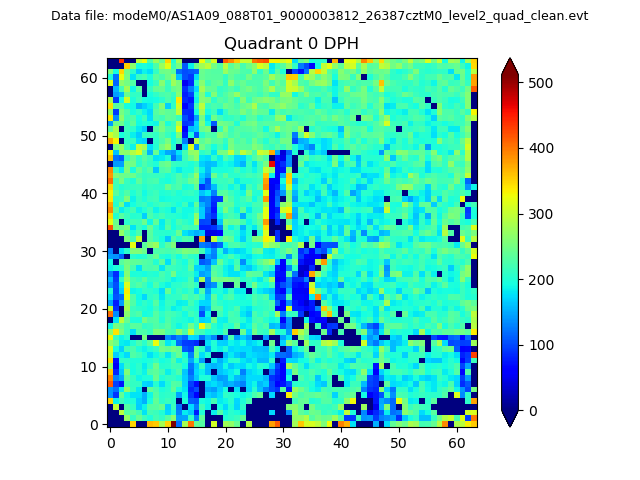 |
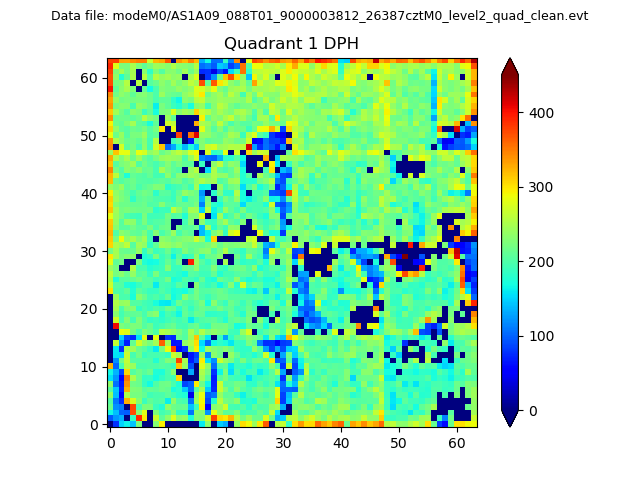 |
Quadrant B |
|---|---|---|---|
| Quadrant D | 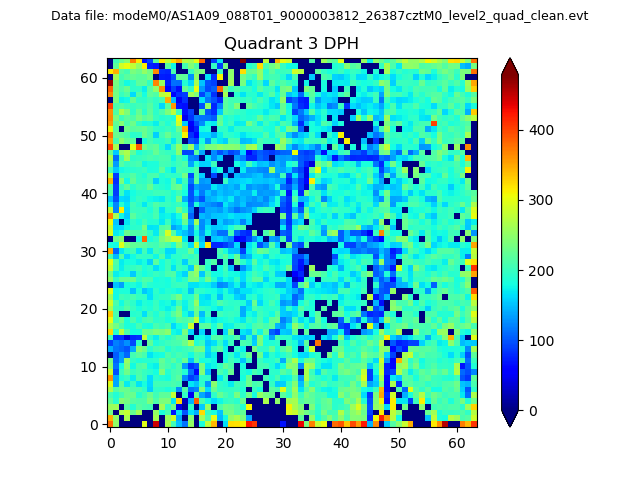 |
 |
Quadrant C |
| Plot type | Count rate plots | Images |
|---|---|---|
| Comparison with Poisson distribution Blue bars denote a histogram of data divided into 1 sec bins. Red curve is a Poisson curve with rate = median count rate of data. |
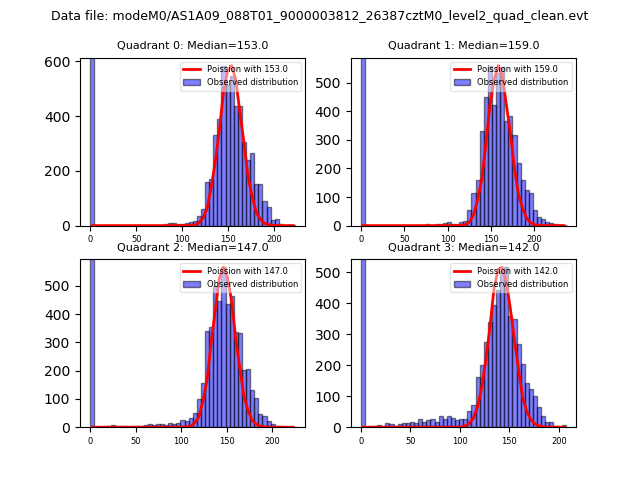 |
 |
| Quadrant-wise count rates Data is divided into 100 sec bins |
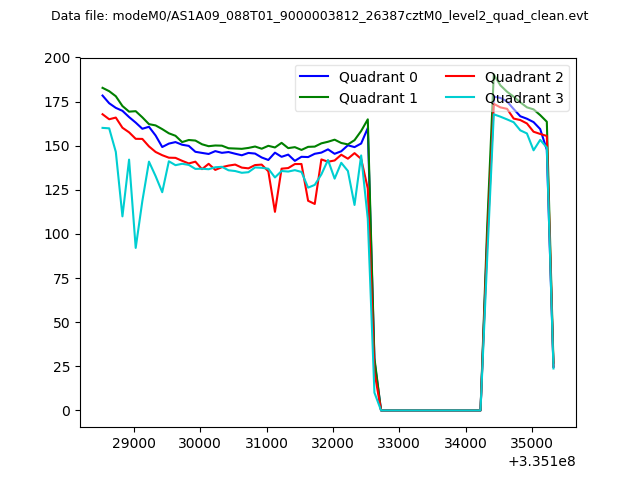 |
|
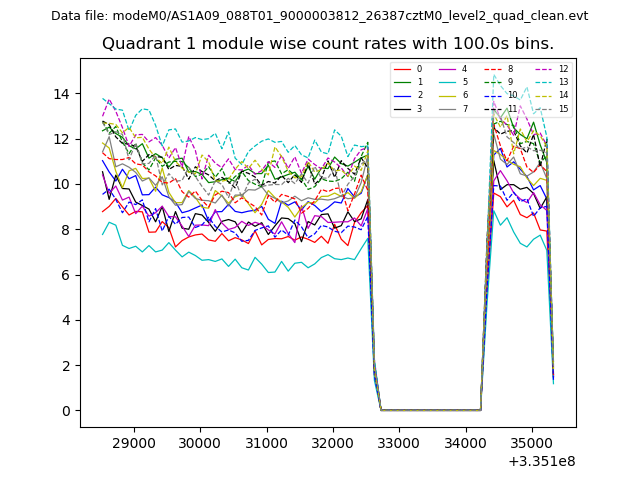
| Module-wise count rates for Quadrant A Data is divided into 100 sec bins |
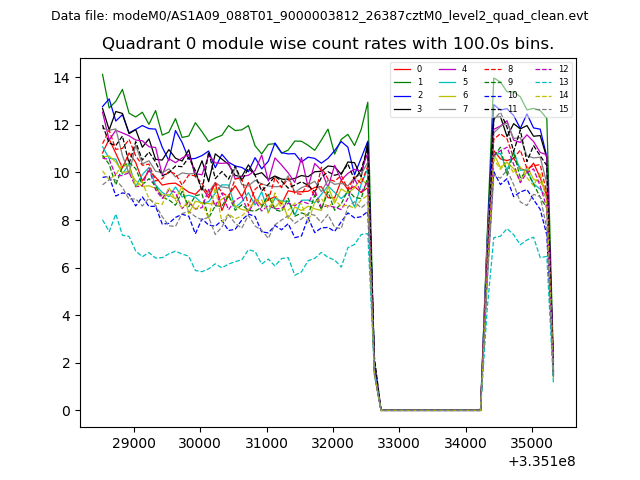 |
 |
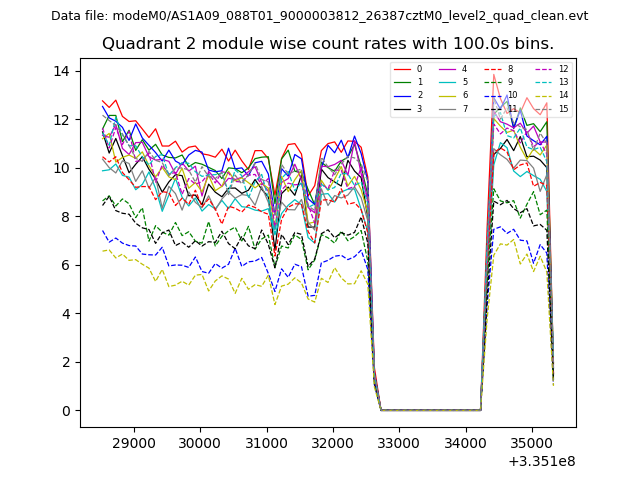
| Module-wise count rates for Quadrant B Data is divided into 100 sec bins |
 |
 |
| Module-wise count rates for Quadrant C Data is divided into 100 sec bins |
 |
 |
| Module-wise count rates for Quadrant D Data is divided into 100 sec bins |
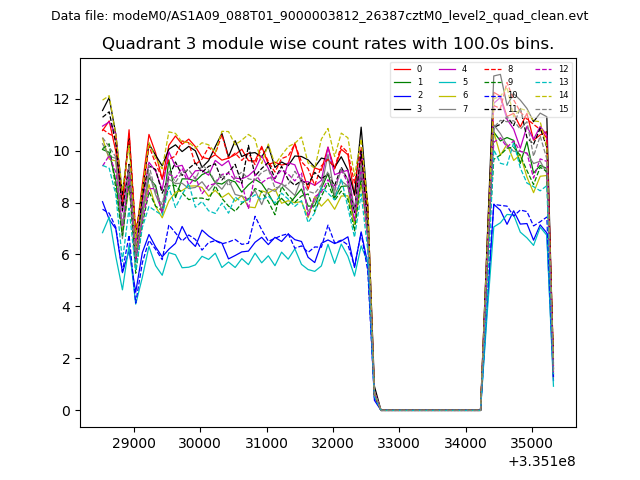 |
 |
| Parameter | Plot |
|---|---|
| CZT HV Monitor | 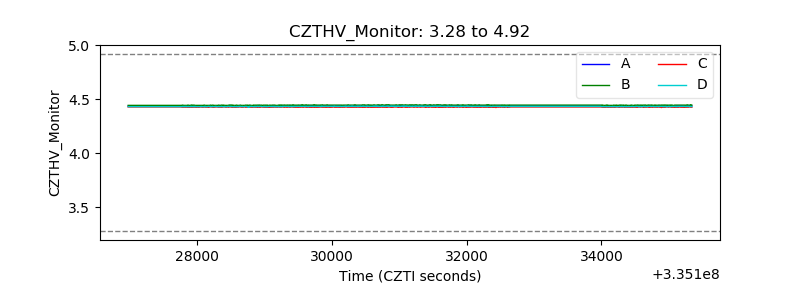 |
| D_VDD | 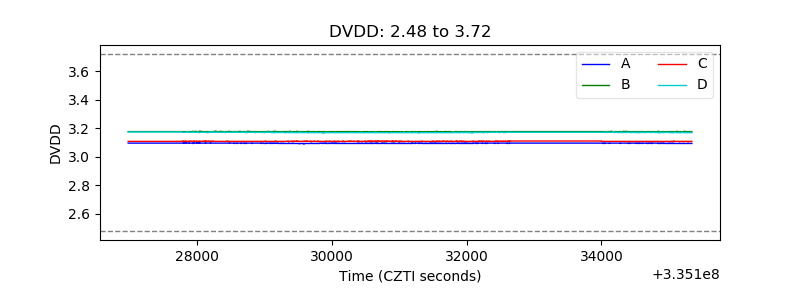 |
| Temperature 1 | 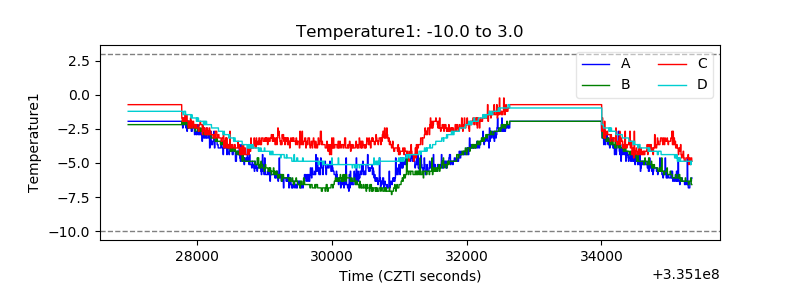 |
| Veto HV Monitor |  |
| Veto LLD | 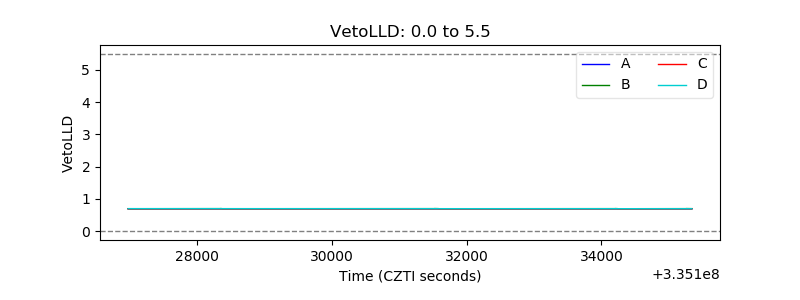 |
| Alpha Counter | 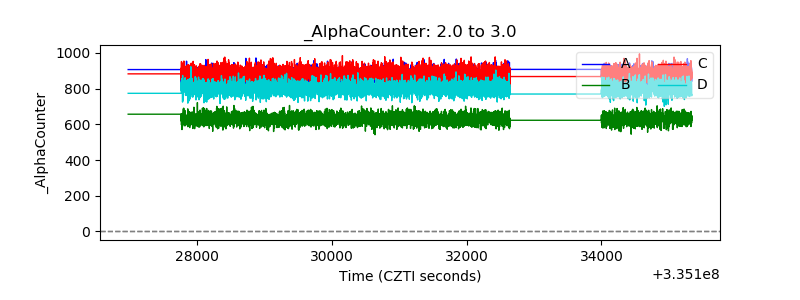 |
| _CPM_Rate | 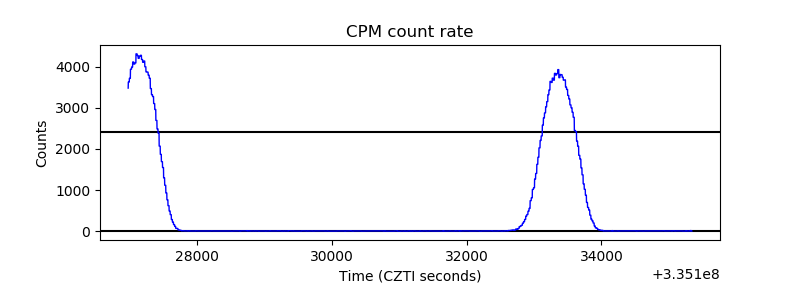 |
| CZT Counter | 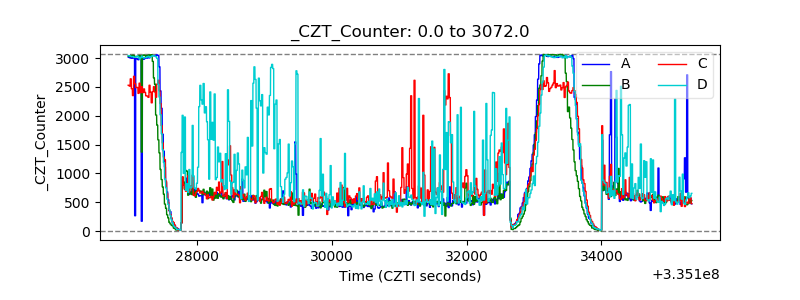 |
| +2.5 Volts monitor |  |
| +5 Volts monitor |  |
| _ROLL_ROT | 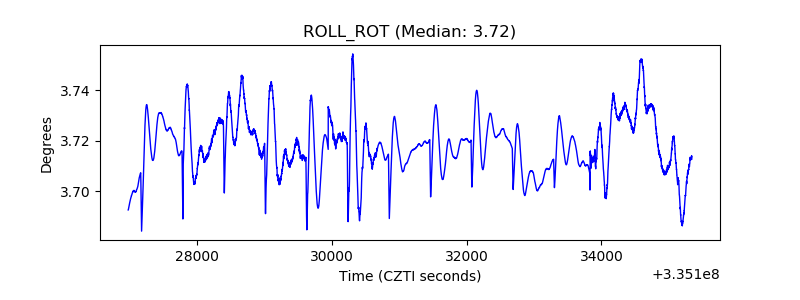 |
| _Roll_DEC | 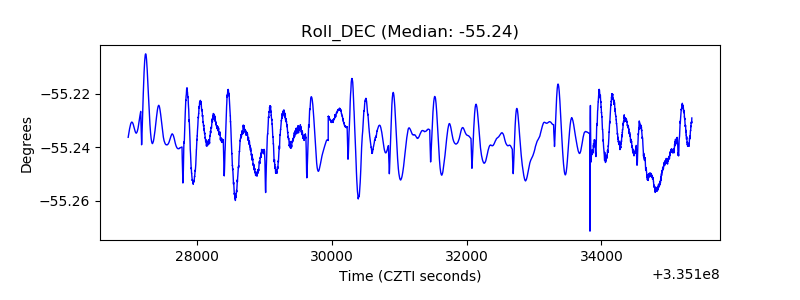 |
| _Roll_RA | 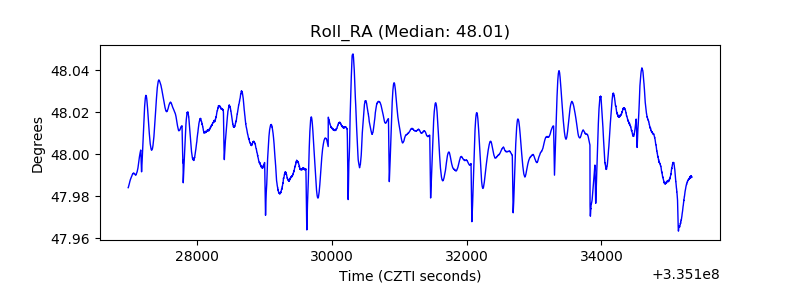 |
| Veto Counter | 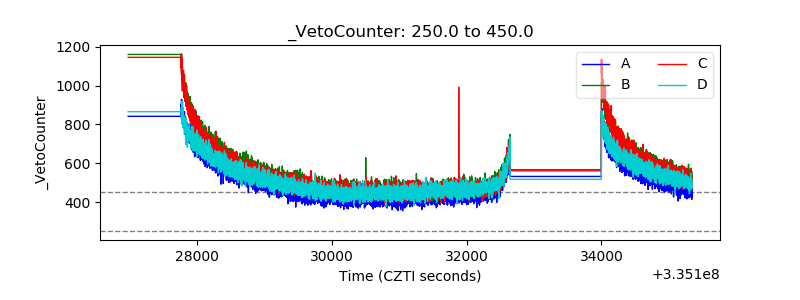 |