| Param | Original file | Final file |
|---|---|---|
| Filename | modeM0/AS1A09_088T01_9000003812_26388cztM0_level2.evt | modeM0/AS1A09_088T01_9000003812_26388cztM0_level2_quad_clean.evt |
| Size (bytes) | 132,687,360 | 27,455,040 |
| Size | 126.5 MB | 26.2 MB |
| Events in quadrant A | 981,797 | 181,709 |
| Events in quadrant B | 865,462 | 190,980 |
| Events in quadrant C | 911,158 | 178,011 |
| Events in quadrant D | 1,158,357 | 171,737 |
| Mode M9 | |||
|---|---|---|---|
| Quadrant | BADHDUFLAG | Total packets | Discarded packets |
| A | 0 | 9 | 0 |
| B | 0 | 10 | 0 |
| C | 0 | 10 | 0 |
| D | 0 | 10 | 0 |
| Mode M0 | |||
|---|---|---|---|
| Quadrant | BADHDUFLAG | Total packets | Discarded packets |
| A | 0 | 3816 | 0 |
| B | 0 | 3523 | 0 |
| C | 0 | 3635 | 0 |
| D | 0 | 4401 | 0 |
| Quadrant | Total seconds | Saturated seconds | Saturation percentage |
|---|---|---|---|
| A | 1465 | 70 | 4.778157% |
| B | 1465 | 10 | 0.682594% |
| C | 1465 | 30 | 2.047782% |
| D | 1465 | 65 | 4.436860% |
Noise dominated data is calculated using 1-second bins in cleaned event files. If a bin has >2000 counts, and if more than 50% of those come from <1% of pixels, then it is considered to be noise-dominated and hence unusable.
| Quadrant | # 1 sec bins | Bins with >0 counts | Bins with >2000 counts | High rate bins dominated by noise | Noise dominated (total time) | Noise dominated (detector-on time) | Marked lightcurve |
|---|---|---|---|---|---|---|---|
| A | 1465 | 1465 | 44 | 44 | 3.00% | 3.00% | 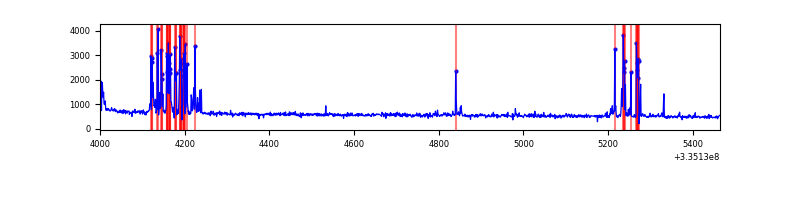 |
| B | 1465 | 1465 | 0 | 0 | 0.00% | 0.00% | 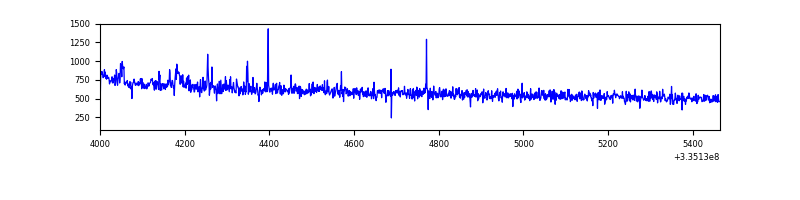 |
| C | 1465 | 1465 | 4 | 4 | 0.27% | 0.27% | 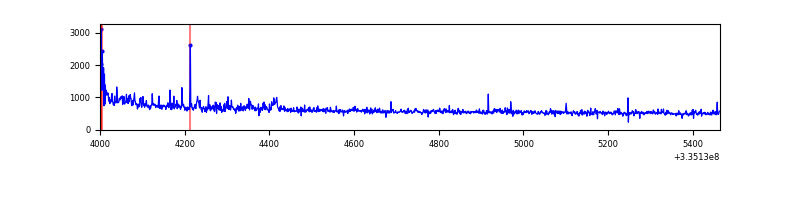 |
| D | 1465 | 1465 | 46 | 46 | 3.14% | 3.14% | 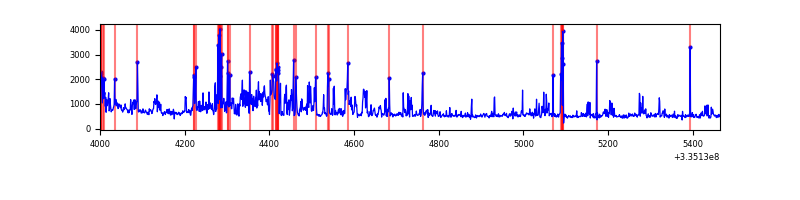 |
Top three noisy pixels from each quadrant. If the there are fewer than three noisy pixels in the level2.evt file, extra rows are filled as -1
| Pixel properties | Quadrant properties | ||||||
|---|---|---|---|---|---|---|---|
| Quadrant | DetID | PixID | Counts | Sigma | Mean | Median | Sigma |
| A | 0 | 13 | 175306 | 4096.48 | 208 | 205 | 42.7 |
| A | 13 | 254 | 2839 | 61.62 | 208 | 205 | 42.7 |
| A | 0 | 226 | 1827 | 37.95 | 208 | 205 | 42.7 |
| B | 0 | 230 | 13845 | 326.87 | 217 | 213 | 41.7 |
| B | 5 | 172 | 5149 | 118.36 | 217 | 213 | 41.7 |
| B | 12 | 111 | 4432 | 101.16 | 217 | 213 | 41.7 |
| C | 3 | 233 | 60309 | 1258.27 | 203 | 205 | 47.8 |
| C | 14 | 238 | 34524 | 718.46 | 203 | 205 | 47.8 |
| C | 2 | 16 | 22948 | 476.12 | 203 | 205 | 47.8 |
| D | 1 | 52 | 322801 | 6608.14 | 200 | 196 | 48.8 |
| D | 12 | 233 | 50948 | 1039.59 | 200 | 196 | 48.8 |
| D | 7 | 80 | 20584 | 417.62 | 200 | 196 | 48.8 |
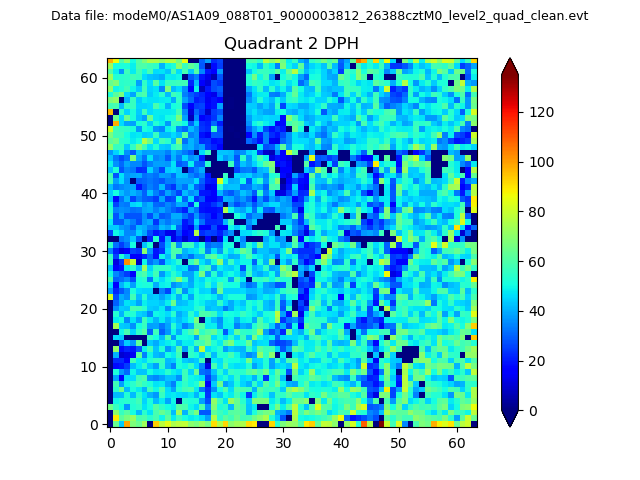
Histogram calculated using DETX and DETY for each event in the final _common_clean file
| Quadrant A | 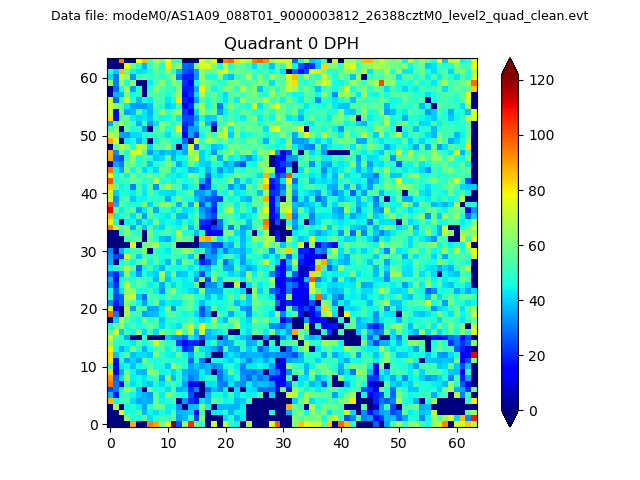 |
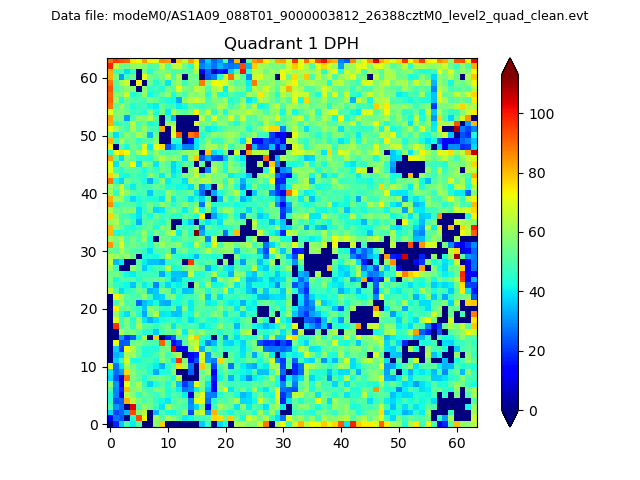 |
Quadrant B |
|---|---|---|---|
| Quadrant D | 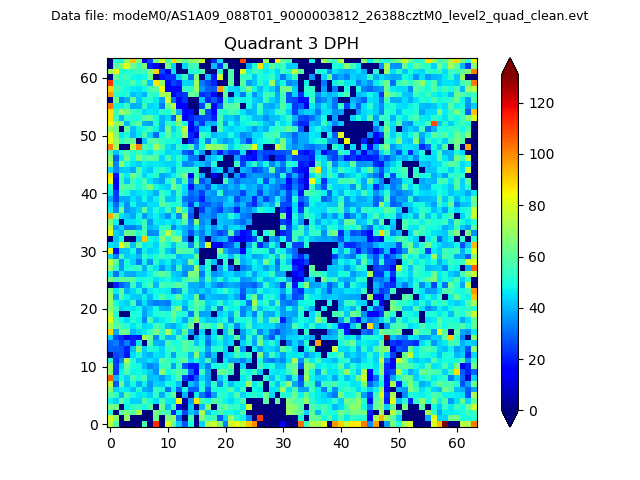 |
 |
Quadrant C |
| Plot type | Count rate plots | Images |
|---|---|---|
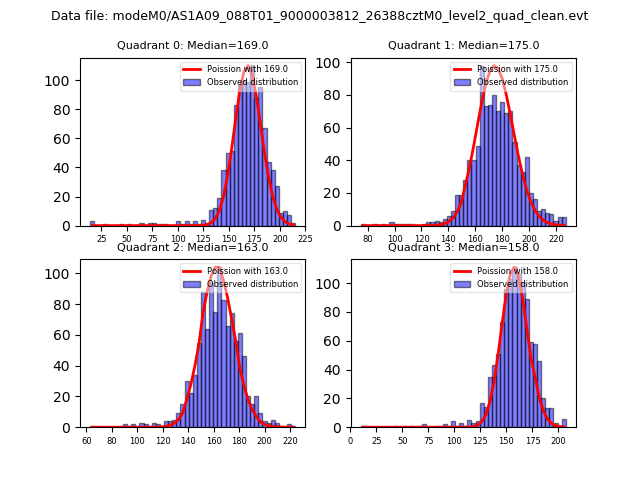
| Comparison with Poisson distribution Blue bars denote a histogram of data divided into 1 sec bins. Red curve is a Poisson curve with rate = median count rate of data. |
 |
 |
| Quadrant-wise count rates Data is divided into 100 sec bins |
 |
|
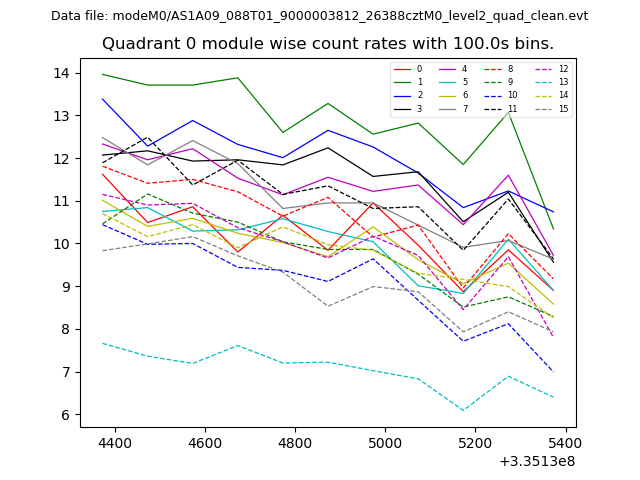
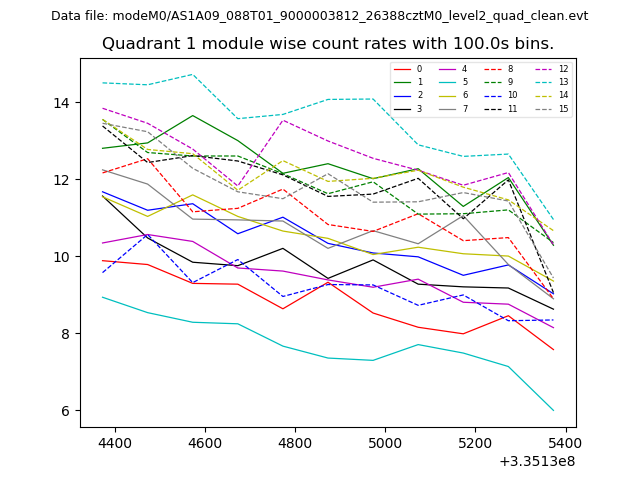
| Module-wise count rates for Quadrant A Data is divided into 100 sec bins |
 |
 |
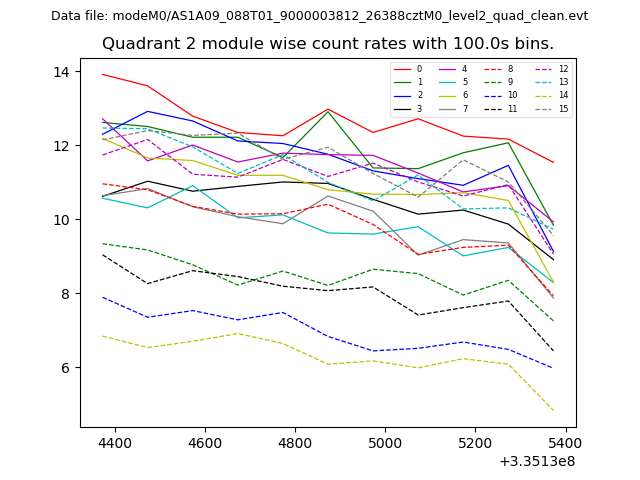
| Module-wise count rates for Quadrant B Data is divided into 100 sec bins |
 |
 |
| Module-wise count rates for Quadrant C Data is divided into 100 sec bins |
 |
 |
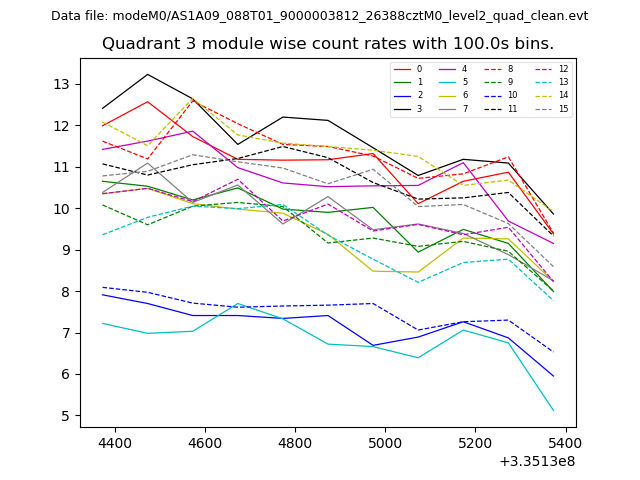
| Module-wise count rates for Quadrant D Data is divided into 100 sec bins |
 |
 |
| Parameter | Plot |
|---|---|
| CZT HV Monitor | 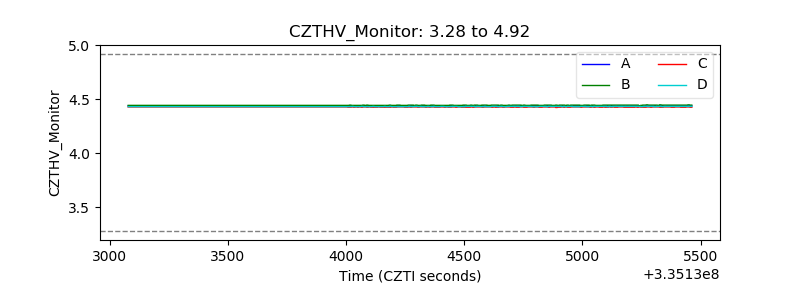 |
| D_VDD | 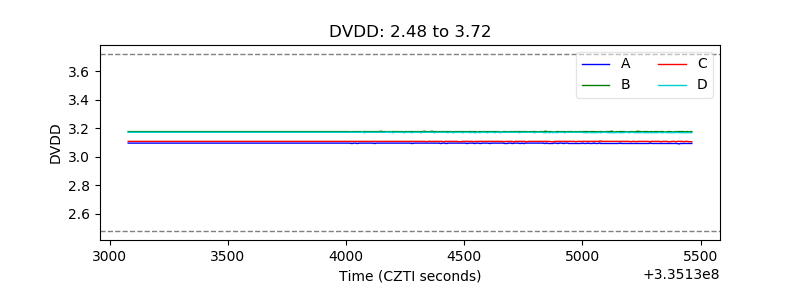 |
| Temperature 1 | 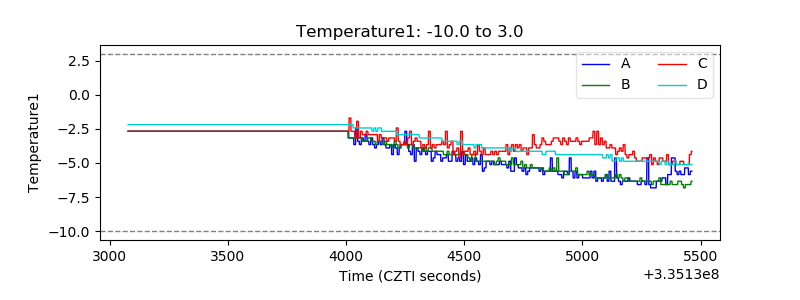 |
| Veto HV Monitor |  |
| Veto LLD | 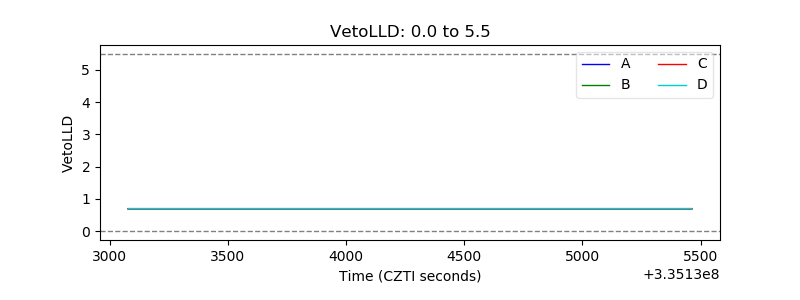 |
| Alpha Counter | 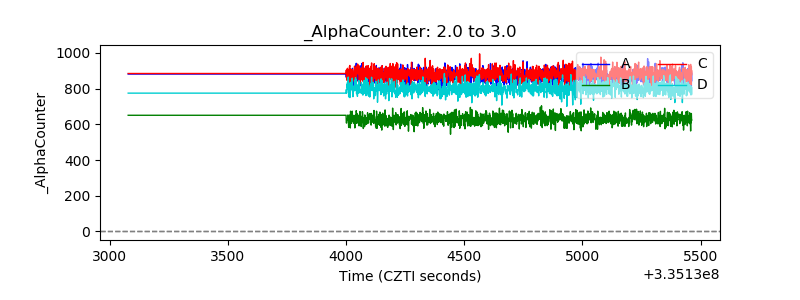 |
| _CPM_Rate | 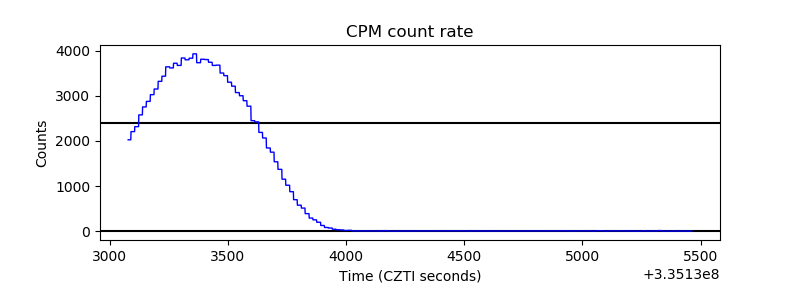 |
| CZT Counter | 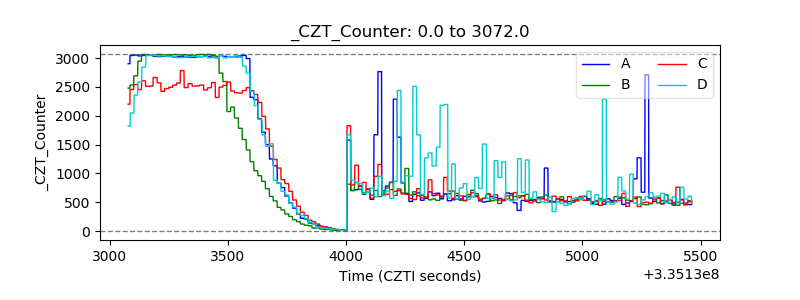 |
| +2.5 Volts monitor | 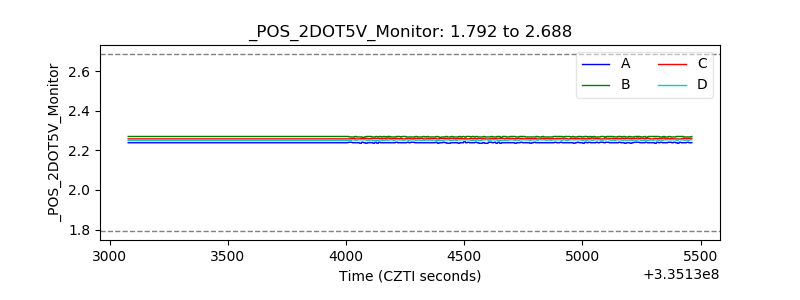 |
| +5 Volts monitor |  |
| _ROLL_ROT | 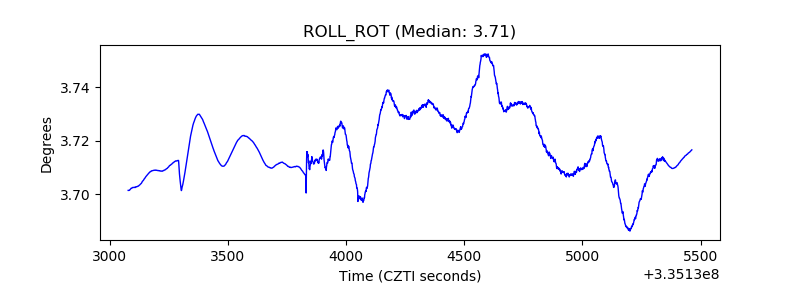 |
| _Roll_DEC | 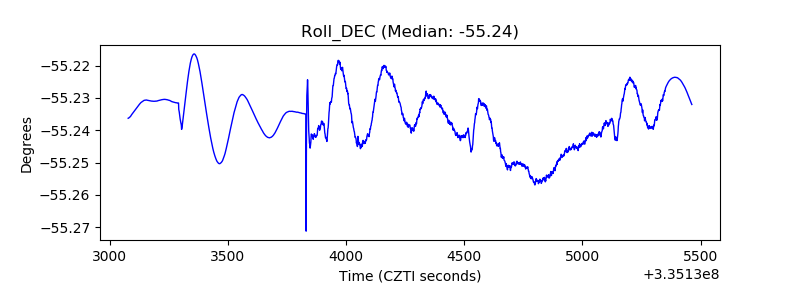 |
| _Roll_RA | 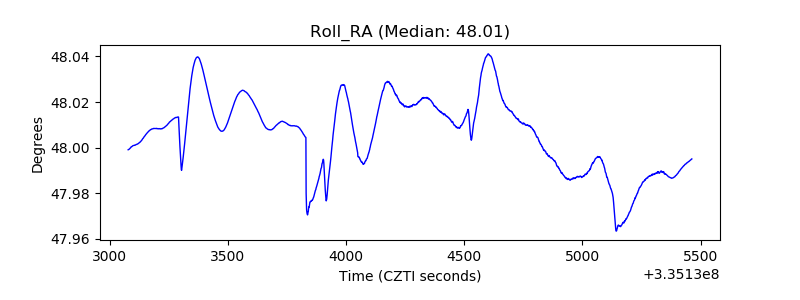 |
| Veto Counter | 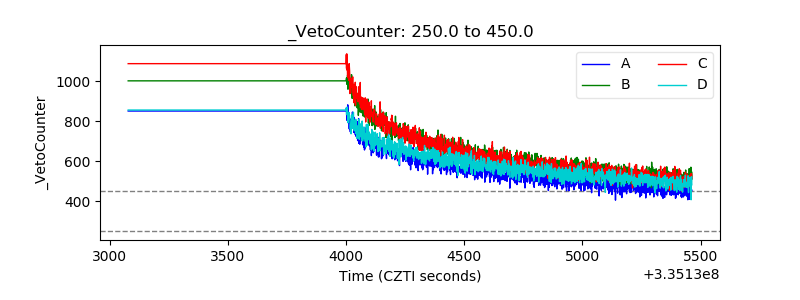 |