| Param | Original file | Final file |
|---|---|---|
| Filename | modeM0/AS1A09_044T02_9000003814cztM0_level2.fits | modeM0/AS1A09_044T02_9000003814cztM0_level2_quad_clean.evt |
| Size (bytes) | 319,944,960 | 233,009,280 |
| Size | 305.1 MB | 222.2 MB |
| Events in quadrant A | 1,989,562 | 1,294,625 |
| Events in quadrant B | 1,933,660 | 1,311,325 |
| Events in quadrant C | 1,917,698 | 1,196,606 |
| Events in quadrant D | 1,654,802 | 1,059,226 |
| Mode M0 | |||
|---|---|---|---|
| Quadrant | BADHDUFLAG | Total packets | Discarded packets |
| A | 0 | 68663 | 0 |
| B | 0 | 68497 | 0 |
| C | 0 | 74879 | 0 |
| D | 0 | 89412 | 0 |
| Mode SS | |||
|---|---|---|---|
| Quadrant | BADHDUFLAG | Total packets | Discarded packets |
| A | 0 | 650 | 0 |
| B | 0 | 650 | 0 |
| C | 0 | 650 | 0 |
| D | 0 | 650 | 0 |
| Mode M9 | |||
|---|---|---|---|
| Quadrant | BADHDUFLAG | Total packets | Discarded packets |
| A | 0 | 45 | 0 |
| B | 0 | 45 | 0 |
| C | 0 | 45 | 0 |
| D | 0 | 45 | 0 |
| Quadrant | Total seconds | Saturated seconds | Saturation percentage |
|---|---|---|---|
| A | 31916 | 633 | 1.983331% |
| B | 31916 | 574 | 1.798471% |
| C | 31916 | 1109 | 3.474746% |
| D | 31916 | 1761 | 5.517609% |
Noise dominated data is calculated using 1-second bins in cleaned event files. If a bin has >2000 counts, and if more than 50% of those come from <1% of pixels, then it is considered to be noise-dominated and hence unusable.
| Quadrant | # 1 sec bins | Bins with >0 counts | Bins with >2000 counts | High rate bins dominated by noise | Noise dominated (total time) | Noise dominated (detector-on time) | Marked lightcurve |
|---|---|---|---|---|---|---|---|
| A | 36356 | 31914 | 0 | 0 | 0.00% | 0.00% |  |
| B | 36356 | 31916 | 0 | 0 | 0.00% | 0.00% | 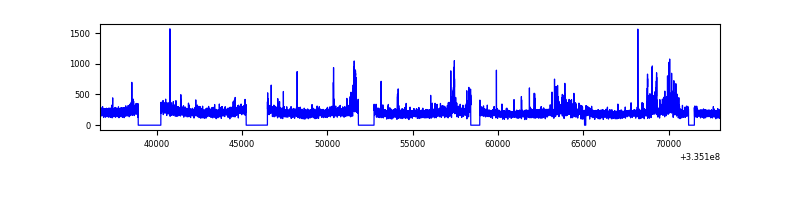 |
| C | 36356 | 31913 | 0 | 0 | 0.00% | 0.00% | 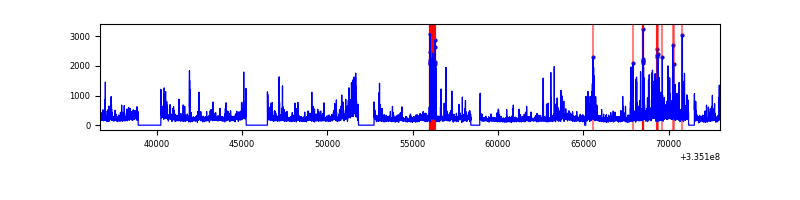 |
| D | 36356 | 31867 | 0 | 0 | 0.00% | 0.00% | 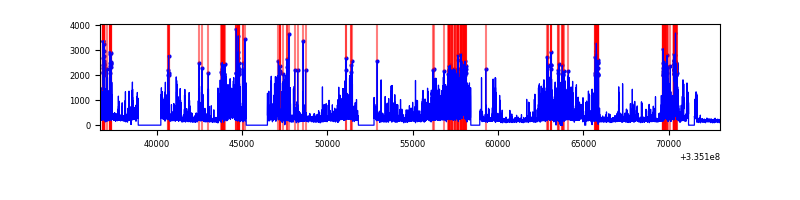 |
Top three noisy pixels from each quadrant. If the there are fewer than three noisy pixels in the level2.evt file, extra rows are filled as -1
| Pixel properties | Quadrant properties | ||||||
|---|---|---|---|---|---|---|---|
| Quadrant | DetID | PixID | Counts | Sigma | Mean | Median | Sigma |
| A | 0 | 29 | 1676 | 9.22 | 517 | 485 | 129.2 |
| A | 7 | 110 | 1589 | 8.55 | 517 | 485 | 129.2 |
| A | 9 | 19 | 1525 | 8.05 | 517 | 485 | 129.2 |
| B | 2 | 9 | 1500 | 9.82 | 509 | 485 | 103.3 |
| B | 5 | 255 | 1304 | 7.92 | 509 | 485 | 103.3 |
| B | 5 | 232 | 1283 | 7.72 | 509 | 485 | 103.3 |
| C | 1 | 81 | 1483 | 7.8 | 505 | 472 | 129.6 |
| C | 1 | 80 | 1429 | 7.38 | 505 | 472 | 129.6 |
| C | 12 | 241 | 1347 | 6.75 | 505 | 472 | 129.6 |
| D | 3 | 14 | 1241 | 6.37 | 471 | 430 | 127.4 |
| D | 15 | 46 | 1172 | 5.83 | 471 | 430 | 127.4 |
| D | 6 | 67 | 1143 | 5.6 | 471 | 430 | 127.4 |
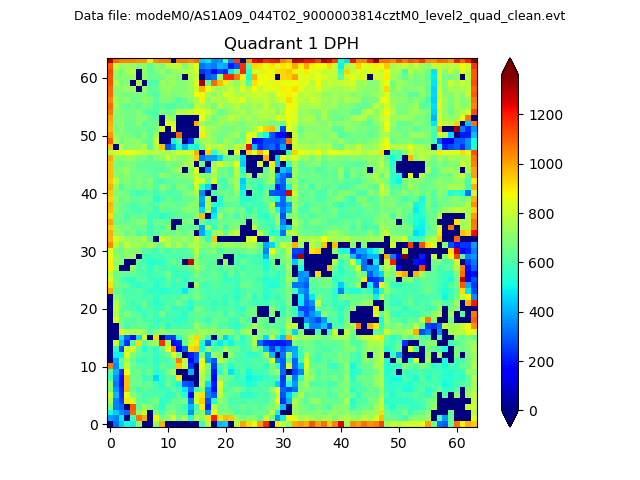
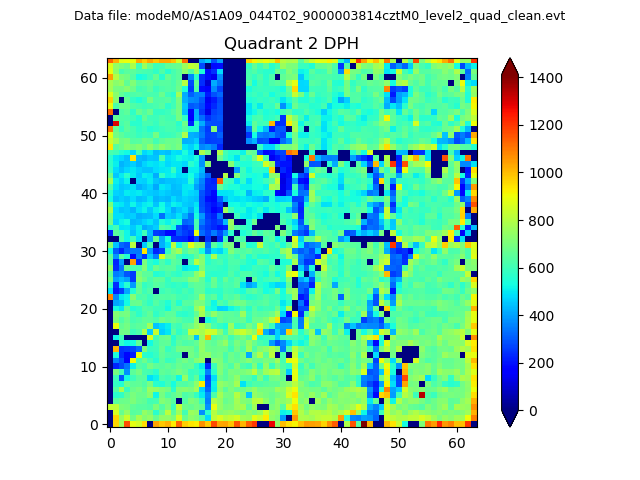
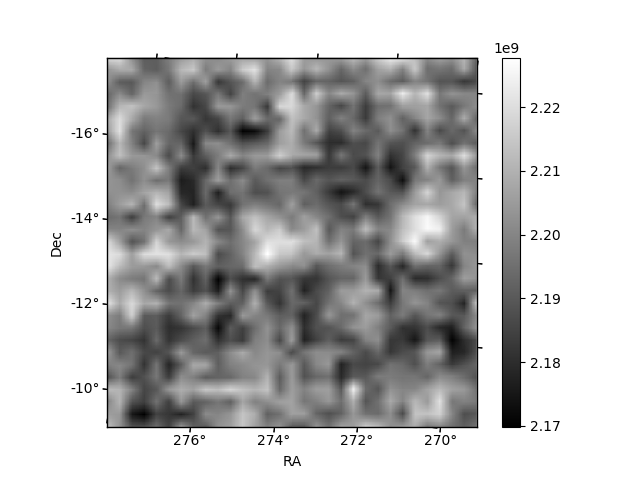
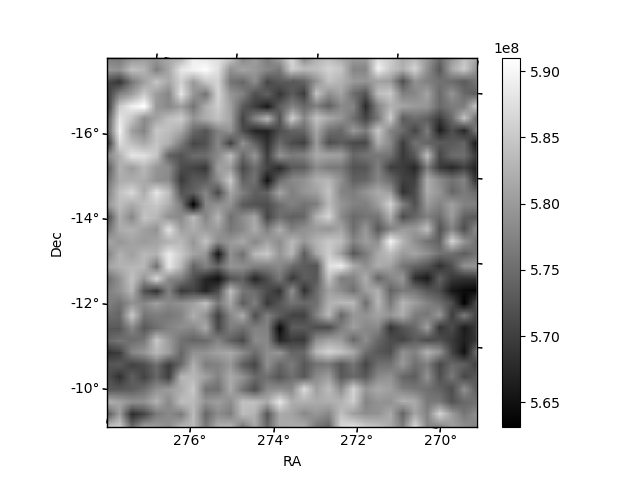
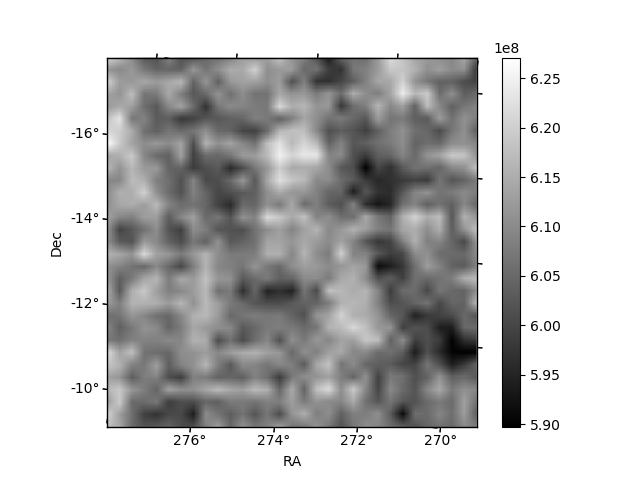
Histogram calculated using DETX and DETY for each event in the final _common_clean file
| Quadrant A | 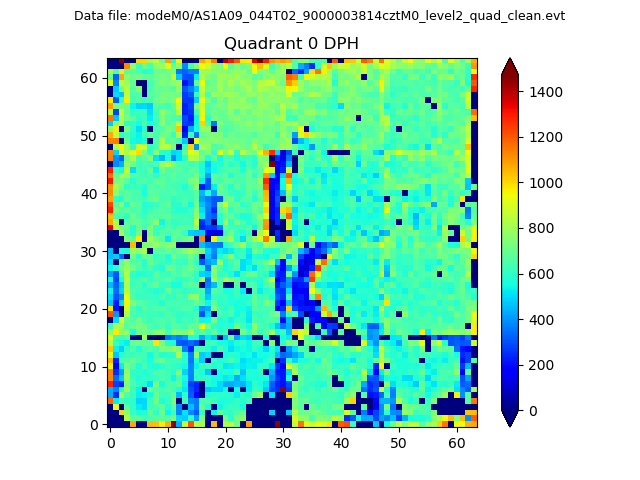 |
 |
Quadrant B |
|---|---|---|---|
| Quadrant D | 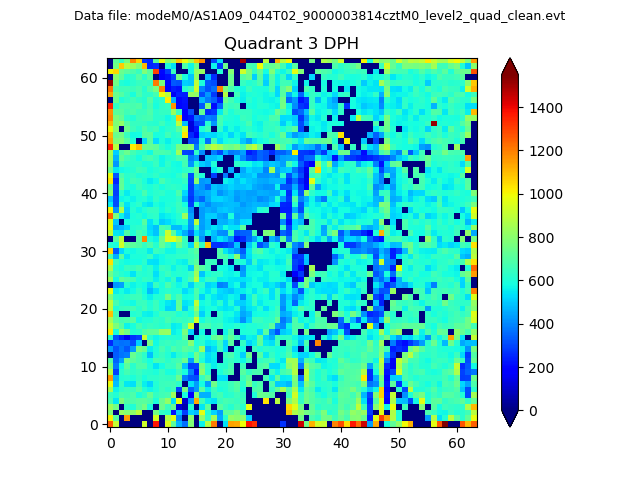 |
 |
Quadrant C |
| Plot type | Count rate plots | Images |
|---|---|---|
| Comparison with Poisson distribution Blue bars denote a histogram of data divided into 1 sec bins. Red curve is a Poisson curve with rate = median count rate of data. |
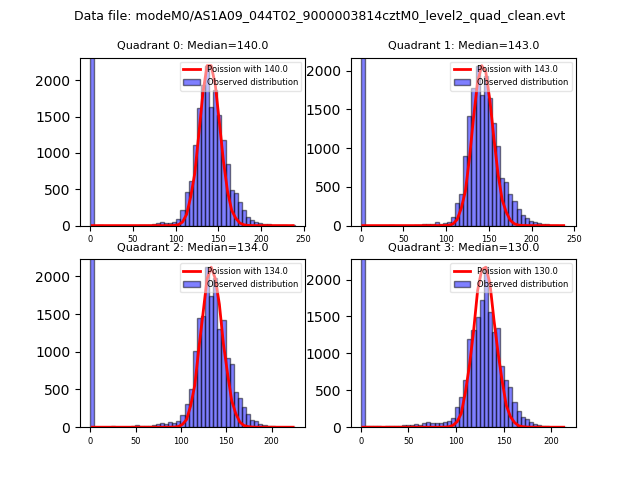 |
 |
| Quadrant-wise count rates Data is divided into 100 sec bins |
 |
|
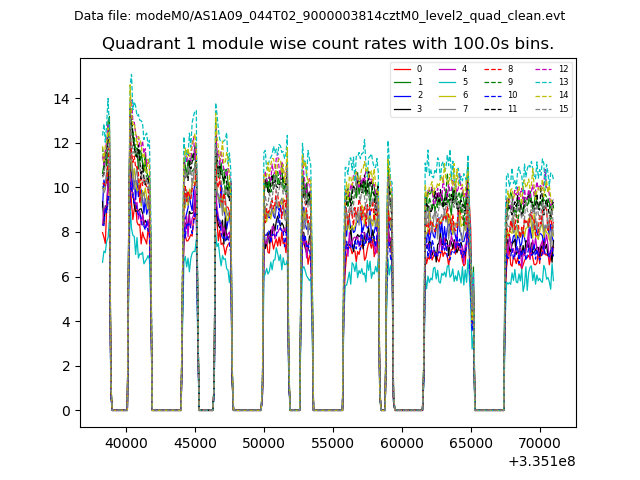
| Module-wise count rates for Quadrant A Data is divided into 100 sec bins |
 |
 |
| Module-wise count rates for Quadrant B Data is divided into 100 sec bins |
 |
 |
| Module-wise count rates for Quadrant C Data is divided into 100 sec bins |
 |
 |
| Module-wise count rates for Quadrant D Data is divided into 100 sec bins |
 |
 |
| Parameter | Plot |
|---|---|
| CZT HV Monitor | 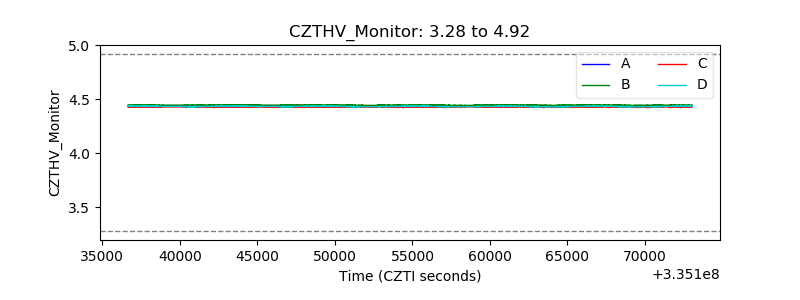 |
| D_VDD | 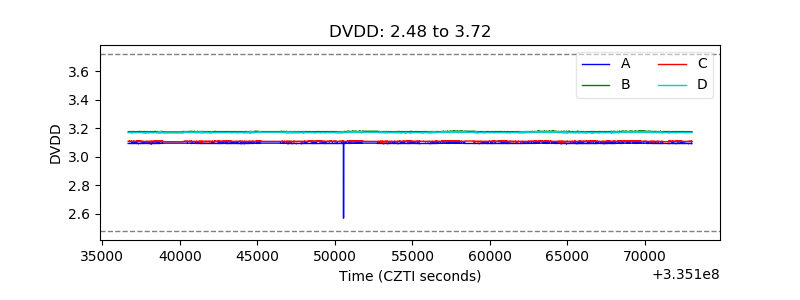 |
| Temperature 1 |  |
| Veto HV Monitor | 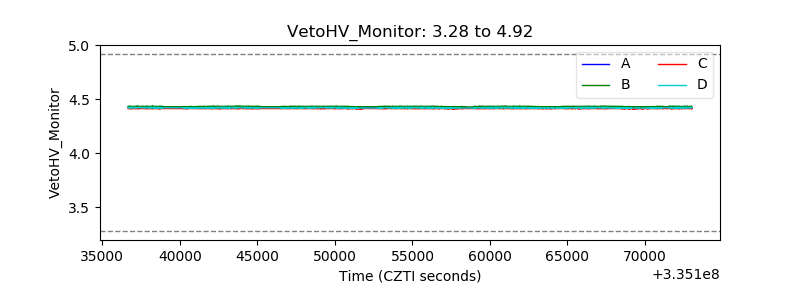 |
| Veto LLD | 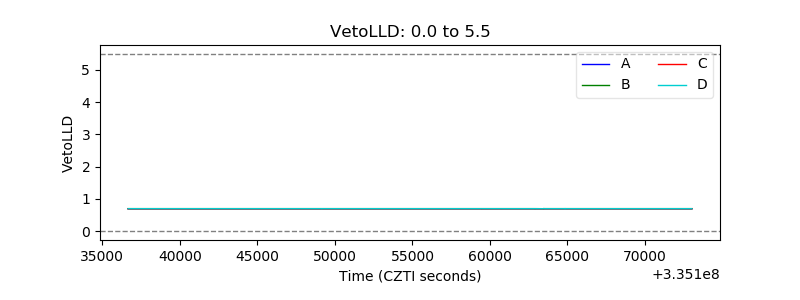 |
| Alpha Counter | 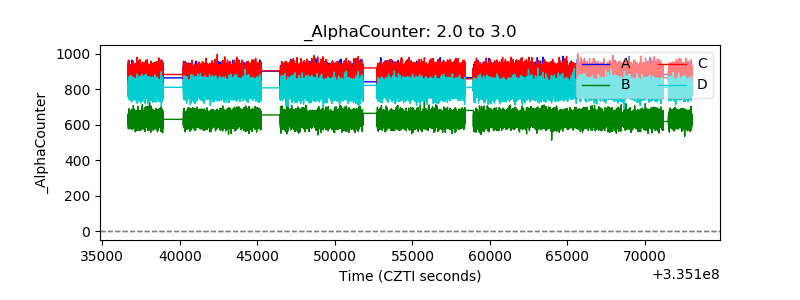 |
| _CPM_Rate | 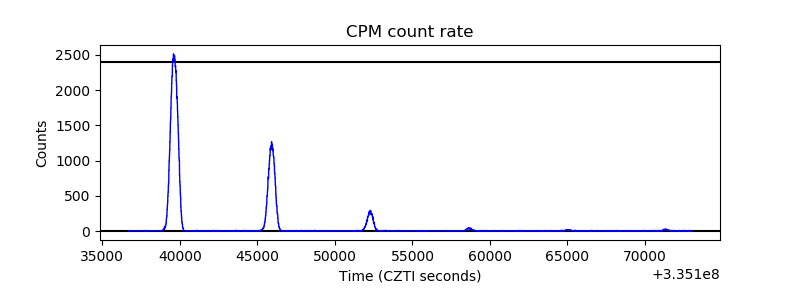 |
| CZT Counter |  |
| +2.5 Volts monitor |  |
| +5 Volts monitor |  |
| _ROLL_ROT | 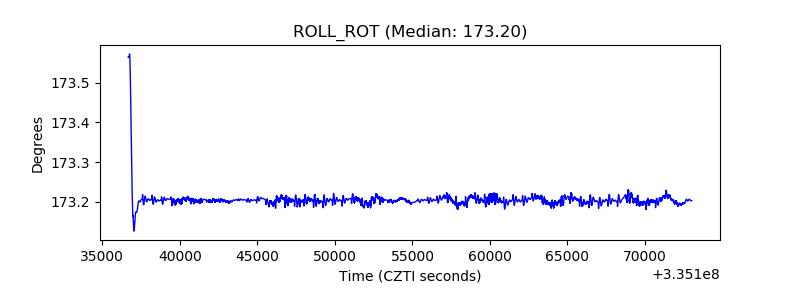 |
| _Roll_DEC |  |
| _Roll_RA | 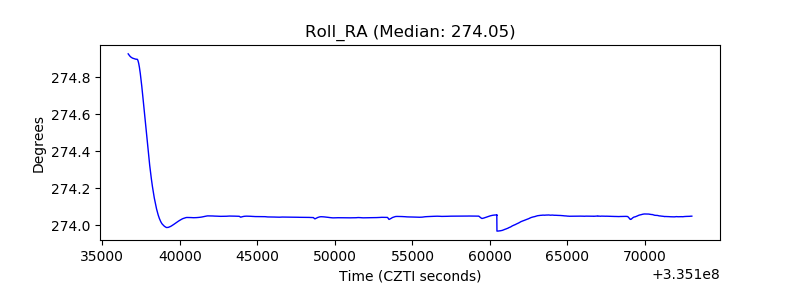 |
| Veto Counter |  |