| Param | Original file | Final file |
|---|---|---|
| Filename | modeM0/AS1A09_044T02_9000003814_26388cztM0_level2.evt | modeM0/AS1A09_044T02_9000003814_26388cztM0_level2_quad_clean.evt |
| Size (bytes) | 302,981,760 | 49,083,840 |
| Size | 288.9 MB | 46.8 MB |
| Events in quadrant A | 2,186,549 | 314,789 |
| Events in quadrant B | 1,970,911 | 328,404 |
| Events in quadrant C | 2,137,521 | 302,182 |
| Events in quadrant D | 2,637,283 | 288,043 |
| Mode M0 | |||
|---|---|---|---|
| Quadrant | BADHDUFLAG | Total packets | Discarded packets |
| A | 0 | 8609 | 0 |
| B | 0 | 7912 | 0 |
| C | 0 | 8527 | 0 |
| D | 0 | 10131 | 0 |
| Mode M9 | |||
|---|---|---|---|
| Quadrant | BADHDUFLAG | Total packets | Discarded packets |
| A | 0 | 13 | 0 |
| B | 0 | 13 | 0 |
| C | 0 | 13 | 0 |
| D | 0 | 13 | 0 |
| Quadrant | Total seconds | Saturated seconds | Saturation percentage |
|---|---|---|---|
| A | 3565 | 153 | 4.291725% |
| B | 3565 | 75 | 2.103787% |
| C | 3565 | 100 | 2.805049% |
| D | 3565 | 201 | 5.638149% |
Noise dominated data is calculated using 1-second bins in cleaned event files. If a bin has >2000 counts, and if more than 50% of those come from <1% of pixels, then it is considered to be noise-dominated and hence unusable.
| Quadrant | # 1 sec bins | Bins with >0 counts | Bins with >2000 counts | High rate bins dominated by noise | Noise dominated (total time) | Noise dominated (detector-on time) | Marked lightcurve |
|---|---|---|---|---|---|---|---|
| A | 4895 | 3566 | 87 | 87 | 1.78% | 2.44% | 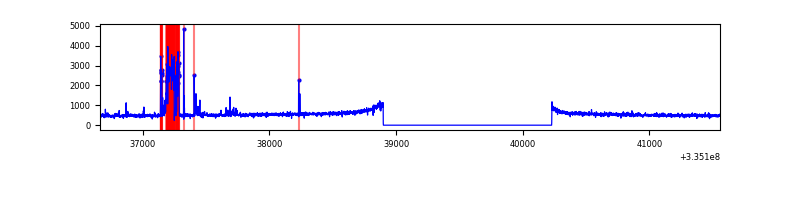 |
| B | 4895 | 3566 | 1 | 1 | 0.02% | 0.03% | 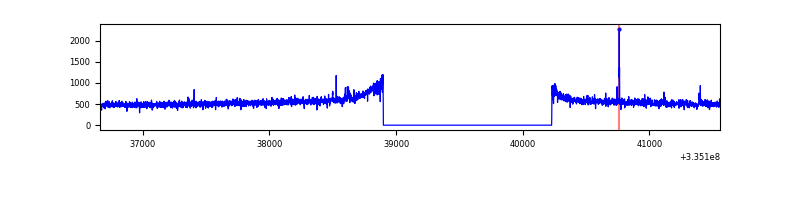 |
| C | 4895 | 3566 | 1 | 1 | 0.02% | 0.03% | 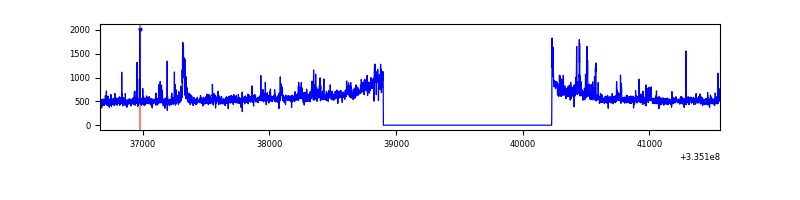 |
| D | 4895 | 3566 | 128 | 128 | 2.61% | 3.59% | 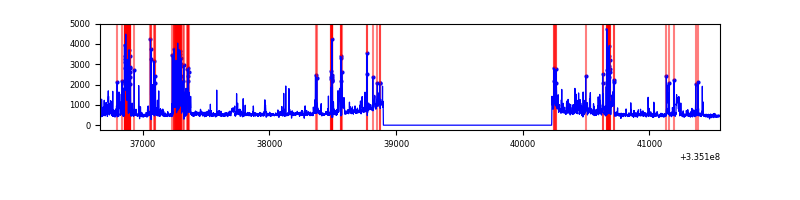 |
Top three noisy pixels from each quadrant. If the there are fewer than three noisy pixels in the level2.evt file, extra rows are filled as -1
| Pixel properties | Quadrant properties | ||||||
|---|---|---|---|---|---|---|---|
| Quadrant | DetID | PixID | Counts | Sigma | Mean | Median | Sigma |
| A | 0 | 13 | 294711 | 2961.9 | 491 | 483 | 99.3 |
| A | 13 | 254 | 5868 | 54.21 | 491 | 483 | 99.3 |
| A | 3 | 137 | 4471 | 40.15 | 491 | 483 | 99.3 |
| B | 0 | 230 | 12729 | 127.09 | 499 | 487 | 96.3 |
| B | 12 | 111 | 11425 | 113.55 | 499 | 487 | 96.3 |
| B | 11 | 111 | 10053 | 99.31 | 499 | 487 | 96.3 |
| C | 3 | 233 | 170951 | 1531.64 | 474 | 480 | 111.3 |
| C | 14 | 238 | 75881 | 677.46 | 474 | 480 | 111.3 |
| C | 2 | 16 | 38809 | 344.38 | 474 | 480 | 111.3 |
| D | 1 | 52 | 611383 | 5382.79 | 467 | 455 | 113.5 |
| D | 7 | 80 | 220289 | 1936.92 | 467 | 455 | 113.5 |
| D | 12 | 233 | 44752 | 390.29 | 467 | 455 | 113.5 |
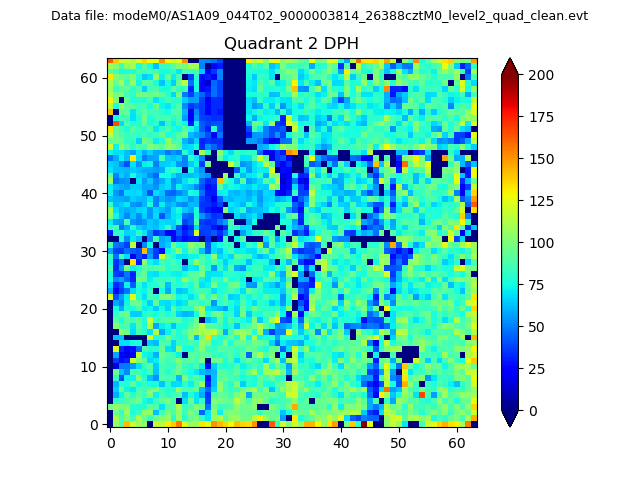
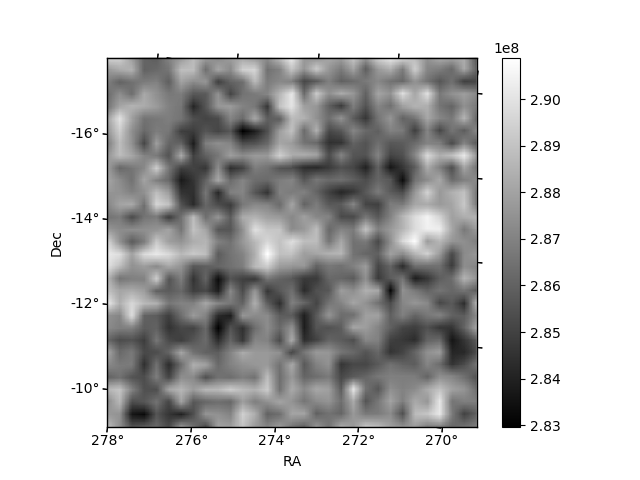
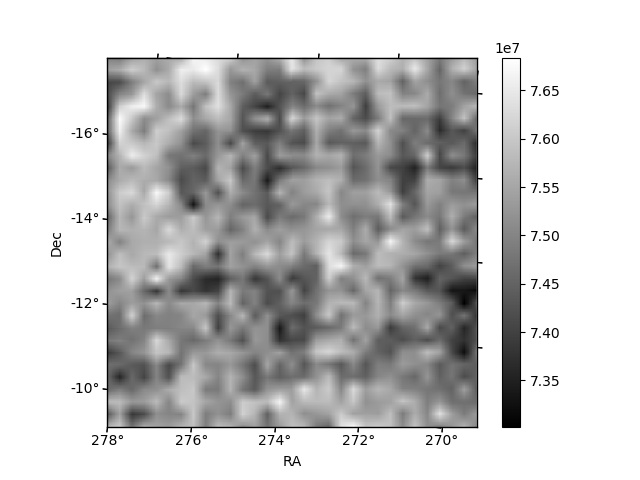
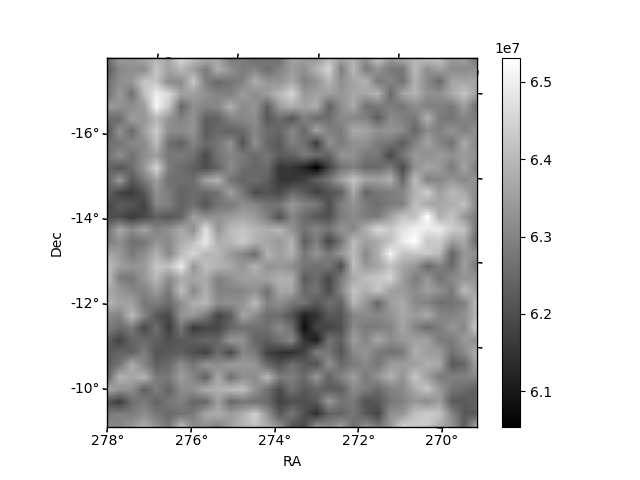
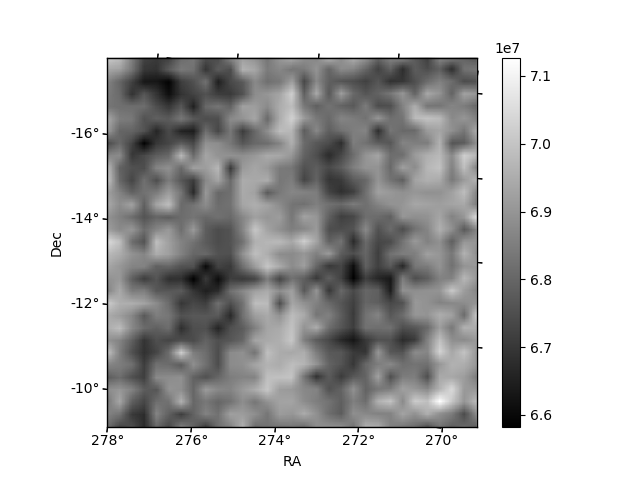
Histogram calculated using DETX and DETY for each event in the final _common_clean file
| Quadrant A | 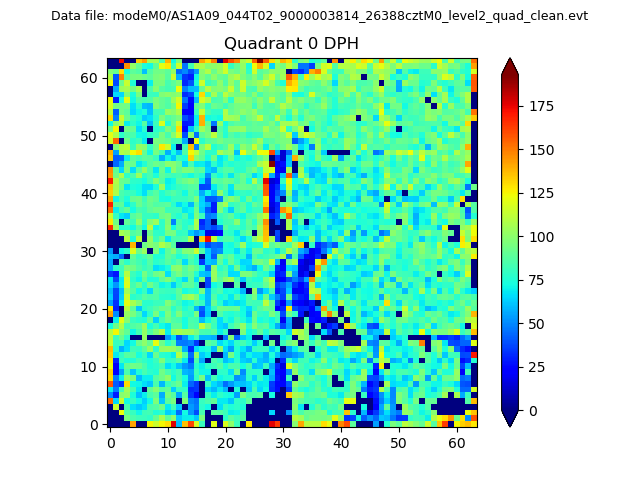 |
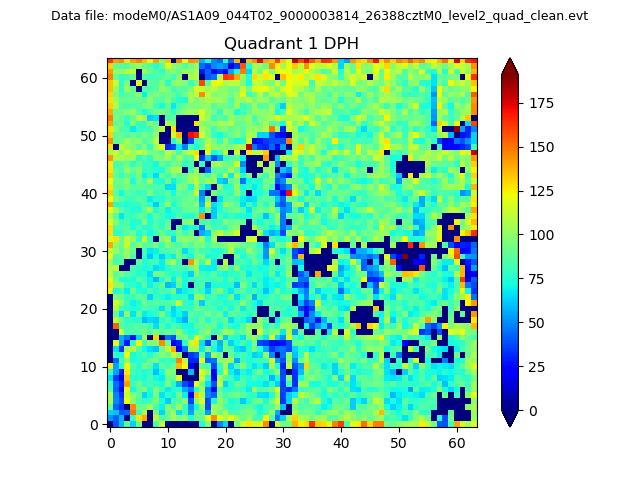 |
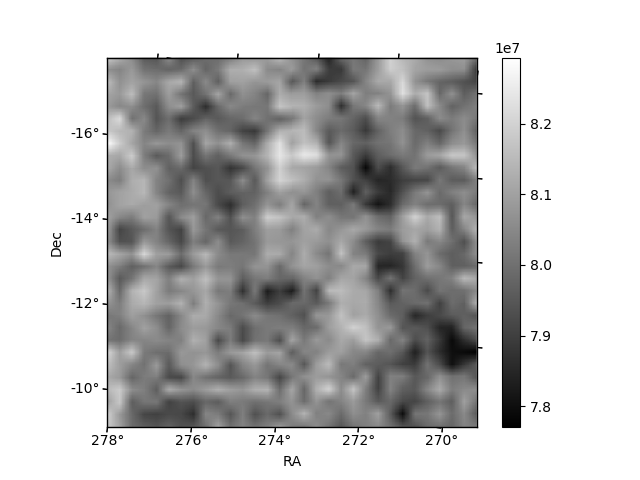
Quadrant B |
|---|---|---|---|
| Quadrant D | 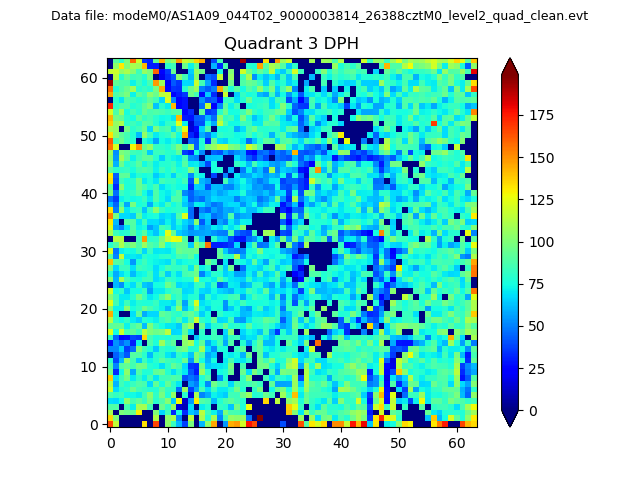 |
 |
Quadrant C |
| Plot type | Count rate plots | Images |
|---|---|---|
| Comparison with Poisson distribution Blue bars denote a histogram of data divided into 1 sec bins. Red curve is a Poisson curve with rate = median count rate of data. |
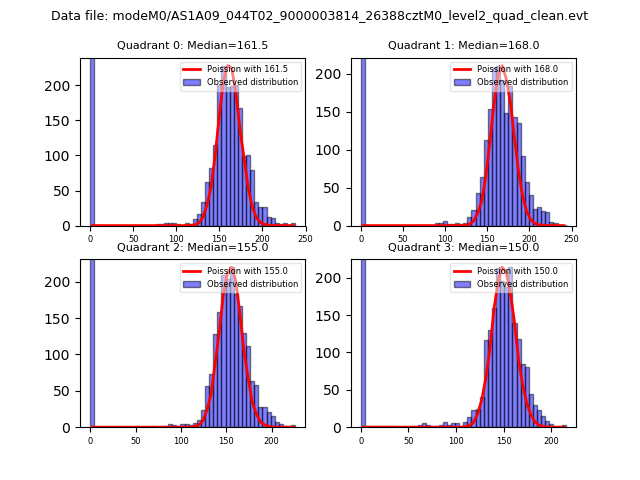 |
 |
| Quadrant-wise count rates Data is divided into 100 sec bins |
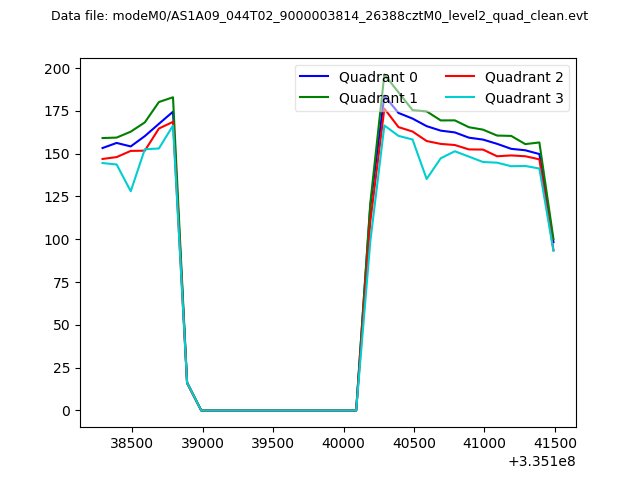 |
|
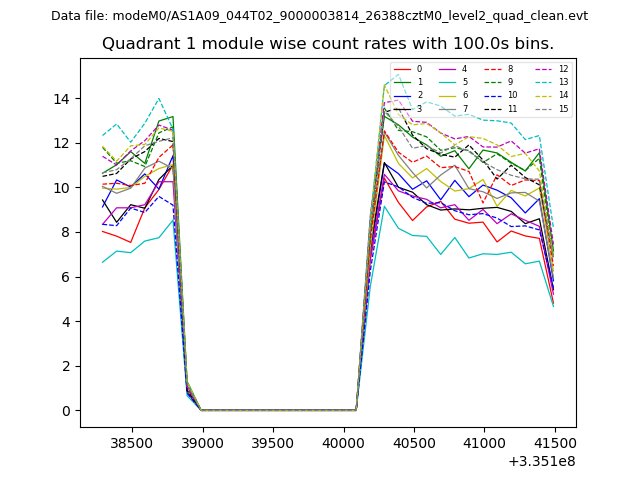
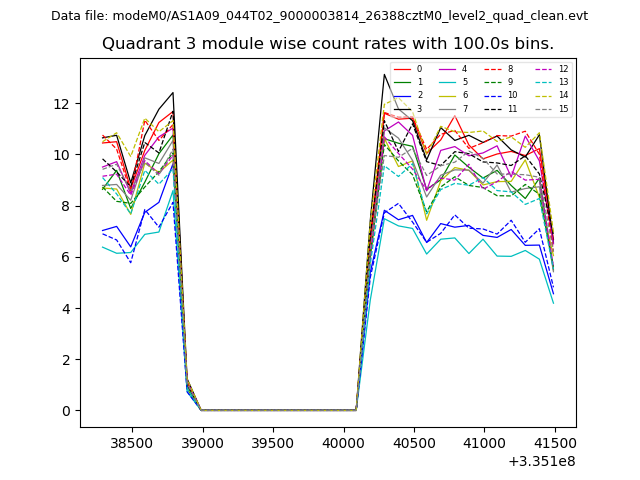
| Module-wise count rates for Quadrant A Data is divided into 100 sec bins |
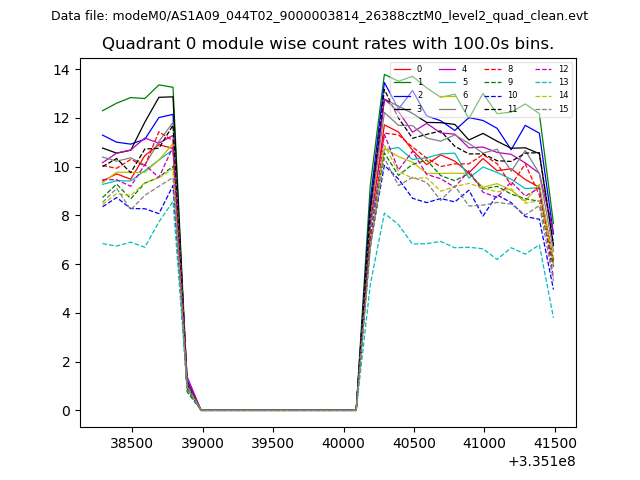 |
 |
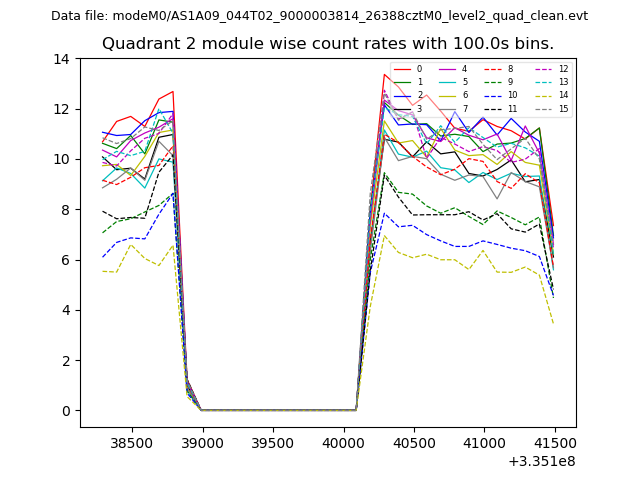
| Module-wise count rates for Quadrant B Data is divided into 100 sec bins |
 |
 |
| Module-wise count rates for Quadrant C Data is divided into 100 sec bins |
 |
 |
| Module-wise count rates for Quadrant D Data is divided into 100 sec bins |
 |
 |
| Parameter | Plot |
|---|---|
| CZT HV Monitor | 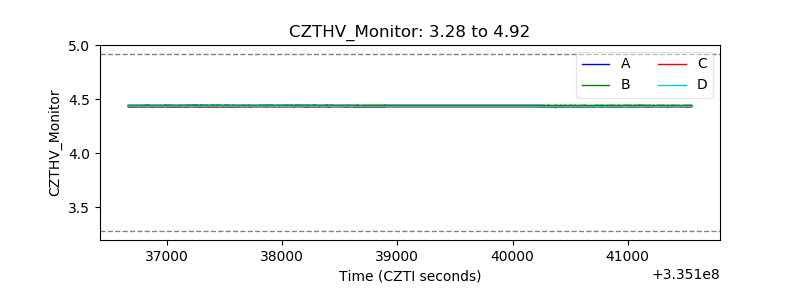 |
| D_VDD | 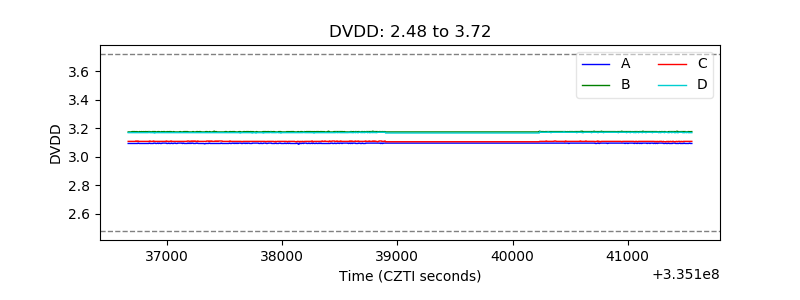 |
| Temperature 1 | 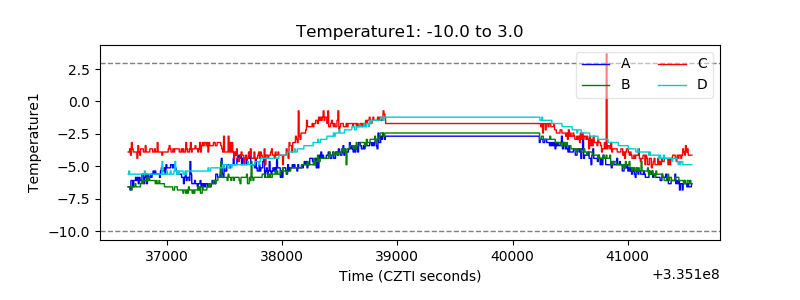 |
| Veto HV Monitor |  |
| Veto LLD | 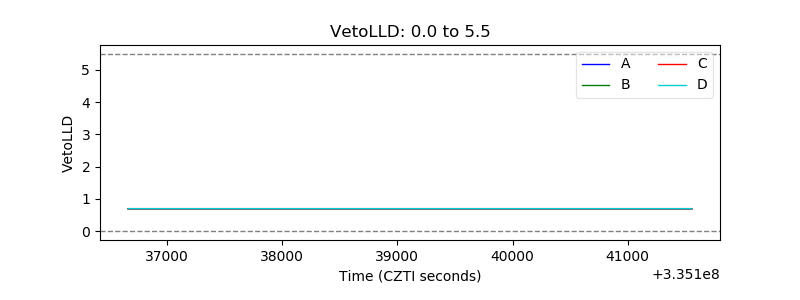 |
| Alpha Counter | 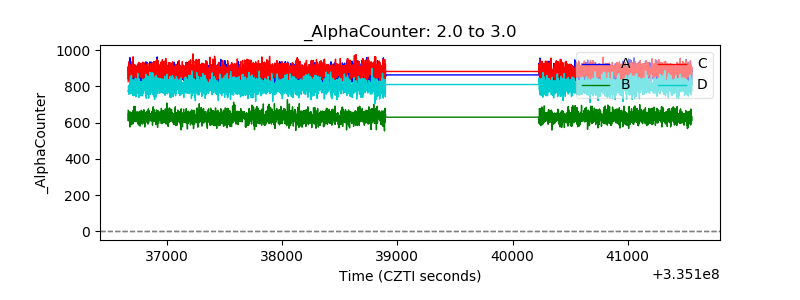 |
| _CPM_Rate |  |
| CZT Counter | 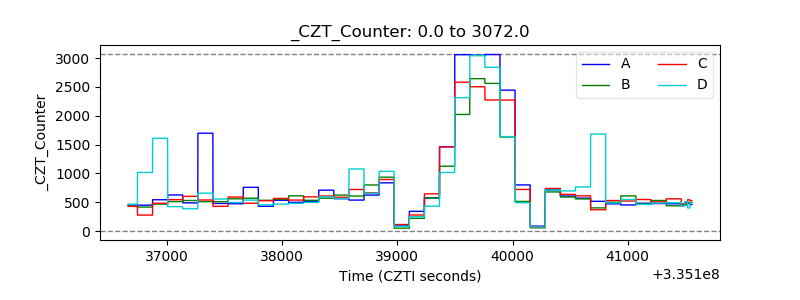 |
| +2.5 Volts monitor |  |
| +5 Volts monitor |  |
| _ROLL_ROT | 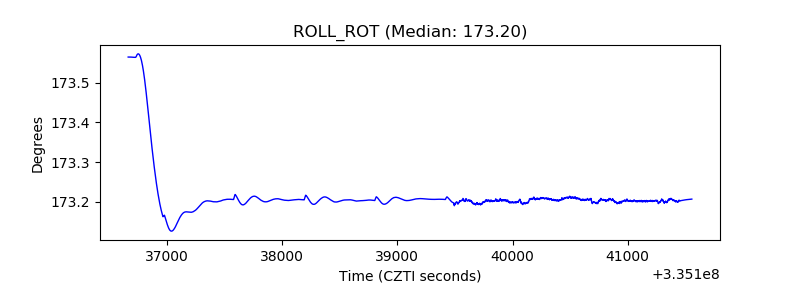 |
| _Roll_DEC |  |
| _Roll_RA | 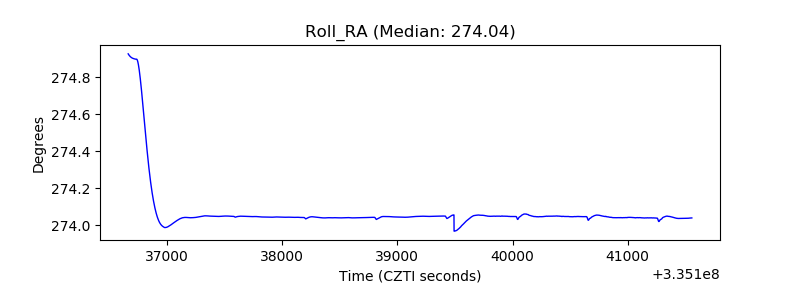 |
| Veto Counter | 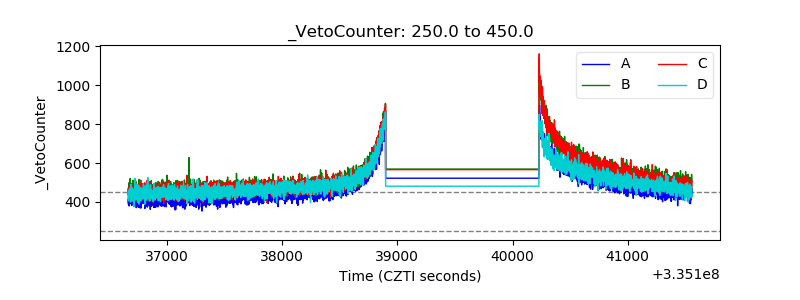 |