| Param | Original file | Final file |
|---|---|---|
| Filename | modeM0/AS1A09_044T02_9000003814_26389cztM0_level2.evt | modeM0/AS1A09_044T02_9000003814_26389cztM0_level2_quad_clean.evt |
| Size (bytes) | 502,136,640 | 93,441,600 |
| Size | 478.9 MB | 89.1 MB |
| Events in quadrant A | 3,211,800 | 612,080 |
| Events in quadrant B | 3,281,543 | 635,648 |
| Events in quadrant C | 3,553,186 | 585,565 |
| Events in quadrant D | 4,732,250 | 555,588 |
| Mode M0 | |||
|---|---|---|---|
| Quadrant | BADHDUFLAG | Total packets | Discarded packets |
| A | 0 | 13423 | 0 |
| B | 0 | 13506 | 0 |
| C | 0 | 14382 | 0 |
| D | 0 | 18420 | 0 |
| Mode M9 | |||
|---|---|---|---|
| Quadrant | BADHDUFLAG | Total packets | Discarded packets |
| A | 0 | 22 | 0 |
| B | 0 | 23 | 0 |
| C | 0 | 23 | 0 |
| D | 0 | 23 | 0 |
| Quadrant | Total seconds | Saturated seconds | Saturation percentage |
|---|---|---|---|
| A | 6317 | 24 | 0.379927% |
| B | 6317 | 41 | 0.649042% |
| C | 6317 | 112 | 1.772994% |
| D | 6317 | 380 | 6.015514% |
Noise dominated data is calculated using 1-second bins in cleaned event files. If a bin has >2000 counts, and if more than 50% of those come from <1% of pixels, then it is considered to be noise-dominated and hence unusable.
| Quadrant | # 1 sec bins | Bins with >0 counts | Bins with >2000 counts | High rate bins dominated by noise | Noise dominated (total time) | Noise dominated (detector-on time) | Marked lightcurve |
|---|---|---|---|---|---|---|---|
| A | 7567 | 6318 | 0 | 0 | 0.00% | 0.00% | 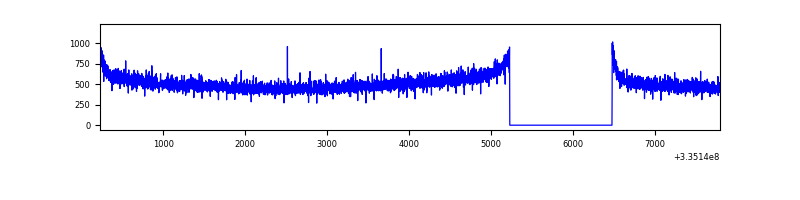 |
| B | 7567 | 6318 | 1 | 1 | 0.01% | 0.02% | 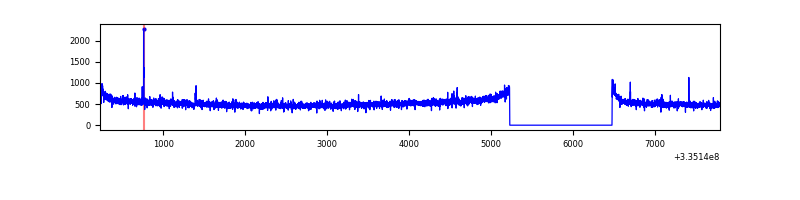 |
| C | 7567 | 6318 | 7 | 7 | 0.09% | 0.11% | 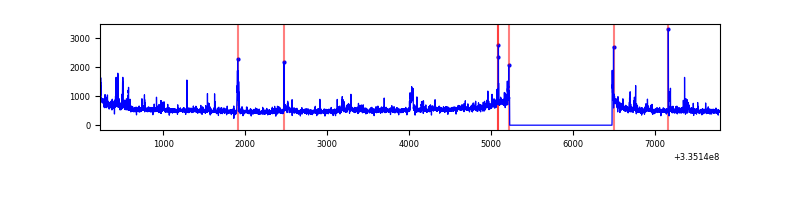 |
| D | 7567 | 6318 | 257 | 257 | 3.40% | 4.07% | 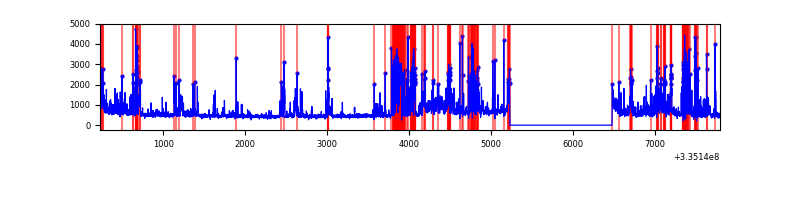 |
Top three noisy pixels from each quadrant. If the there are fewer than three noisy pixels in the level2.evt file, extra rows are filled as -1
| Pixel properties | Quadrant properties | ||||||
|---|---|---|---|---|---|---|---|
| Quadrant | DetID | PixID | Counts | Sigma | Mean | Median | Sigma |
| A | 13 | 254 | 11106 | 61.72 | 831 | 816 | 166.7 |
| A | 3 | 137 | 7489 | 40.02 | 831 | 816 | 166.7 |
| A | 0 | 226 | 7031 | 37.28 | 831 | 816 | 166.7 |
| B | 12 | 111 | 18743 | 112.11 | 835 | 814 | 159.9 |
| B | 11 | 111 | 16618 | 98.82 | 835 | 814 | 159.9 |
| B | 0 | 230 | 16563 | 98.48 | 835 | 814 | 159.9 |
| C | 3 | 233 | 283026 | 1522.55 | 790 | 797 | 185.4 |
| C | 14 | 238 | 128365 | 688.19 | 790 | 797 | 185.4 |
| C | 2 | 16 | 57914 | 308.13 | 790 | 797 | 185.4 |
| D | 7 | 80 | 1070010 | 5760.67 | 775 | 759 | 185.6 |
| D | 1 | 52 | 656349 | 3532.04 | 775 | 759 | 185.6 |
| D | 12 | 233 | 52016 | 276.15 | 775 | 759 | 185.6 |
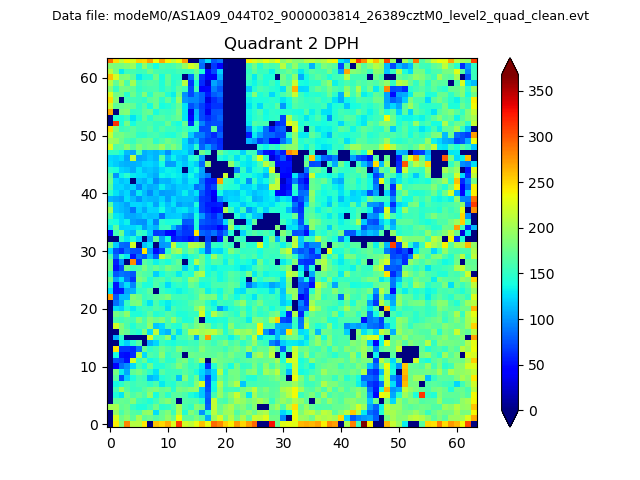
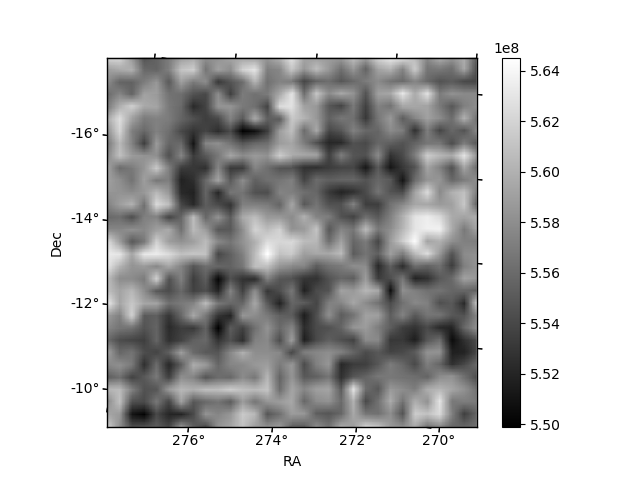
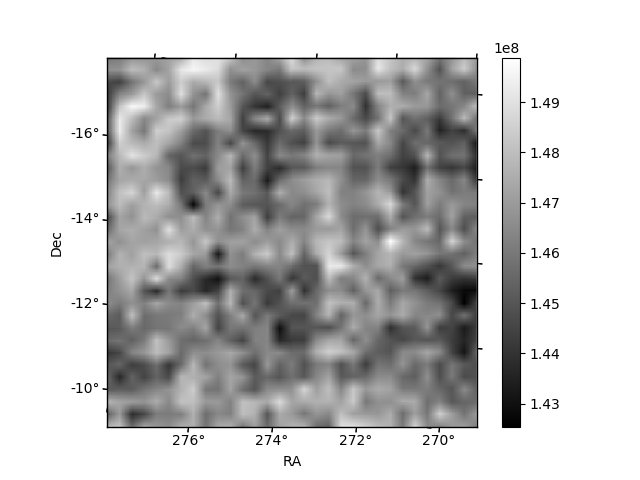
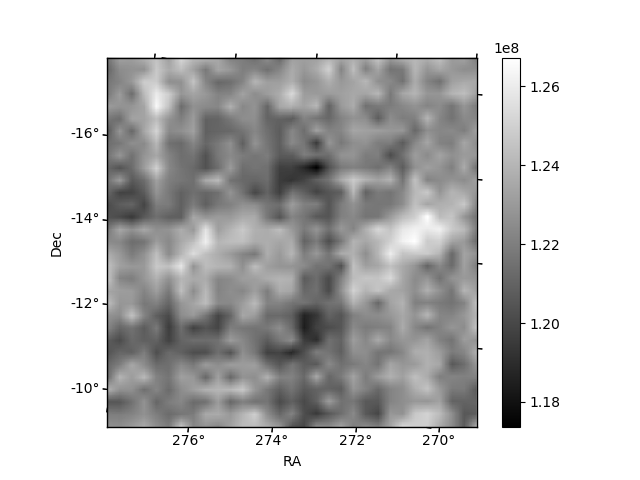
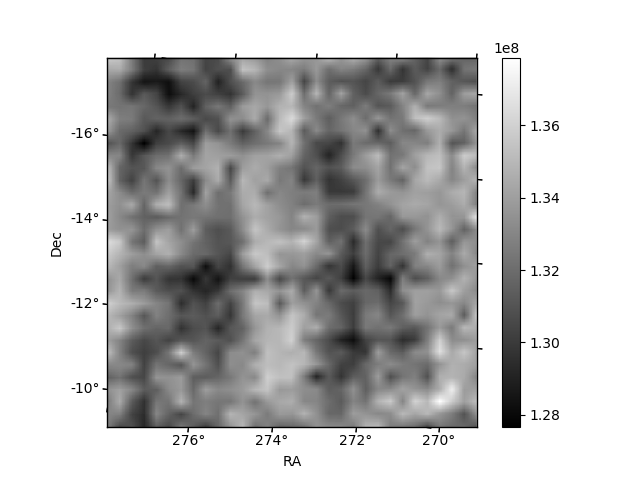
Histogram calculated using DETX and DETY for each event in the final _common_clean file
| Quadrant A | 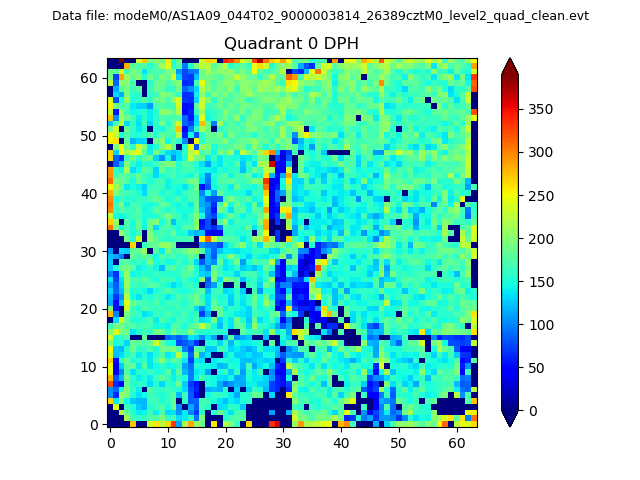 |
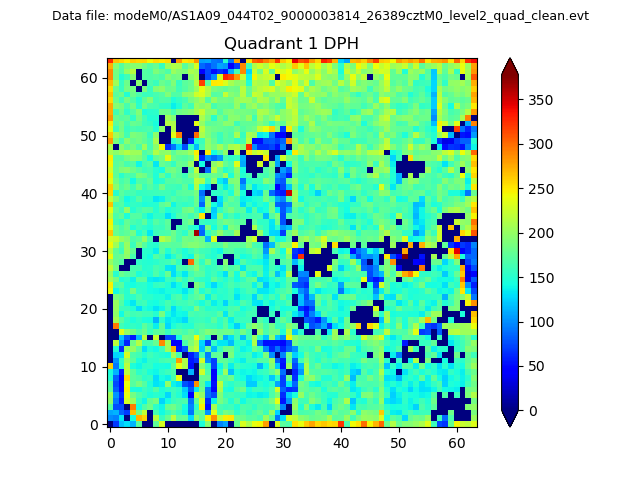 |
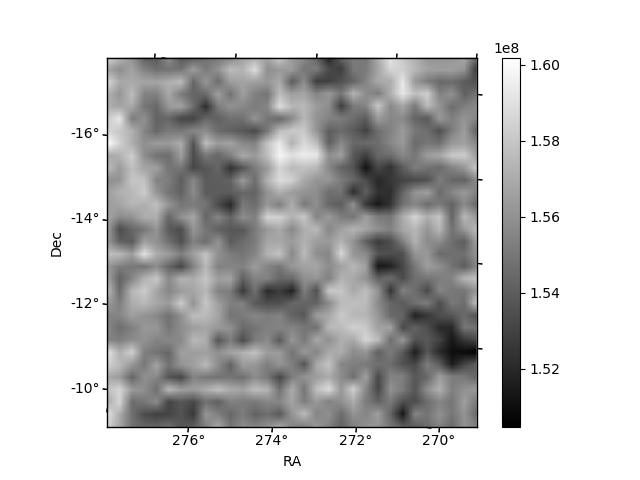
Quadrant B |
|---|---|---|---|
| Quadrant D | 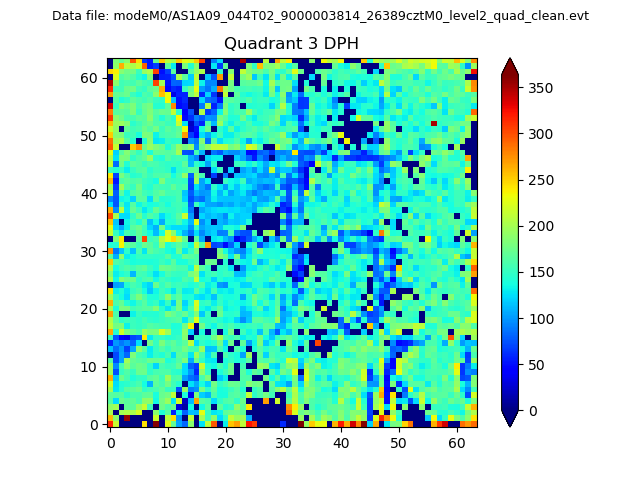 |
 |
Quadrant C |
| Plot type | Count rate plots | Images |
|---|---|---|
| Comparison with Poisson distribution Blue bars denote a histogram of data divided into 1 sec bins. Red curve is a Poisson curve with rate = median count rate of data. |
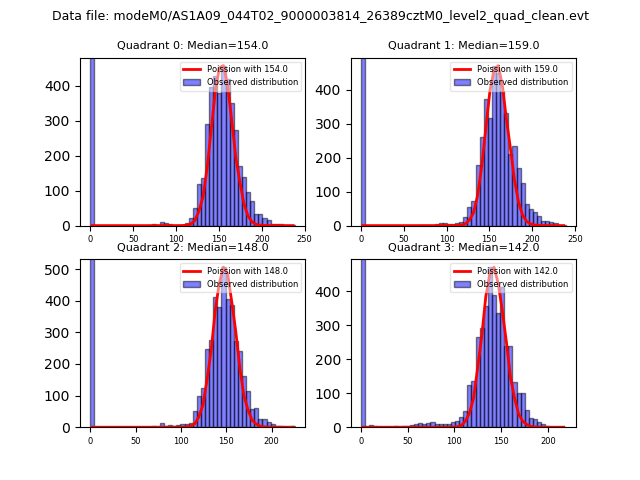 |
 |
| Quadrant-wise count rates Data is divided into 100 sec bins |
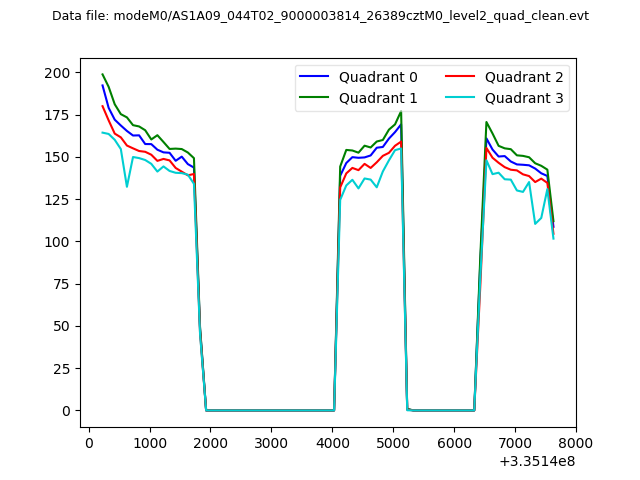 |
|
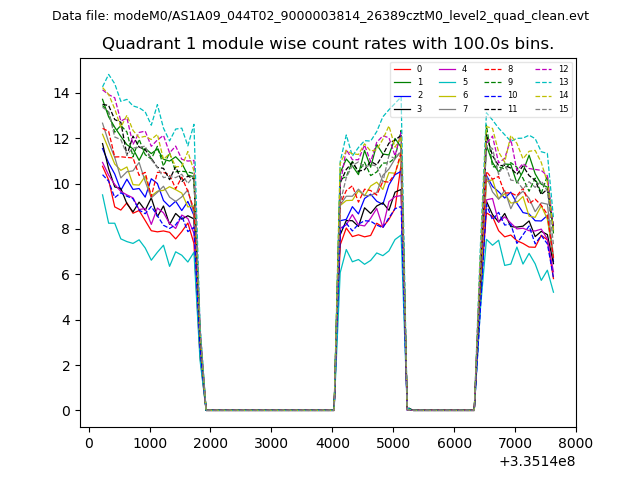
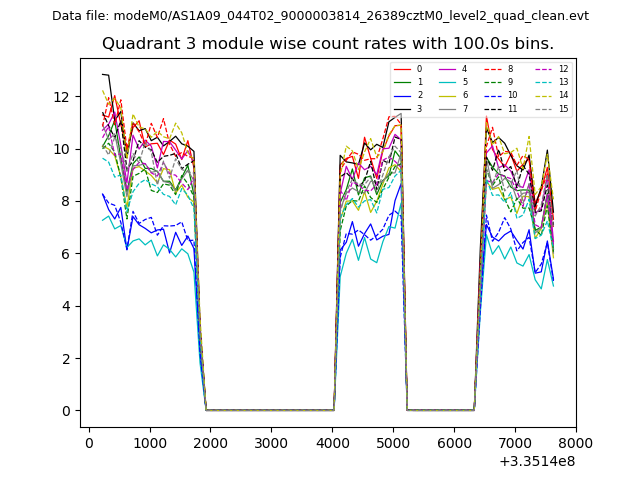
| Module-wise count rates for Quadrant A Data is divided into 100 sec bins |
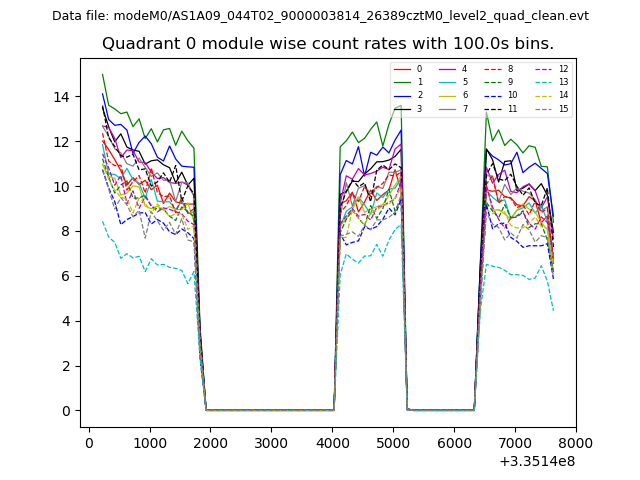 |
 |
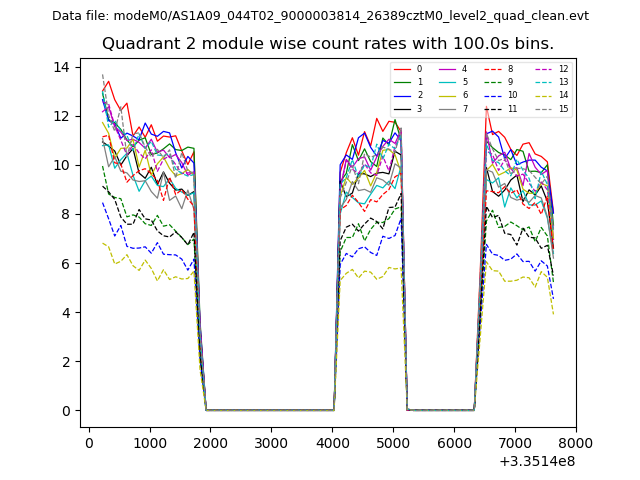
| Module-wise count rates for Quadrant B Data is divided into 100 sec bins |
 |
 |
| Module-wise count rates for Quadrant C Data is divided into 100 sec bins |
 |
 |
| Module-wise count rates for Quadrant D Data is divided into 100 sec bins |
 |
 |
| Parameter | Plot |
|---|---|
| CZT HV Monitor | 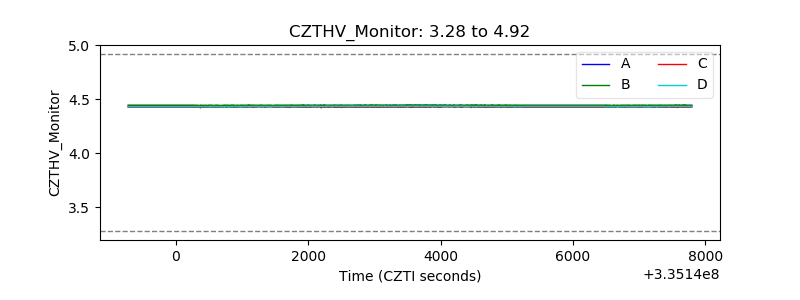 |
| D_VDD | 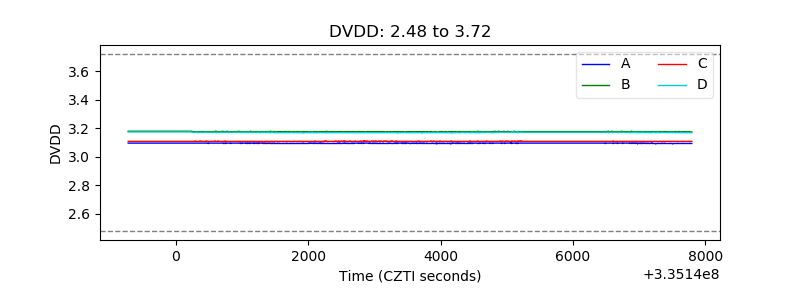 |
| Temperature 1 | 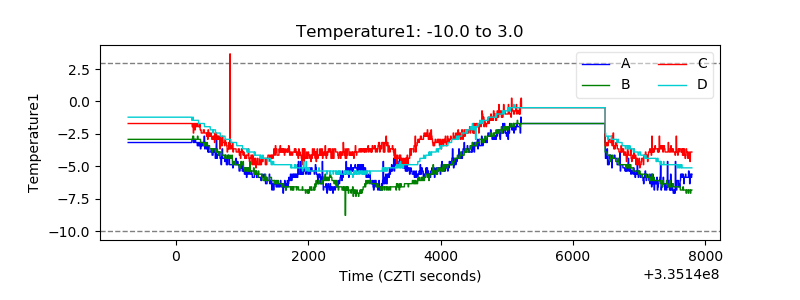 |
| Veto HV Monitor | 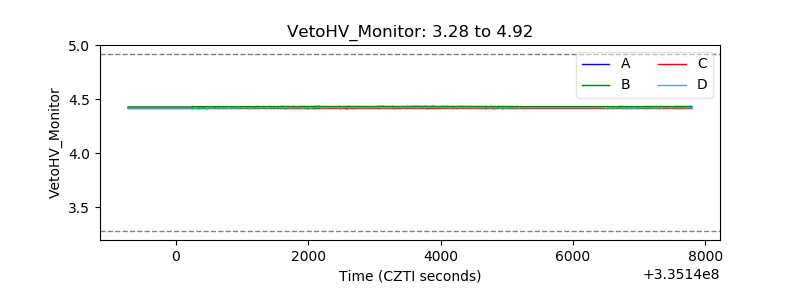 |
| Veto LLD | 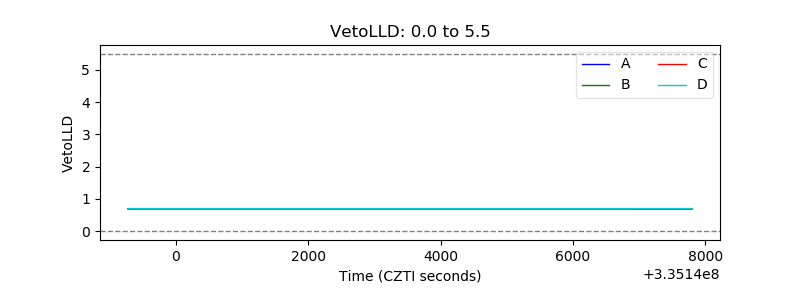 |
| Alpha Counter | 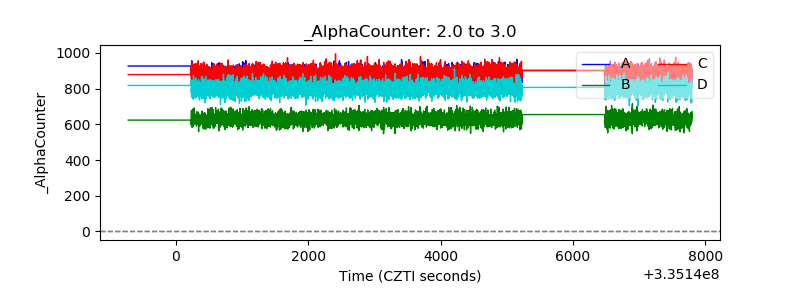 |
| _CPM_Rate | 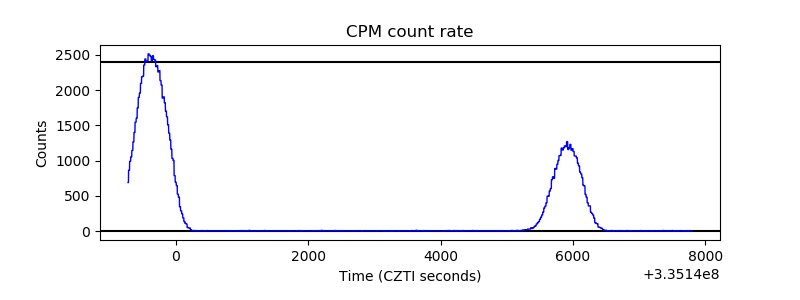 |
| CZT Counter | 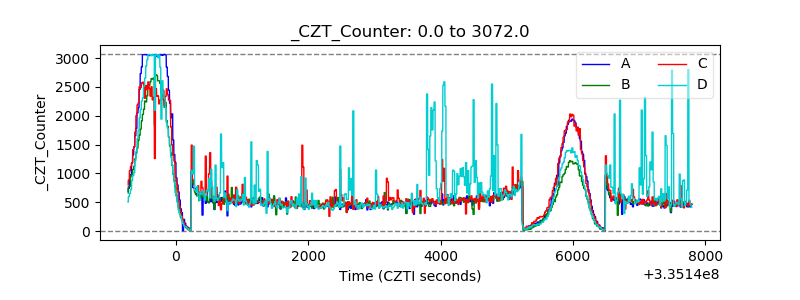 |
| +2.5 Volts monitor | 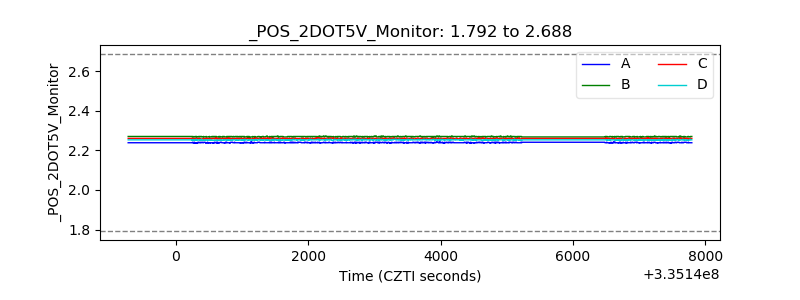 |
| +5 Volts monitor | 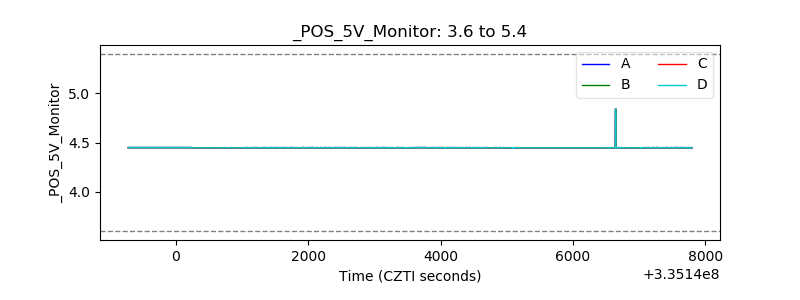 |
| _ROLL_ROT | 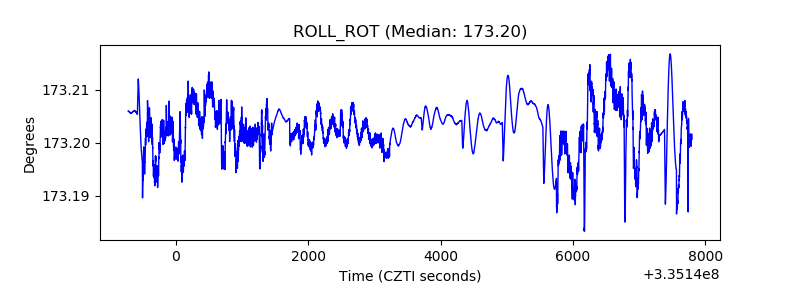 |
| _Roll_DEC | 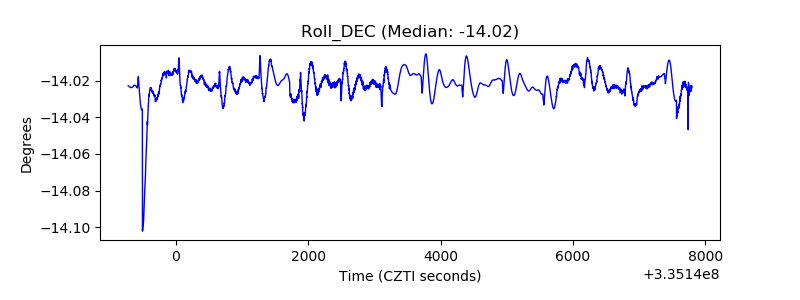 |
| _Roll_RA | 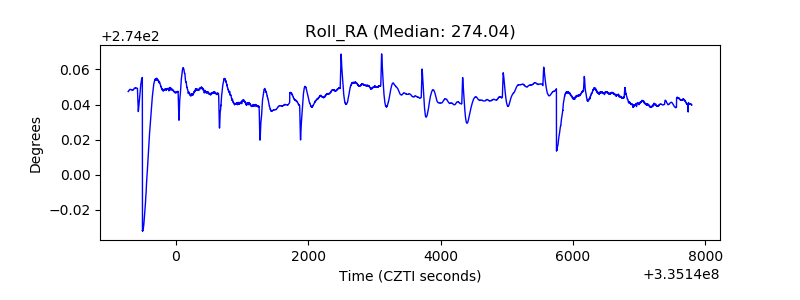 |
| Veto Counter | 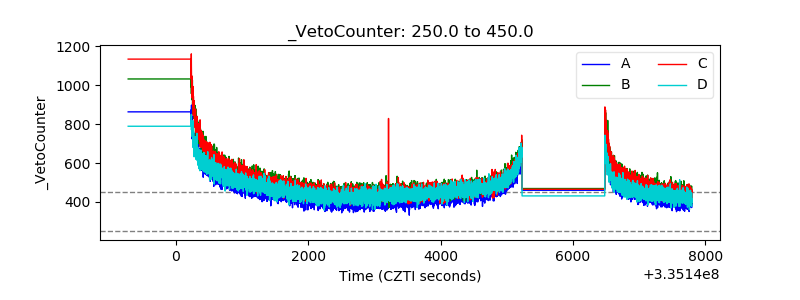 |