| Param | Original file | Final file |
|---|---|---|
| Filename | modeM0/AS1A09_044T02_9000003814_26390cztM0_level2.evt | modeM0/AS1A09_044T02_9000003814_26390cztM0_level2_quad_clean.evt |
| Size (bytes) | 513,826,560 | 87,819,840 |
| Size | 490.0 MB | 83.8 MB |
| Events in quadrant A | 3,539,554 | 559,333 |
| Events in quadrant B | 3,458,786 | 576,569 |
| Events in quadrant C | 3,832,506 | 535,914 |
| Events in quadrant D | 4,275,105 | 519,760 |
| Mode M0 | |||
|---|---|---|---|
| Quadrant | BADHDUFLAG | Total packets | Discarded packets |
| A | 0 | 14714 | 0 |
| B | 0 | 14342 | 0 |
| C | 0 | 15504 | 0 |
| D | 0 | 17272 | 0 |
| Mode M9 | |||
|---|---|---|---|
| Quadrant | BADHDUFLAG | Total packets | Discarded packets |
| A | 0 | 12 | 0 |
| B | 0 | 13 | 0 |
| C | 0 | 13 | 0 |
| D | 0 | 13 | 0 |
| Quadrant | Total seconds | Saturated seconds | Saturation percentage |
|---|---|---|---|
| A | 6713 | 89 | 1.325786% |
| B | 6713 | 57 | 0.849099% |
| C | 6712 | 141 | 2.100715% |
| D | 6712 | 145 | 2.160310% |
Noise dominated data is calculated using 1-second bins in cleaned event files. If a bin has >2000 counts, and if more than 50% of those come from <1% of pixels, then it is considered to be noise-dominated and hence unusable.
| Quadrant | # 1 sec bins | Bins with >0 counts | Bins with >2000 counts | High rate bins dominated by noise | Noise dominated (total time) | Noise dominated (detector-on time) | Marked lightcurve |
|---|---|---|---|---|---|---|---|
| A | 7633 | 6714 | 42 | 42 | 0.55% | 0.63% | 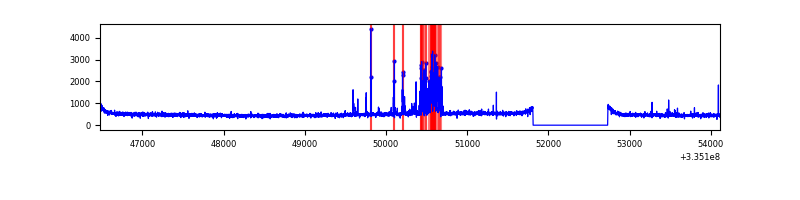 |
| B | 7633 | 6714 | 0 | 0 | 0.00% | 0.00% | 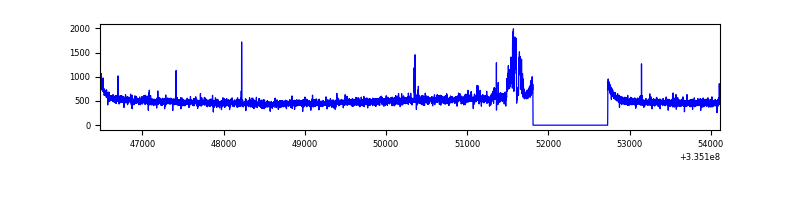 |
| C | 7632 | 6713 | 21 | 21 | 0.28% | 0.31% | 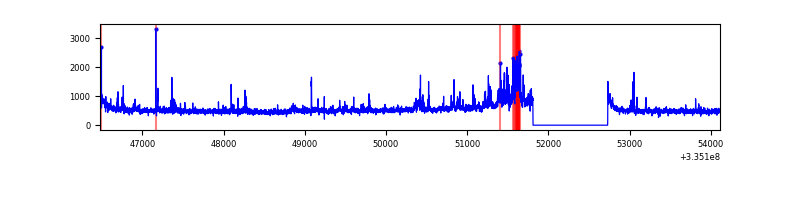 |
| D | 7632 | 6713 | 101 | 101 | 1.32% | 1.50% | 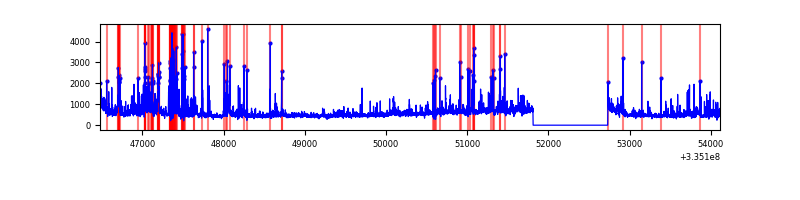 |
Top three noisy pixels from each quadrant. If the there are fewer than three noisy pixels in the level2.evt file, extra rows are filled as -1
| Pixel properties | Quadrant properties | ||||||
|---|---|---|---|---|---|---|---|
| Quadrant | DetID | PixID | Counts | Sigma | Mean | Median | Sigma |
| A | 0 | 13 | 282640 | 1653.01 | 844 | 829 | 170.5 |
| A | 13 | 254 | 11589 | 63.11 | 844 | 829 | 170.5 |
| A | 3 | 137 | 7799 | 40.88 | 844 | 829 | 170.5 |
| B | 0 | 244 | 111991 | 685.76 | 848 | 826 | 162.1 |
| B | 0 | 230 | 32990 | 198.41 | 848 | 826 | 162.1 |
| B | 12 | 111 | 19453 | 114.91 | 848 | 826 | 162.1 |
| C | 3 | 233 | 525722 | 2778.9 | 806 | 813 | 188.9 |
| C | 14 | 238 | 129012 | 678.69 | 806 | 813 | 188.9 |
| C | 2 | 16 | 35628 | 184.31 | 806 | 813 | 188.9 |
| D | 1 | 52 | 902213 | 4660.24 | 805 | 788 | 193.4 |
| D | 7 | 80 | 247175 | 1273.79 | 805 | 788 | 193.4 |
| D | 12 | 233 | 35643 | 180.2 | 805 | 788 | 193.4 |
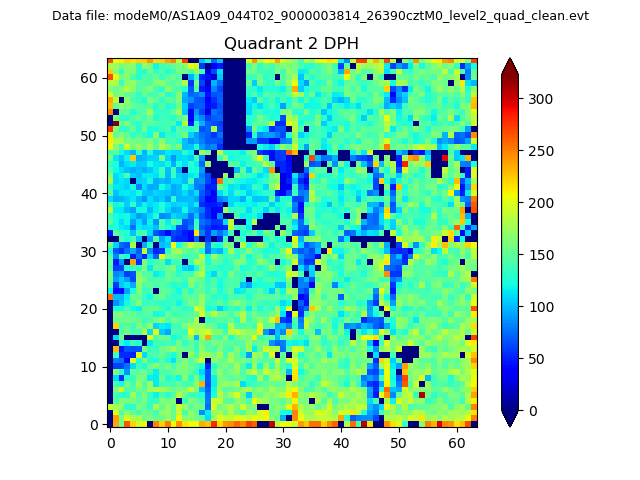
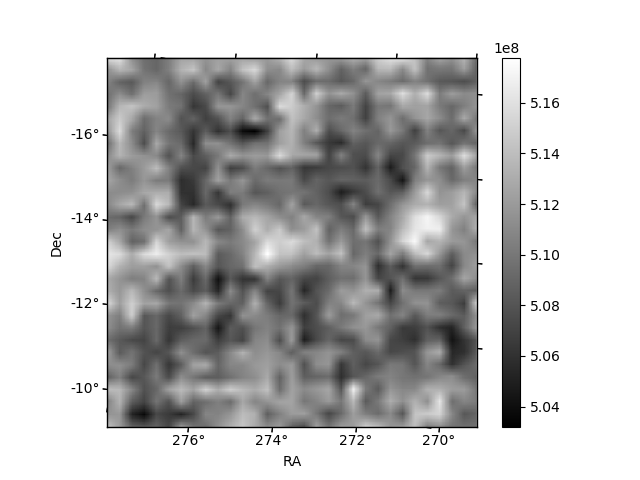
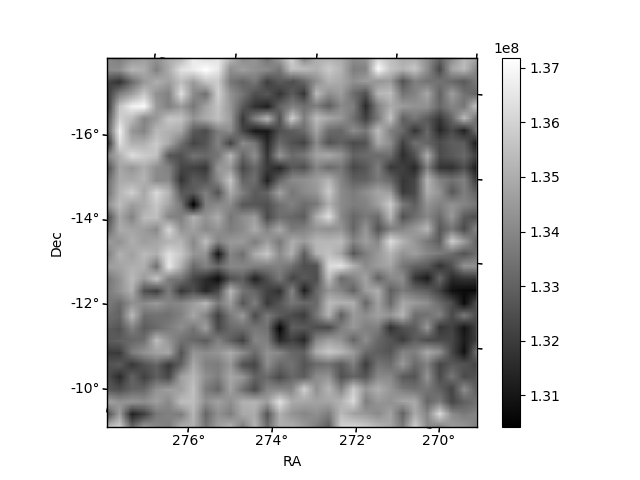
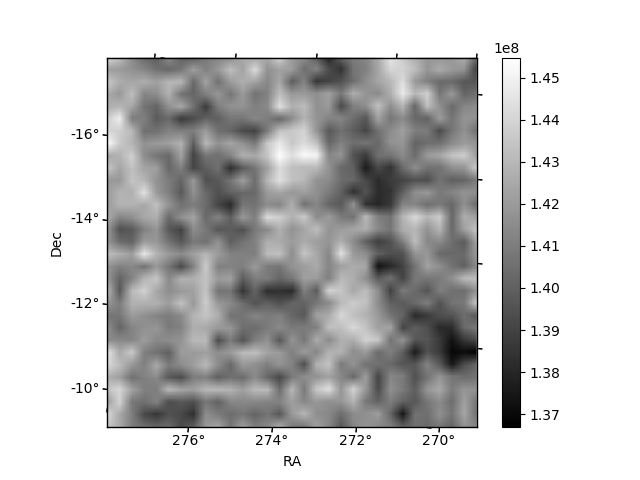
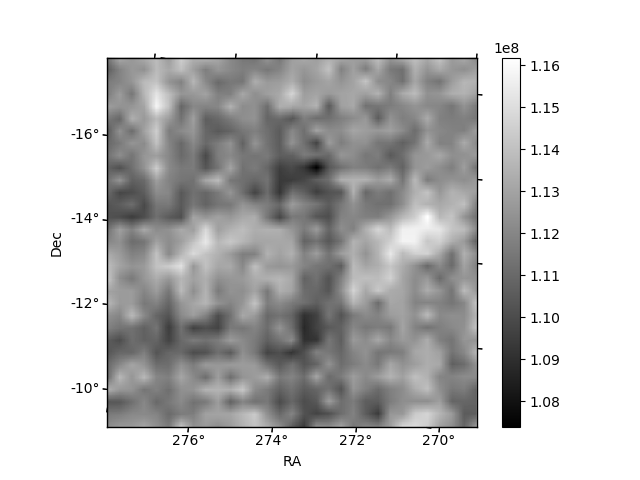
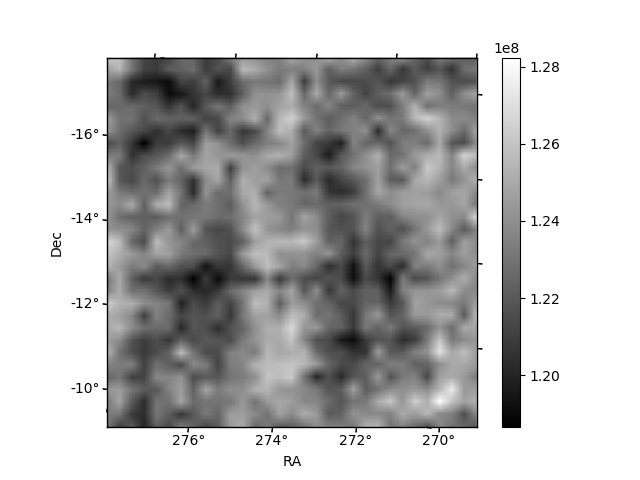
Histogram calculated using DETX and DETY for each event in the final _common_clean file
| Quadrant A | 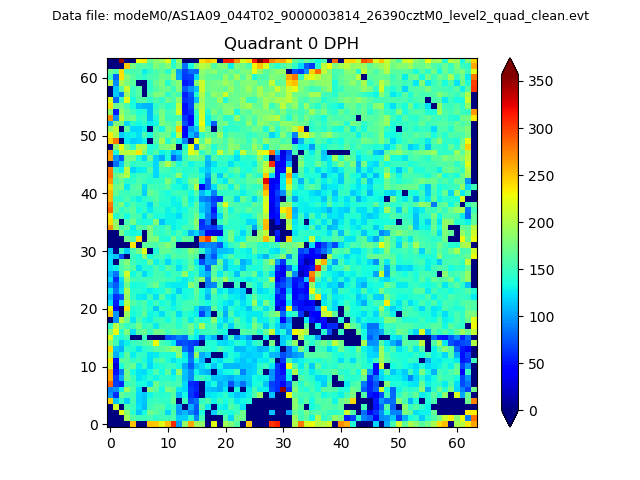 |
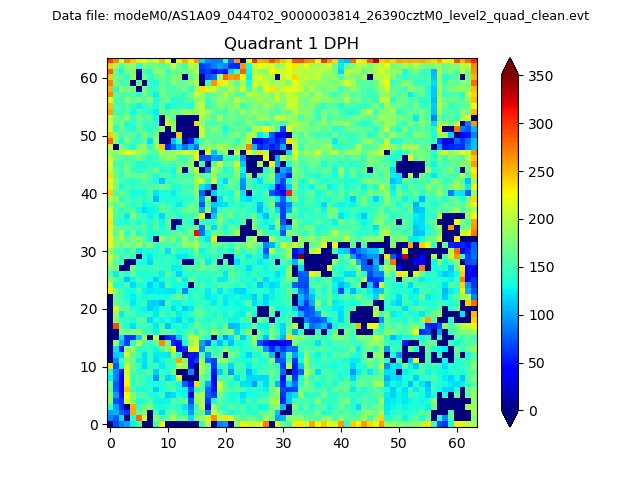 |
Quadrant B |
|---|---|---|---|
| Quadrant D | 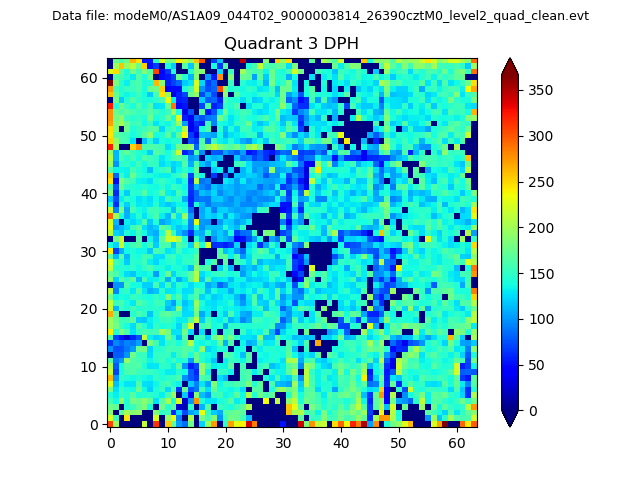 |
 |
Quadrant C |
| Plot type | Count rate plots | Images |
|---|---|---|
| Comparison with Poisson distribution Blue bars denote a histogram of data divided into 1 sec bins. Red curve is a Poisson curve with rate = median count rate of data. |
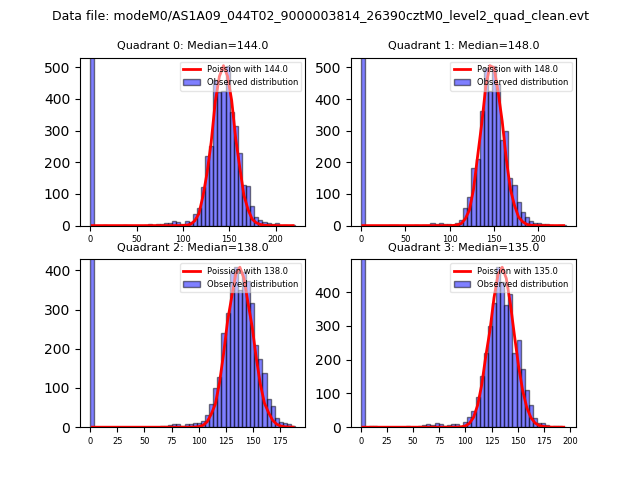 |
 |
| Quadrant-wise count rates Data is divided into 100 sec bins |
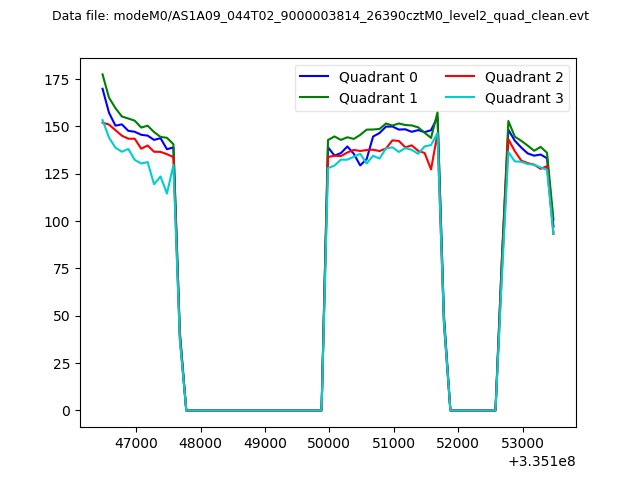 |
|
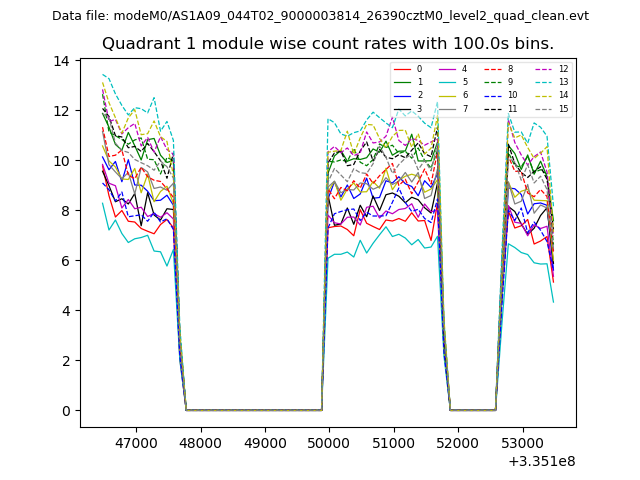
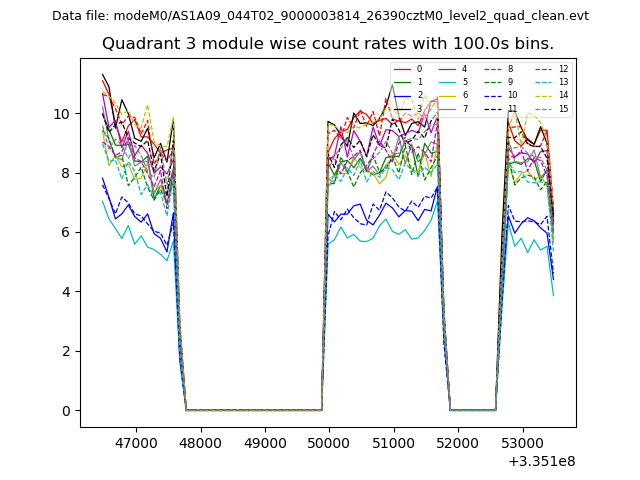
| Module-wise count rates for Quadrant A Data is divided into 100 sec bins |
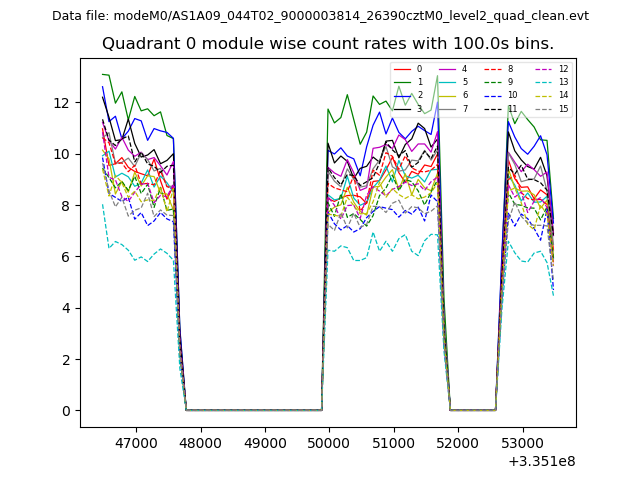 |
 |
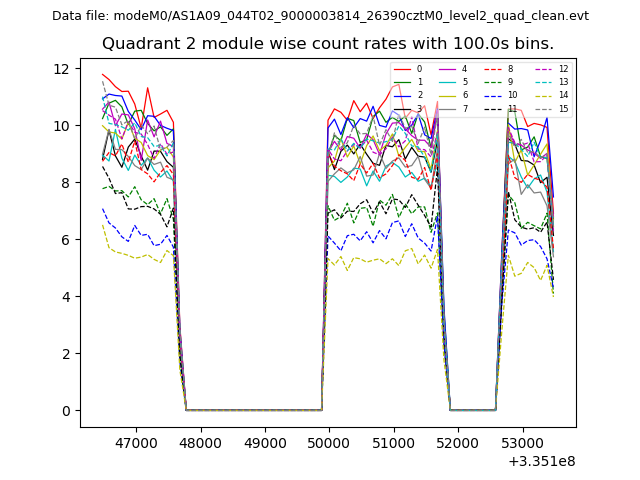
| Module-wise count rates for Quadrant B Data is divided into 100 sec bins |
 |
 |
| Module-wise count rates for Quadrant C Data is divided into 100 sec bins |
 |
 |
| Module-wise count rates for Quadrant D Data is divided into 100 sec bins |
 |
 |
| Parameter | Plot |
|---|---|
| CZT HV Monitor | 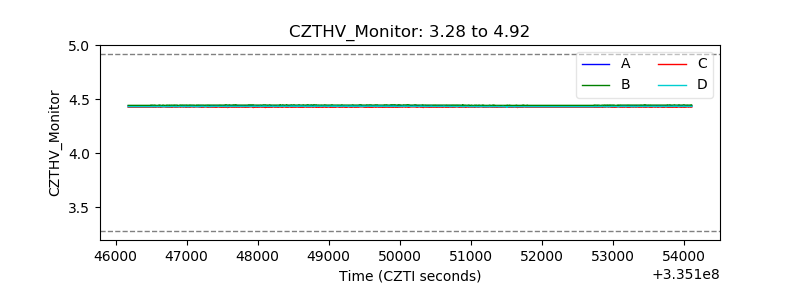 |
| D_VDD | 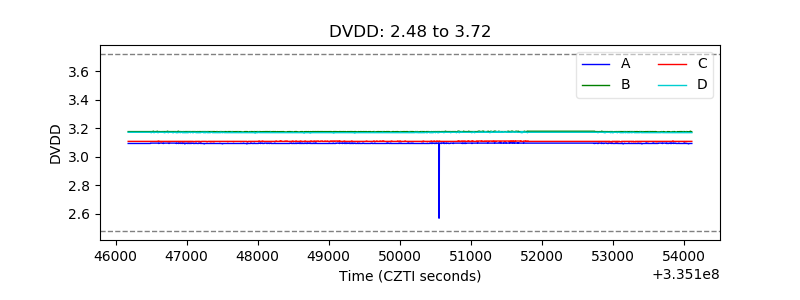 |
| Temperature 1 | 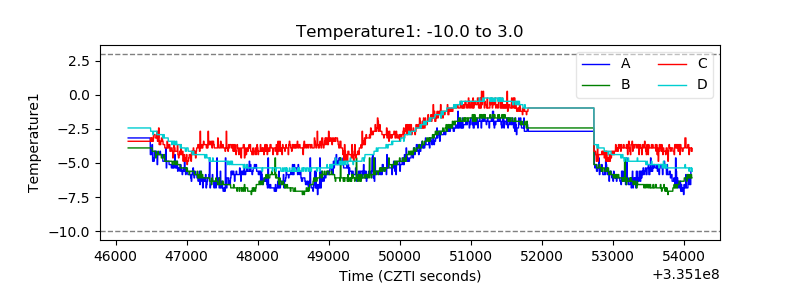 |
| Veto HV Monitor | 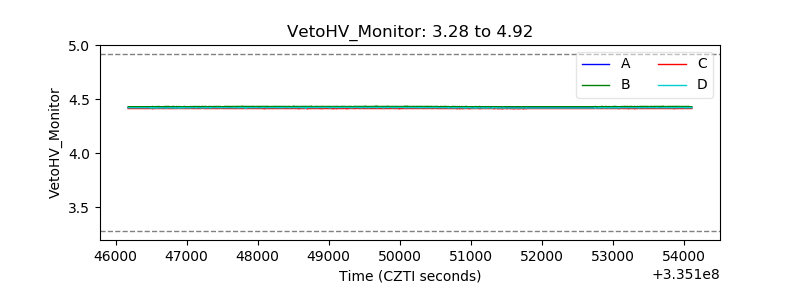 |
| Veto LLD | 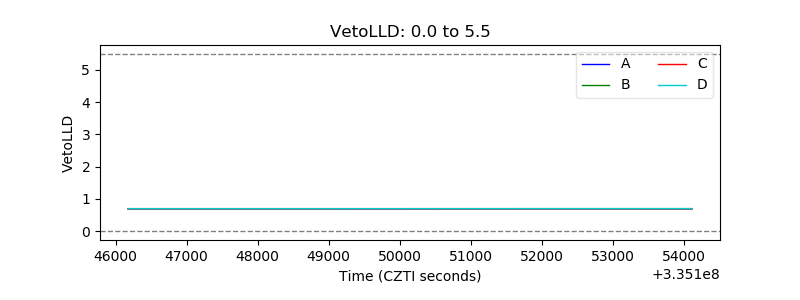 |
| Alpha Counter | 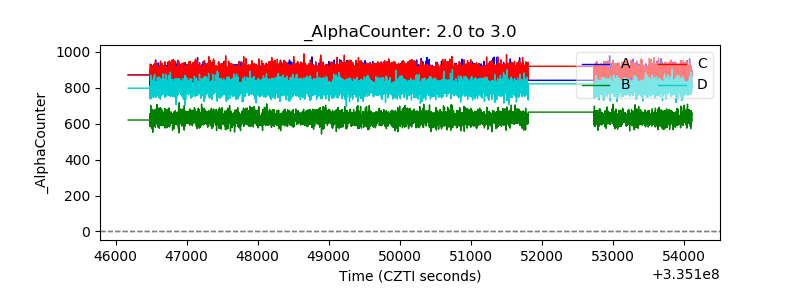 |
| _CPM_Rate | 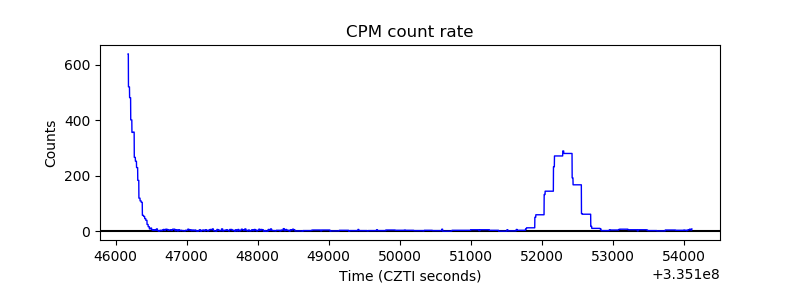 |
| CZT Counter | 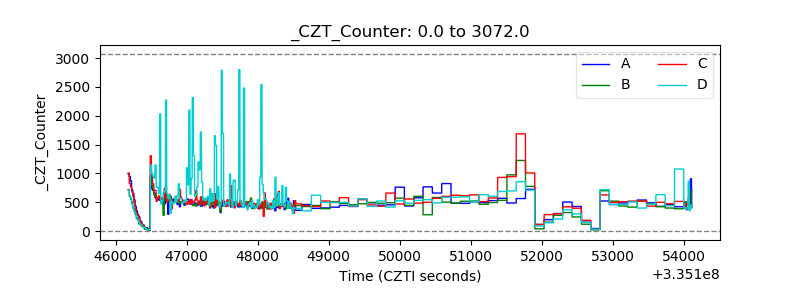 |
| +2.5 Volts monitor |  |
| +5 Volts monitor |  |
| _ROLL_ROT | 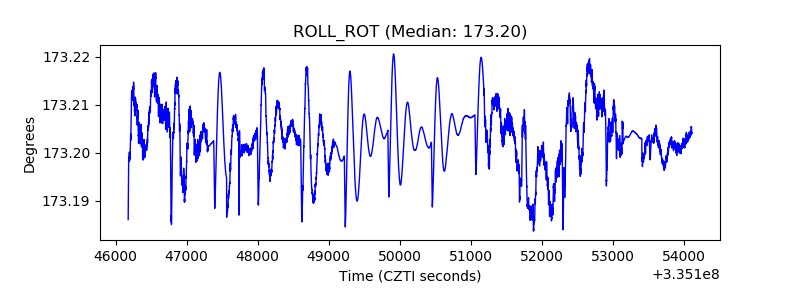 |
| _Roll_DEC | 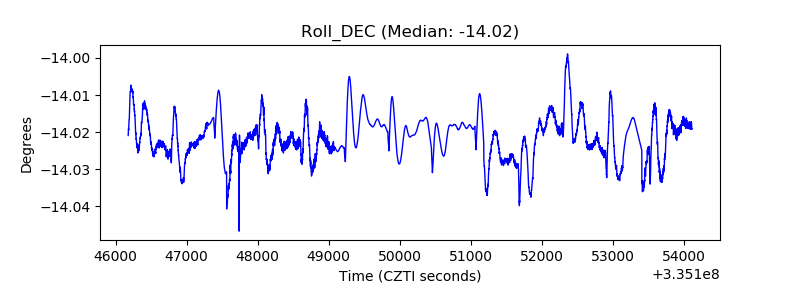 |
| _Roll_RA | 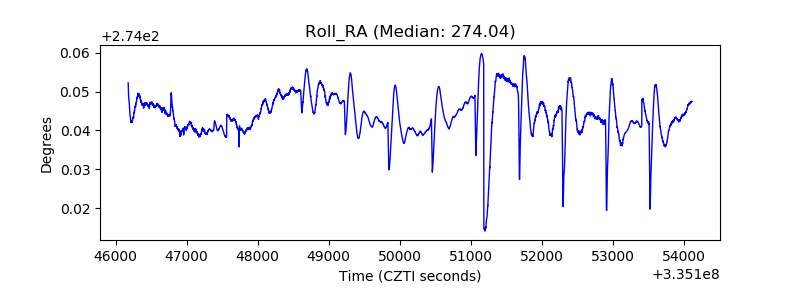 |
| Veto Counter | 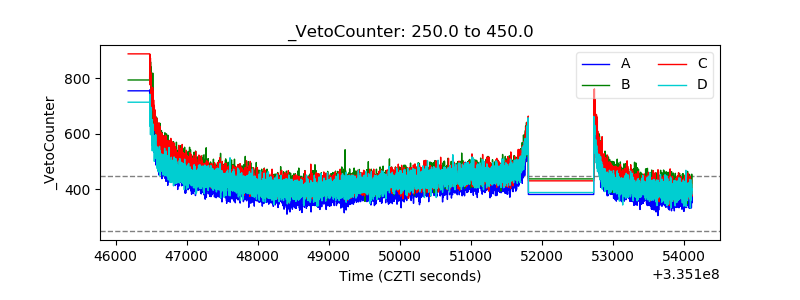 |