| Param | Original file | Final file |
|---|---|---|
| Filename | modeM0/AS1A09_044T02_9000003814_26391cztM0_level2.evt | modeM0/AS1A09_044T02_9000003814_26391cztM0_level2_quad_clean.evt |
| Size (bytes) | 887,581,440 | 130,080,960 |
| Size | 846.5 MB | 124.1 MB |
| Events in quadrant A | 5,760,452 | 811,267 |
| Events in quadrant B | 5,773,172 | 829,067 |
| Events in quadrant C | 6,499,495 | 765,251 |
| Events in quadrant D | 8,079,181 | 747,362 |
| Mode M0 | |||
|---|---|---|---|
| Quadrant | BADHDUFLAG | Total packets | Discarded packets |
| A | 0 | 24273 | 0 |
| B | 0 | 24132 | 0 |
| C | 0 | 26297 | 0 |
| D | 0 | 31761 | 0 |
| Mode M9 | |||
|---|---|---|---|
| Quadrant | BADHDUFLAG | Total packets | Discarded packets |
| A | 0 | 14 | 0 |
| B | 0 | 14 | 0 |
| C | 0 | 14 | 0 |
| D | 0 | 14 | 0 |
| Quadrant | Total seconds | Saturated seconds | Saturation percentage |
|---|---|---|---|
| A | 11360 | 114 | 1.003521% |
| B | 11360 | 103 | 0.906690% |
| C | 11360 | 330 | 2.904930% |
| D | 11360 | 367 | 3.230634% |
Noise dominated data is calculated using 1-second bins in cleaned event files. If a bin has >2000 counts, and if more than 50% of those come from <1% of pixels, then it is considered to be noise-dominated and hence unusable.
| Quadrant | # 1 sec bins | Bins with >0 counts | Bins with >2000 counts | High rate bins dominated by noise | Noise dominated (total time) | Noise dominated (detector-on time) | Marked lightcurve |
|---|---|---|---|---|---|---|---|
| A | 12810 | 11362 | 45 | 45 | 0.35% | 0.40% | 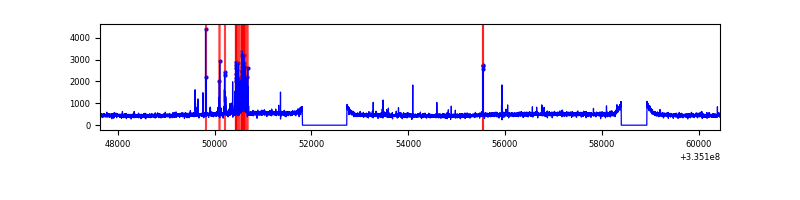 |
| B | 12810 | 11362 | 0 | 0 | 0.00% | 0.00% | 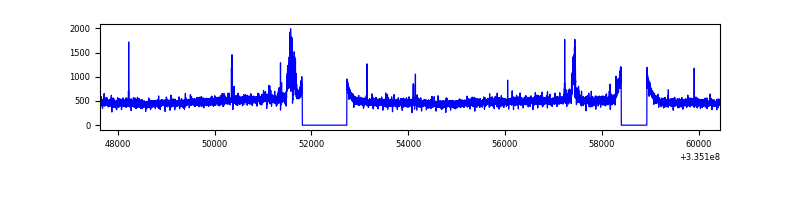 |
| C | 12810 | 11362 | 144 | 144 | 1.12% | 1.27% | 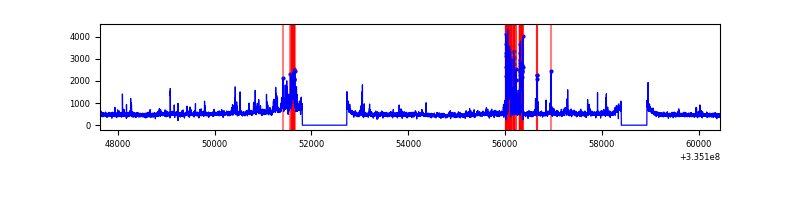 |
| D | 12810 | 11362 | 277 | 277 | 2.16% | 2.44% | 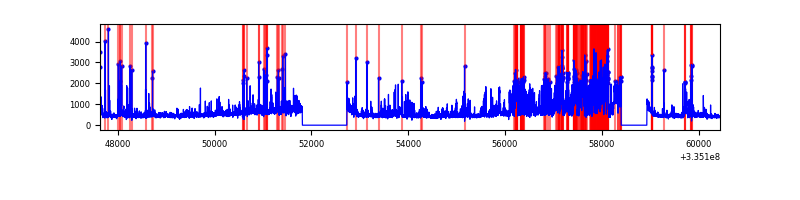 |
Top three noisy pixels from each quadrant. If the there are fewer than three noisy pixels in the level2.evt file, extra rows are filled as -1
| Pixel properties | Quadrant properties | ||||||
|---|---|---|---|---|---|---|---|
| Quadrant | DetID | PixID | Counts | Sigma | Mean | Median | Sigma |
| A | 0 | 13 | 310222 | 1080.83 | 1414 | 1388 | 285.7 |
| A | 13 | 254 | 19015 | 61.69 | 1414 | 1388 | 285.7 |
| A | 3 | 137 | 13281 | 41.62 | 1414 | 1388 | 285.7 |
| B | 0 | 244 | 160637 | 585.04 | 1415 | 1378 | 272.2 |
| B | 0 | 230 | 70312 | 253.23 | 1415 | 1378 | 272.2 |
| B | 12 | 111 | 33405 | 117.65 | 1415 | 1378 | 272.2 |
| C | 3 | 233 | 1021477 | 3239.97 | 1340 | 1350 | 314.9 |
| C | 14 | 238 | 215051 | 678.72 | 1340 | 1350 | 314.9 |
| C | 2 | 16 | 44788 | 137.96 | 1340 | 1350 | 314.9 |
| D | 1 | 52 | 2478076 | 7625.46 | 1350 | 1320 | 324.8 |
| D | 7 | 80 | 285367 | 874.53 | 1350 | 1320 | 324.8 |
| D | 12 | 233 | 133702 | 407.58 | 1350 | 1320 | 324.8 |
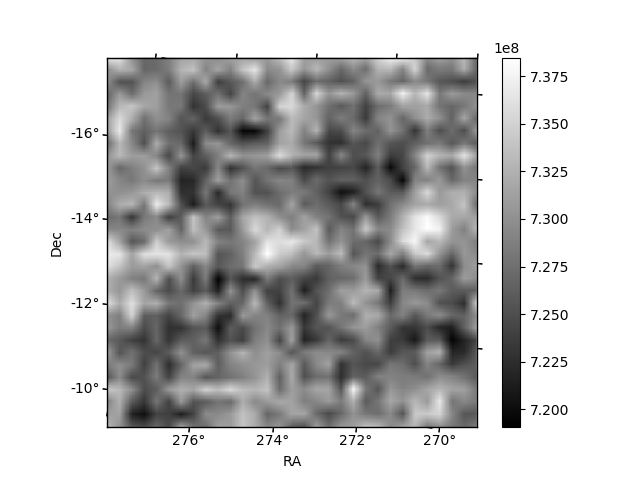
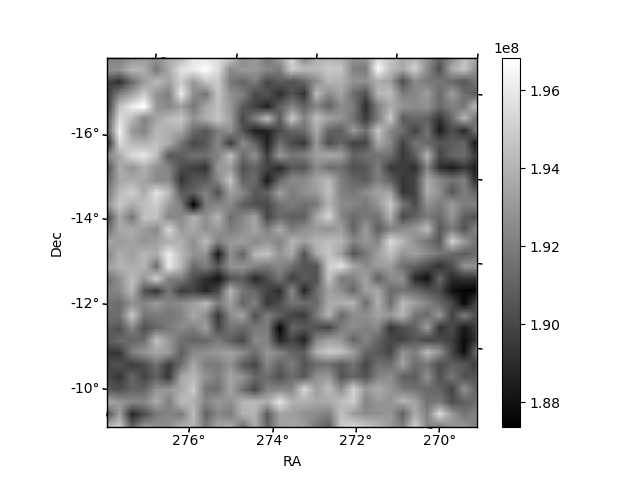
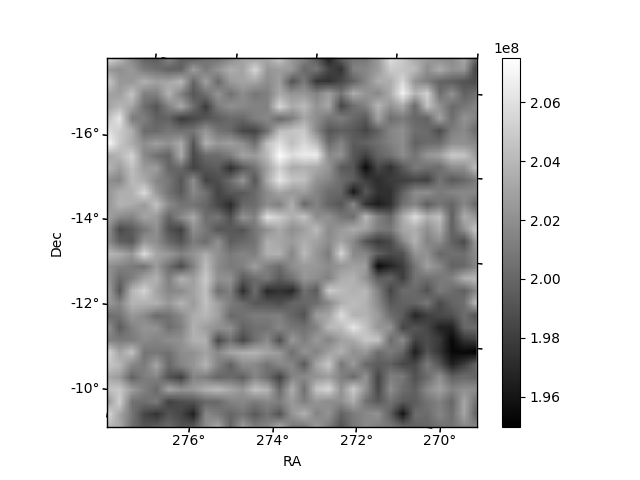
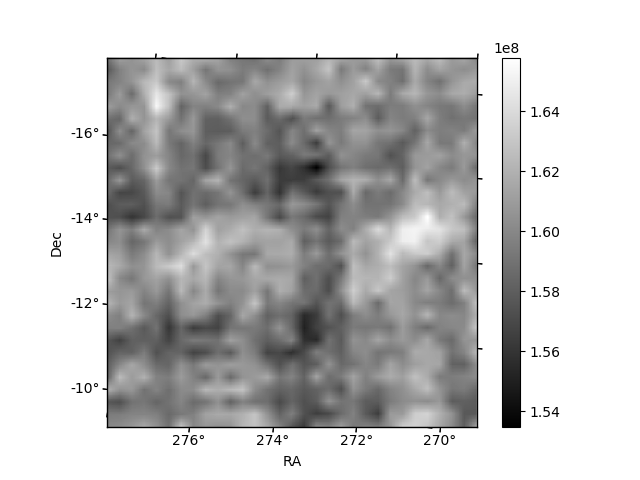
Histogram calculated using DETX and DETY for each event in the final _common_clean file
| Quadrant A | 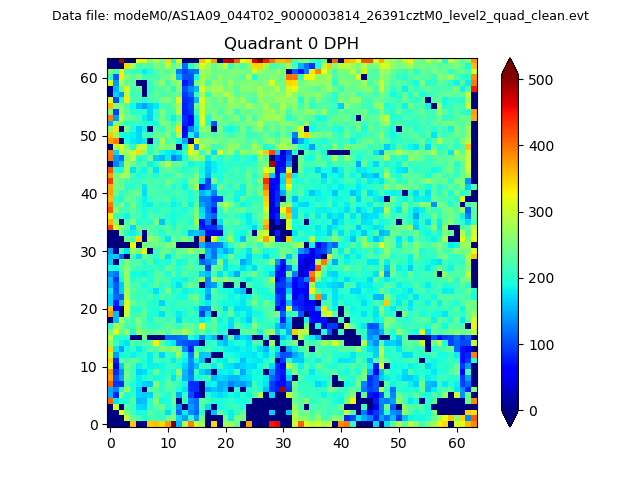 |
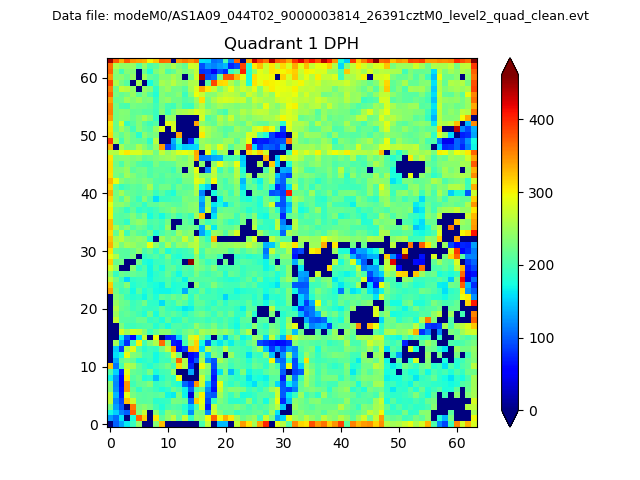 |
Quadrant B |
|---|---|---|---|
| Quadrant D | 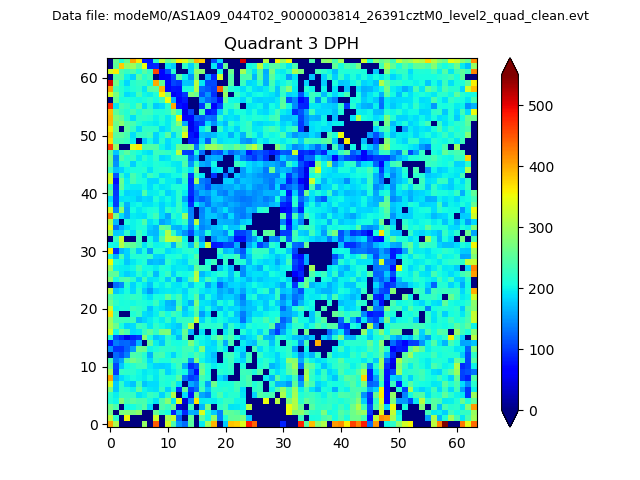 |
 |
Quadrant C |
| Plot type | Count rate plots | Images |
|---|---|---|
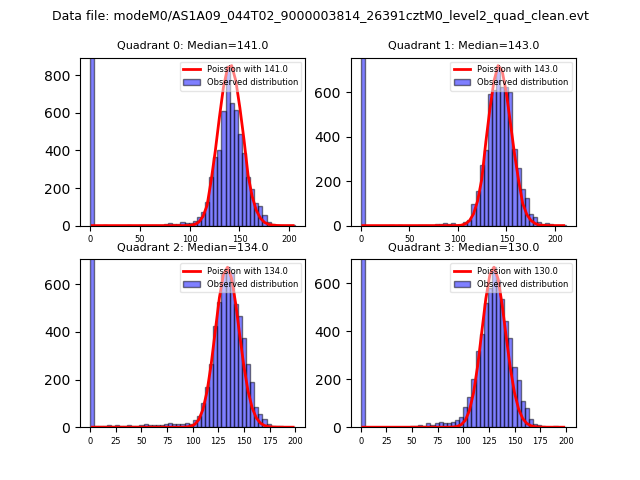
| Comparison with Poisson distribution Blue bars denote a histogram of data divided into 1 sec bins. Red curve is a Poisson curve with rate = median count rate of data. |
 |
 |
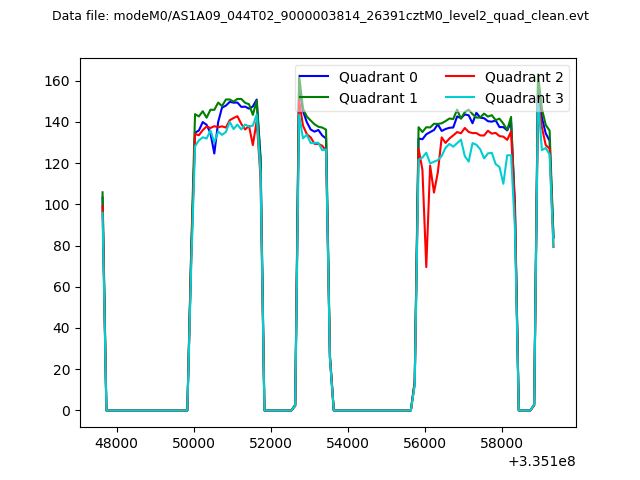
| Quadrant-wise count rates Data is divided into 100 sec bins |
 |
|
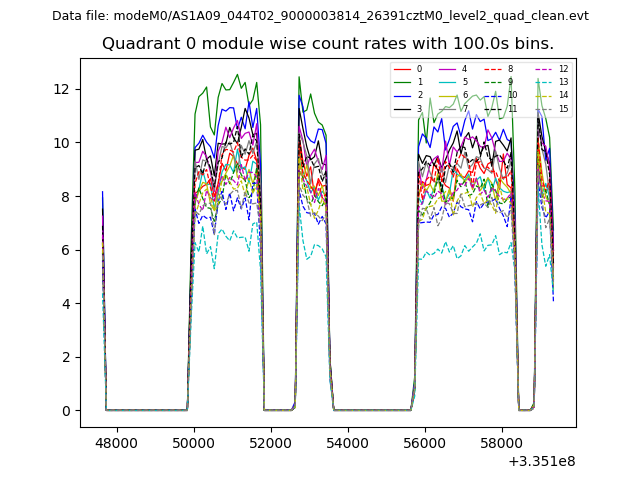
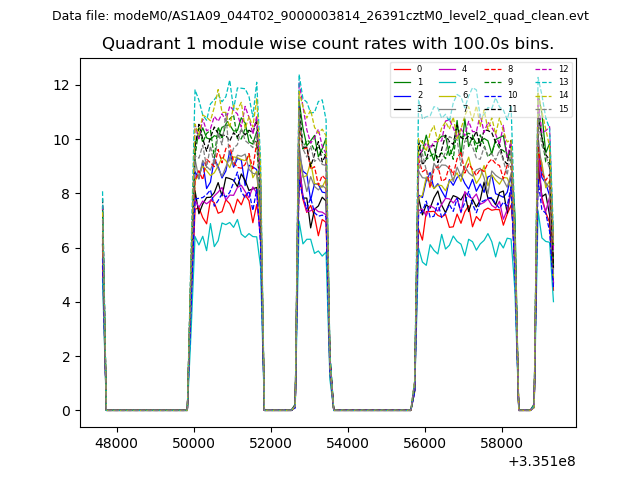
| Module-wise count rates for Quadrant A Data is divided into 100 sec bins |
 |
 |
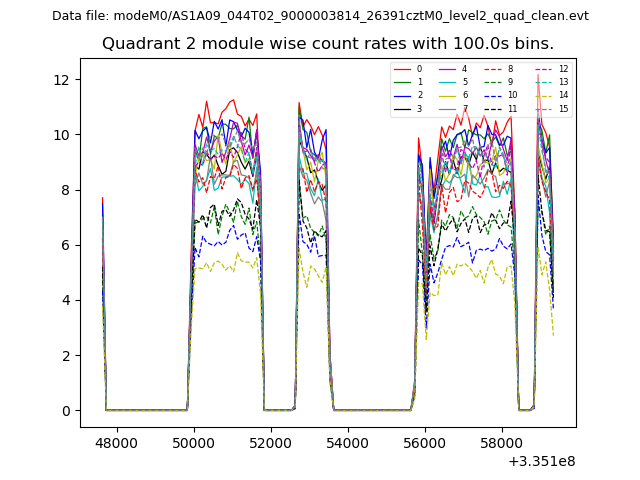
| Module-wise count rates for Quadrant B Data is divided into 100 sec bins |
 |
 |
| Module-wise count rates for Quadrant C Data is divided into 100 sec bins |
 |
 |
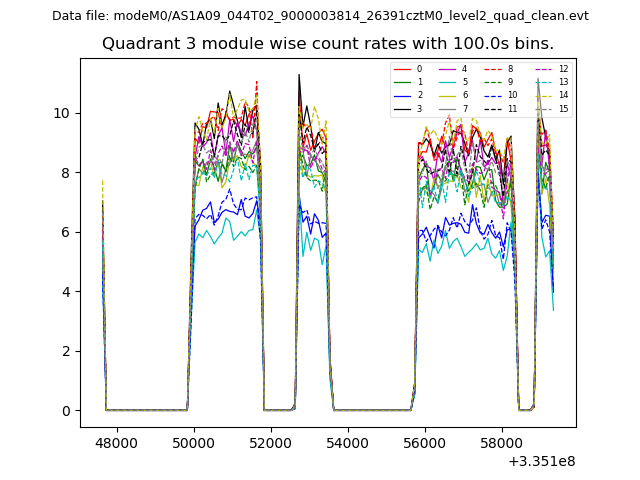
| Module-wise count rates for Quadrant D Data is divided into 100 sec bins |
 |
 |
| Parameter | Plot |
|---|---|
| CZT HV Monitor | 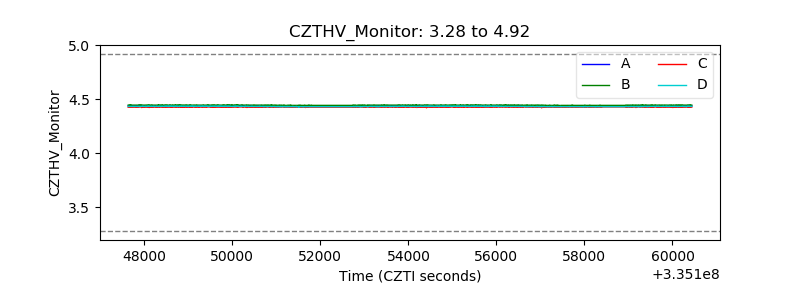 |
| D_VDD | 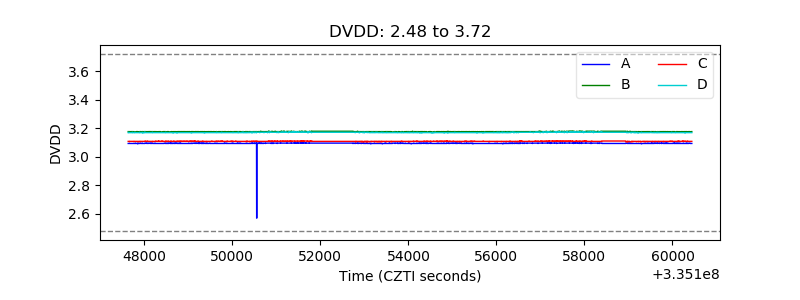 |
| Temperature 1 | 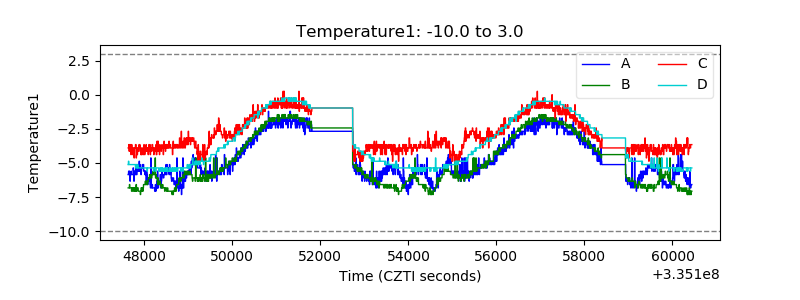 |
| Veto HV Monitor | 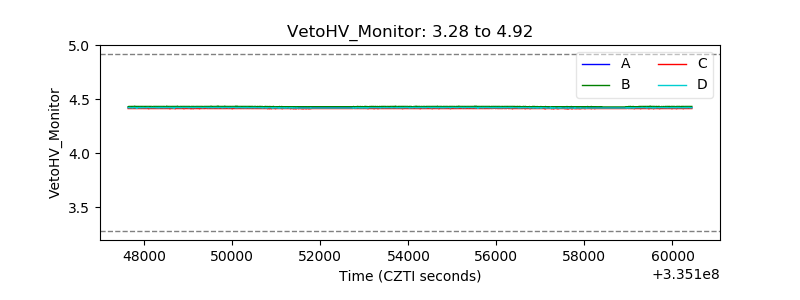 |
| Veto LLD | 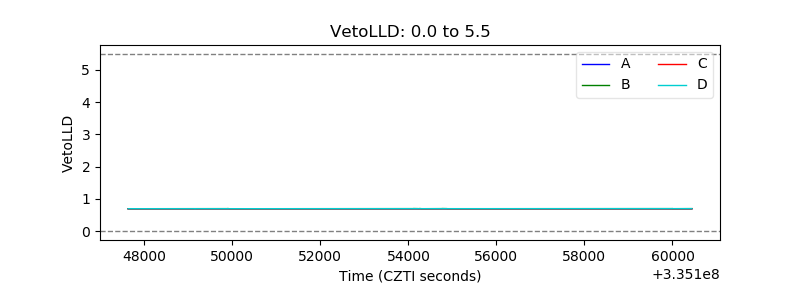 |
| Alpha Counter | 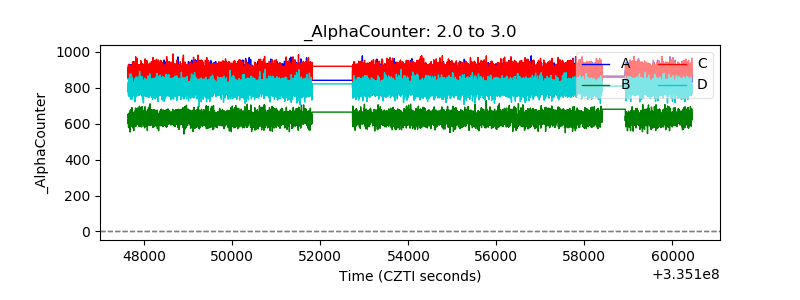 |
| _CPM_Rate | 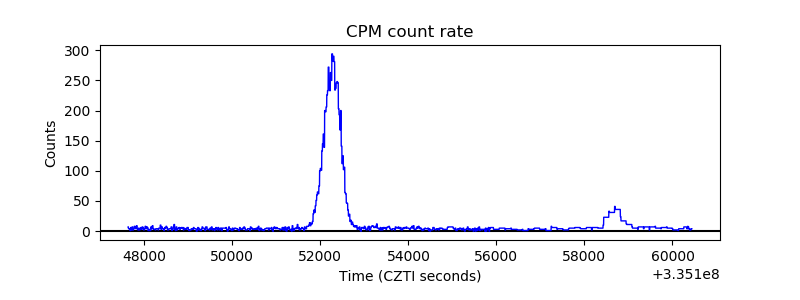 |
| CZT Counter |  |
| +2.5 Volts monitor |  |
| +5 Volts monitor |  |
| _ROLL_ROT | 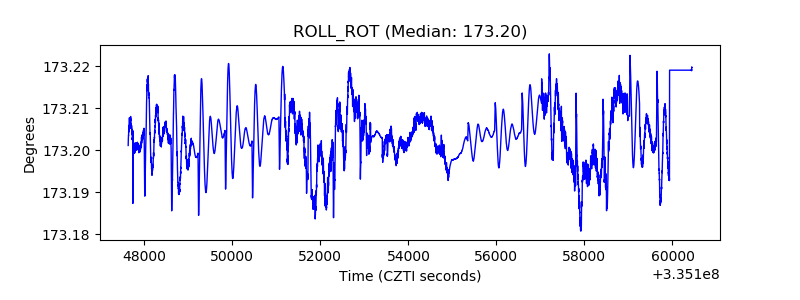 |
| _Roll_DEC | 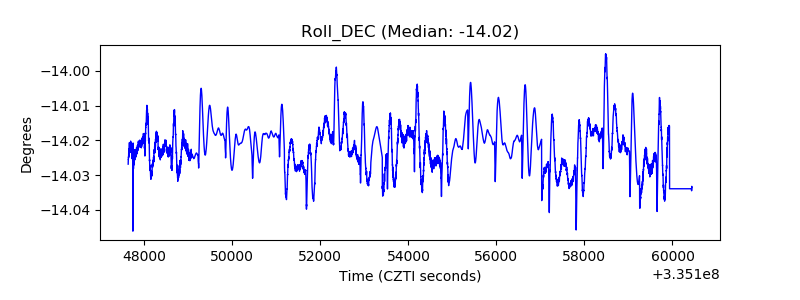 |
| _Roll_RA |  |
| Veto Counter | 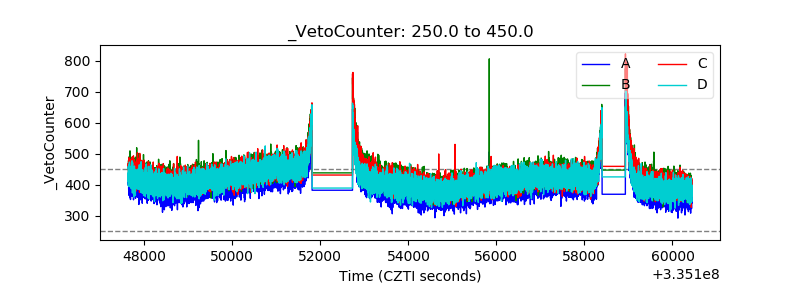 |