| Param | Original file | Final file |
|---|---|---|
| Filename | modeM0/AS1A09_044T02_9000003814_26392cztM0_level2.evt | modeM0/AS1A09_044T02_9000003814_26392cztM0_level2_quad_clean.evt |
| Size (bytes) | 647,928,000 | 95,981,760 |
| Size | 617.9 MB | 91.5 MB |
| Events in quadrant A | 4,175,589 | 595,787 |
| Events in quadrant B | 4,287,893 | 609,317 |
| Events in quadrant C | 4,582,404 | 576,519 |
| Events in quadrant D | 6,010,903 | 544,819 |
| Mode M0 | |||
|---|---|---|---|
| Quadrant | BADHDUFLAG | Total packets | Discarded packets |
| A | 0 | 17824 | 0 |
| B | 0 | 18015 | 0 |
| C | 0 | 18853 | 0 |
| D | 0 | 23634 | 0 |
| Mode M9 | |||
|---|---|---|---|
| Quadrant | BADHDUFLAG | Total packets | Discarded packets |
| A | 0 | 6 | 0 |
| B | 0 | 6 | 0 |
| C | 0 | 6 | 0 |
| D | 0 | 6 | 0 |
| Quadrant | Total seconds | Saturated seconds | Saturation percentage |
|---|---|---|---|
| A | 8338 | 296 | 3.550012% |
| B | 8338 | 326 | 3.909811% |
| C | 8338 | 401 | 4.809307% |
| D | 8339 | 661 | 7.926610% |
Noise dominated data is calculated using 1-second bins in cleaned event files. If a bin has >2000 counts, and if more than 50% of those come from <1% of pixels, then it is considered to be noise-dominated and hence unusable.
| Quadrant | # 1 sec bins | Bins with >0 counts | Bins with >2000 counts | High rate bins dominated by noise | Noise dominated (total time) | Noise dominated (detector-on time) | Marked lightcurve |
|---|---|---|---|---|---|---|---|
| A | 8938 | 8340 | 3 | 3 | 0.03% | 0.04% | 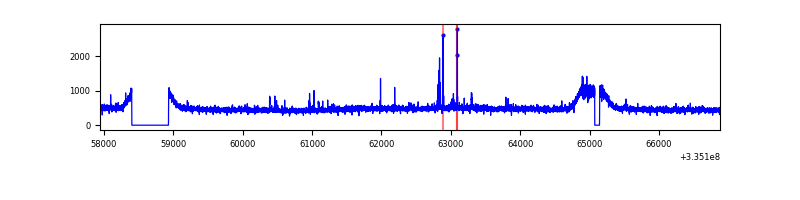 |
| B | 8938 | 8340 | 0 | 0 | 0.00% | 0.00% | 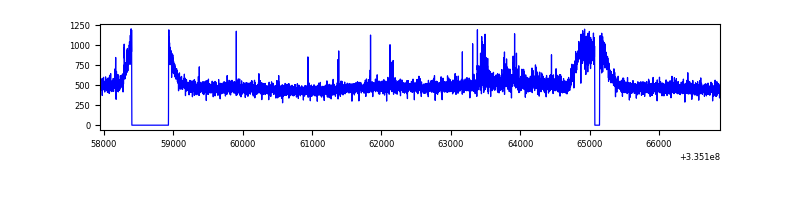 |
| C | 8938 | 8339 | 26 | 26 | 0.29% | 0.31% | 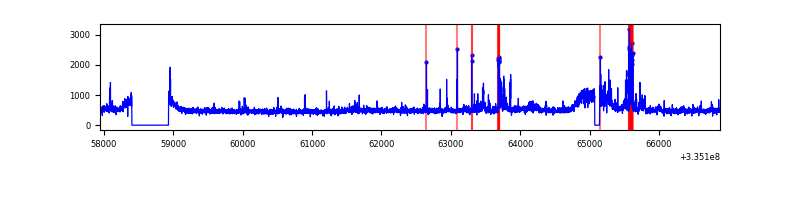 |
| D | 8939 | 8341 | 271 | 271 | 3.03% | 3.25% |  |
Top three noisy pixels from each quadrant. If the there are fewer than three noisy pixels in the level2.evt file, extra rows are filled as -1
| Pixel properties | Quadrant properties | ||||||
|---|---|---|---|---|---|---|---|
| Quadrant | DetID | PixID | Counts | Sigma | Mean | Median | Sigma |
| A | 0 | 13 | 58322 | 262.94 | 1067 | 1043 | 217.8 |
| A | 13 | 254 | 13755 | 58.35 | 1067 | 1043 | 217.8 |
| A | 3 | 137 | 10598 | 43.86 | 1067 | 1043 | 217.8 |
| B | 0 | 230 | 61081 | 285.55 | 1064 | 1035 | 210.3 |
| B | 0 | 244 | 47837 | 222.56 | 1064 | 1035 | 210.3 |
| B | 12 | 111 | 26293 | 120.11 | 1064 | 1035 | 210.3 |
| C | 3 | 233 | 396409 | 1625.54 | 1017 | 1022 | 243.2 |
| C | 14 | 238 | 160492 | 655.62 | 1017 | 1022 | 243.2 |
| C | 2 | 16 | 65938 | 266.88 | 1017 | 1022 | 243.2 |
| D | 1 | 52 | 1526593 | 6237.6 | 1006 | 982 | 244.6 |
| D | 12 | 233 | 282151 | 1149.59 | 1006 | 982 | 244.6 |
| D | 7 | 80 | 266188 | 1084.32 | 1006 | 982 | 244.6 |
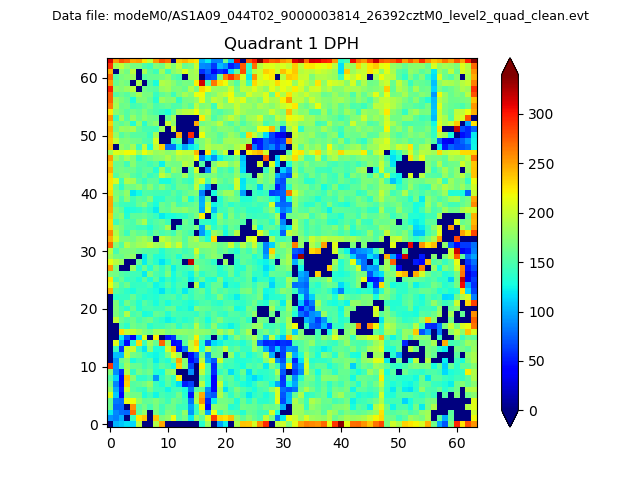
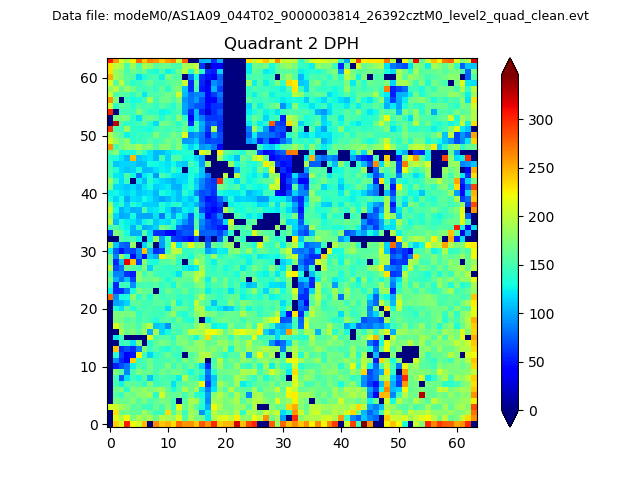
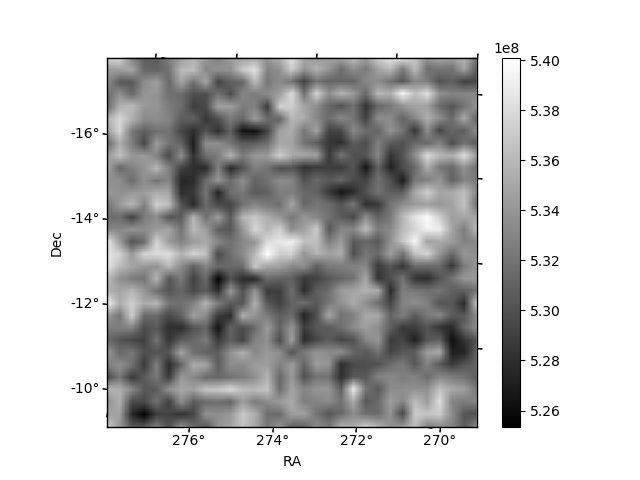
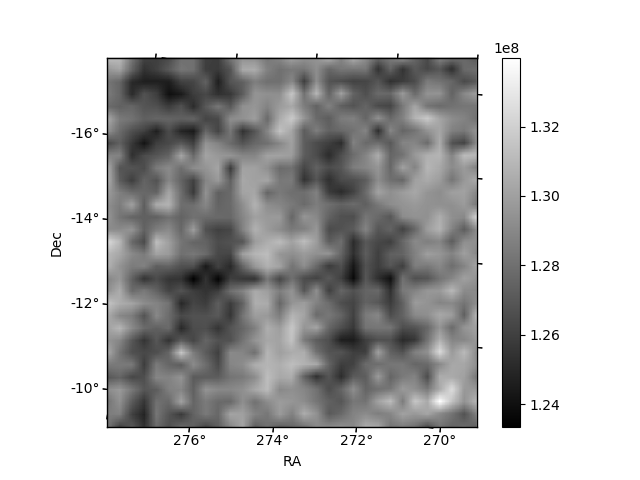
Histogram calculated using DETX and DETY for each event in the final _common_clean file
| Quadrant A | 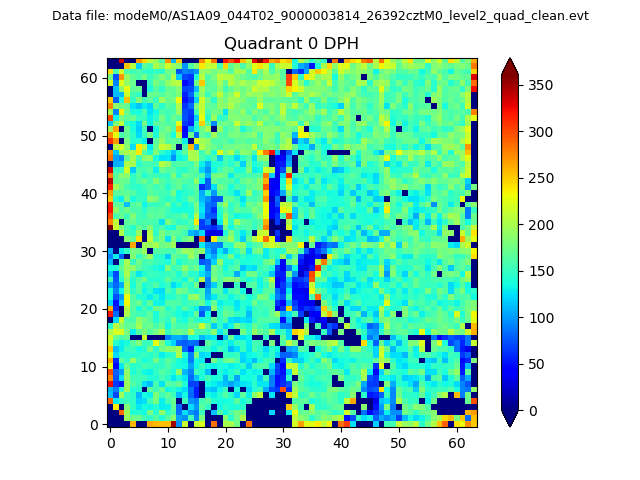 |
 |
Quadrant B |
|---|---|---|---|
| Quadrant D | 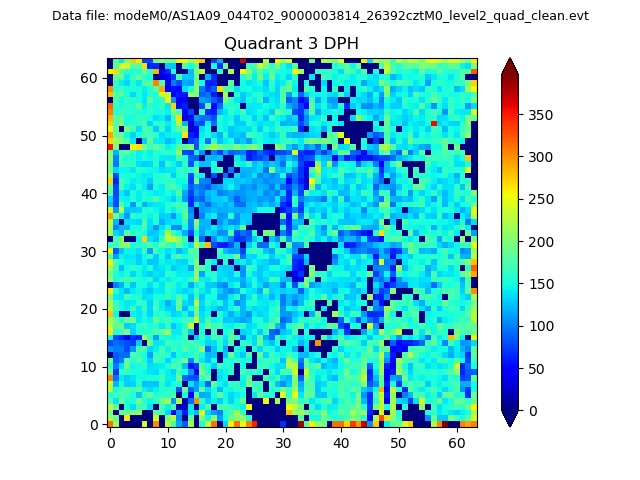 |
 |
Quadrant C |
| Plot type | Count rate plots | Images |
|---|---|---|
| Comparison with Poisson distribution Blue bars denote a histogram of data divided into 1 sec bins. Red curve is a Poisson curve with rate = median count rate of data. |
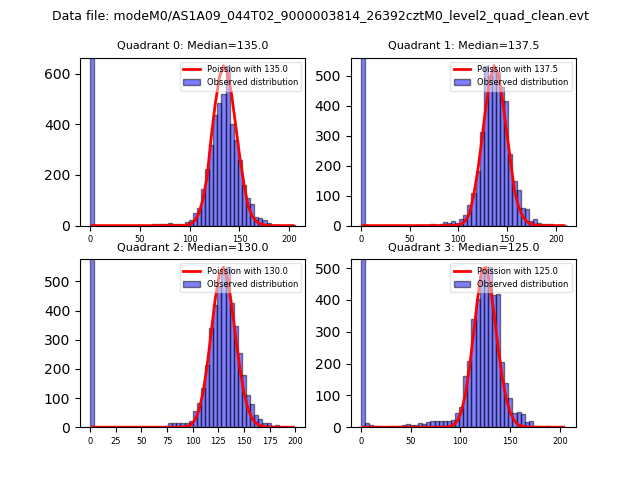 |
 |
| Quadrant-wise count rates Data is divided into 100 sec bins |
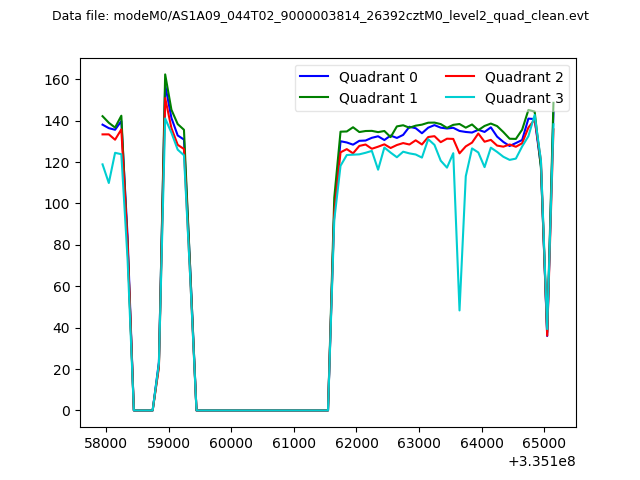 |
|
| Module-wise count rates for Quadrant A Data is divided into 100 sec bins |
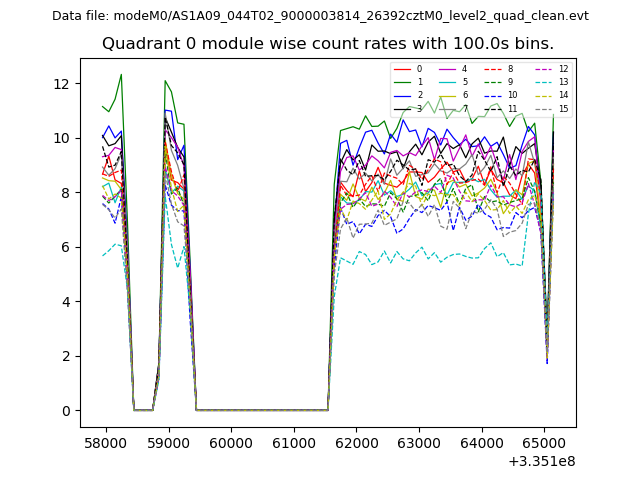 |
 |
| Module-wise count rates for Quadrant B Data is divided into 100 sec bins |
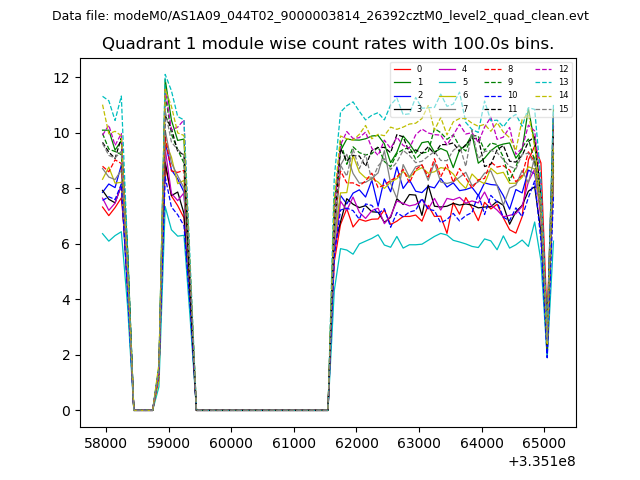 |
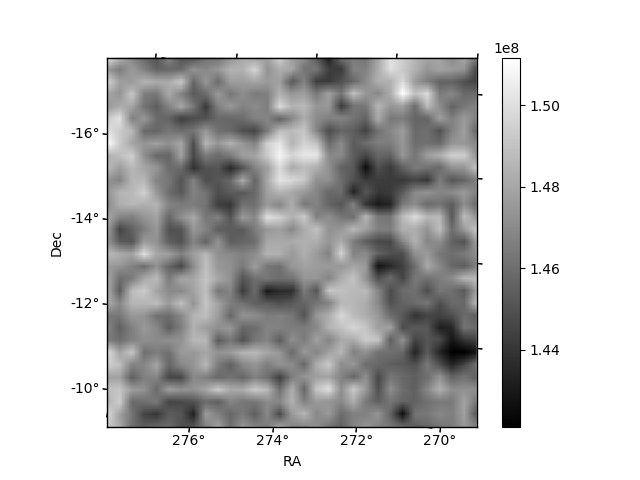 |
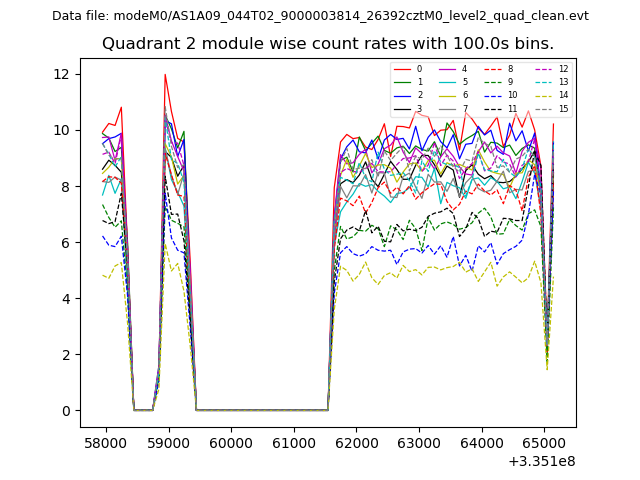
| Module-wise count rates for Quadrant C Data is divided into 100 sec bins |
 |
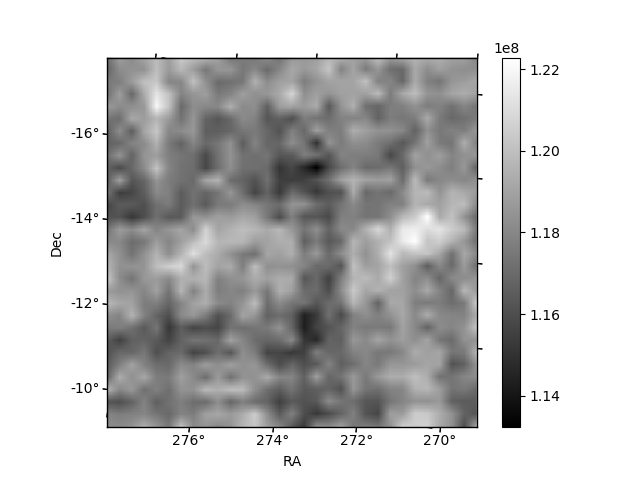 |
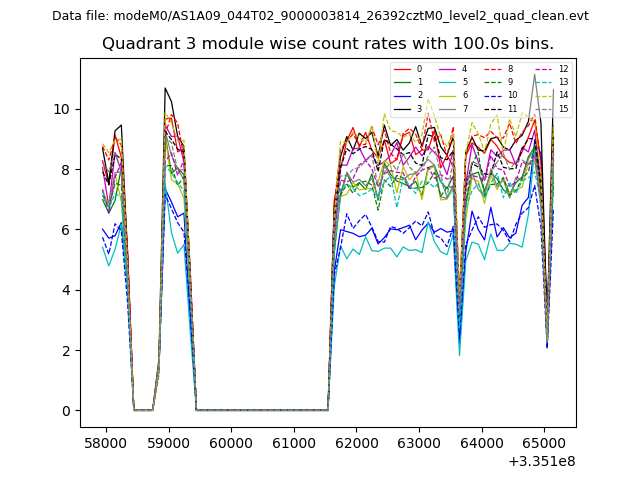
| Module-wise count rates for Quadrant D Data is divided into 100 sec bins |
 |
 |
| Parameter | Plot |
|---|---|
| CZT HV Monitor |  |
| D_VDD | 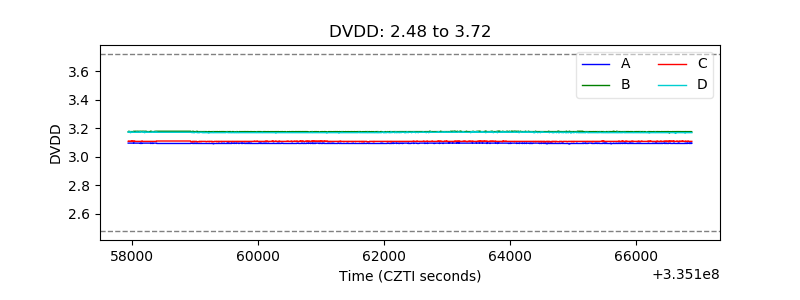 |
| Temperature 1 | 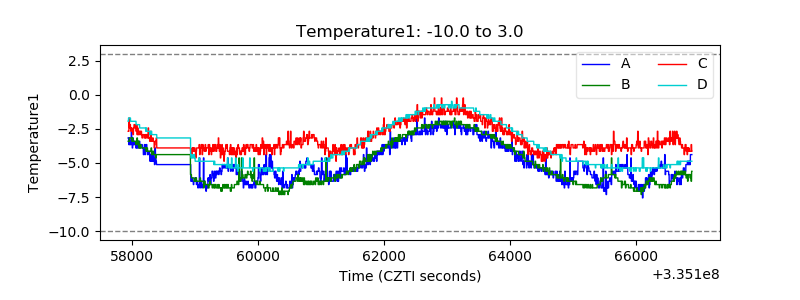 |
| Veto HV Monitor | 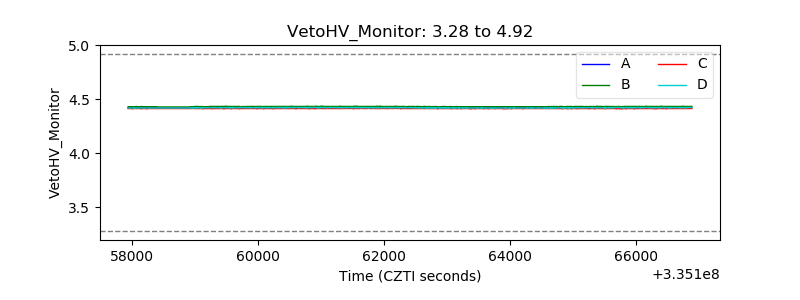 |
| Veto LLD | 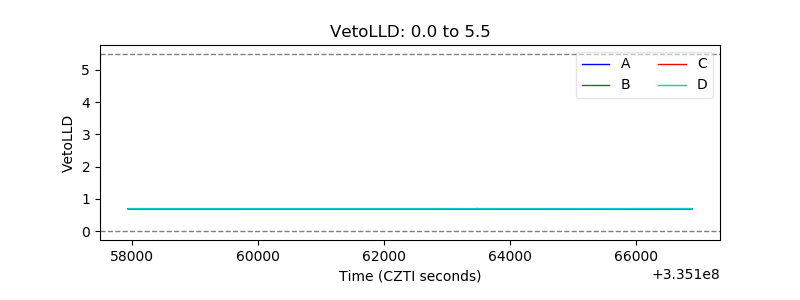 |
| Alpha Counter | 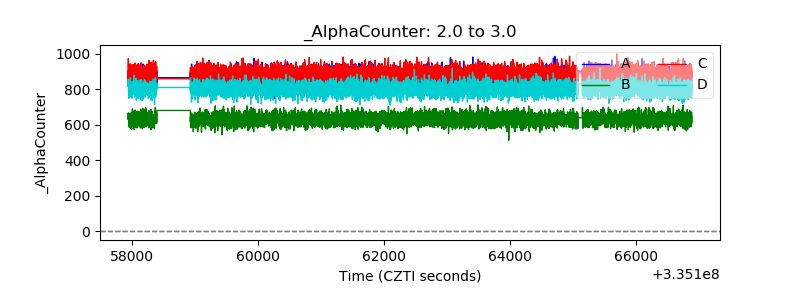 |
| _CPM_Rate | 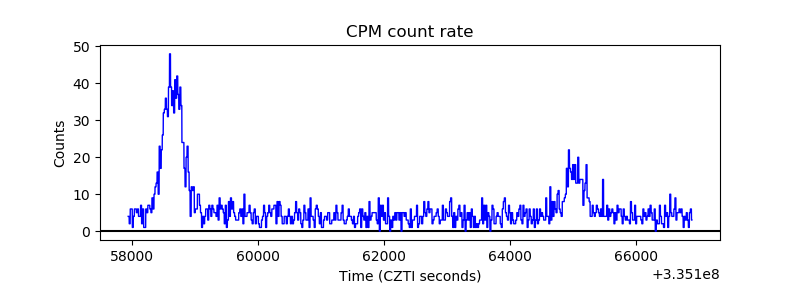 |
| CZT Counter | 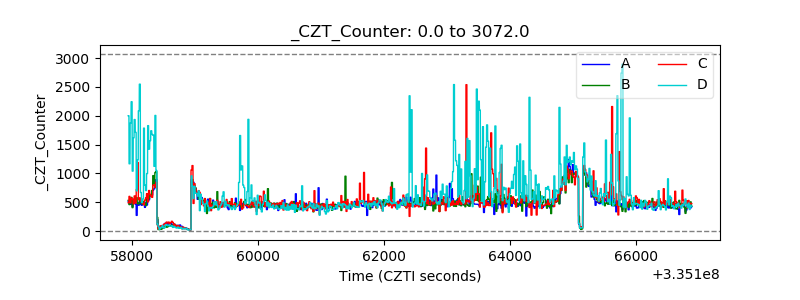 |
| +2.5 Volts monitor |  |
| +5 Volts monitor |  |
| _ROLL_ROT | 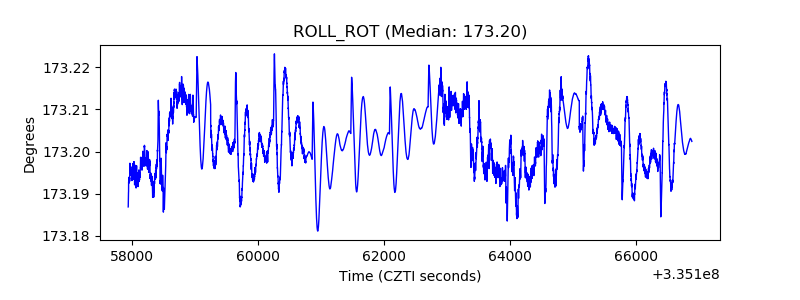 |
| _Roll_DEC | 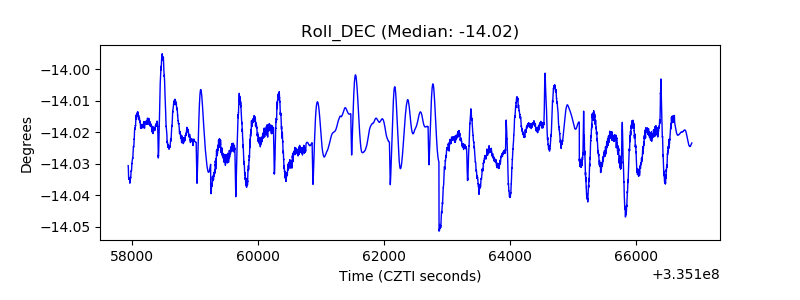 |
| _Roll_RA | 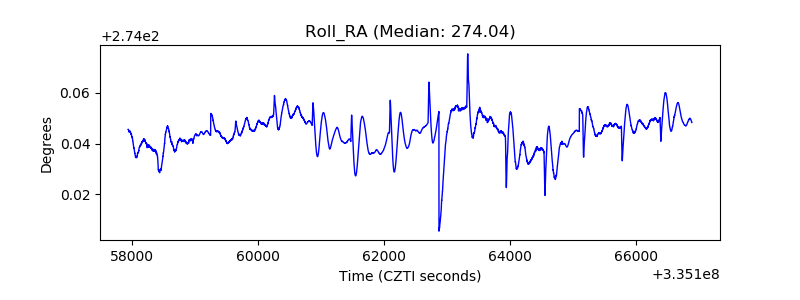 |
| Veto Counter | 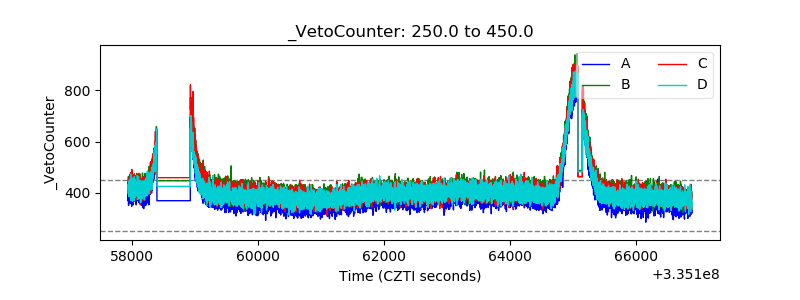 |