| Param | Original file | Final file |
|---|---|---|
| Filename | modeM0/AS1A09_044T02_9000003814_26393cztM0_level2.evt | modeM0/AS1A09_044T02_9000003814_26393cztM0_level2_quad_clean.evt |
| Size (bytes) | 604,313,280 | 81,581,760 |
| Size | 576.3 MB | 77.8 MB |
| Events in quadrant A | 3,768,761 | 498,700 |
| Events in quadrant B | 3,978,697 | 508,568 |
| Events in quadrant C | 4,883,958 | 471,727 |
| Events in quadrant D | 5,150,067 | 457,462 |
| Mode M0 | |||
|---|---|---|---|
| Quadrant | BADHDUFLAG | Total packets | Discarded packets |
| A | 0 | 16156 | 0 |
| B | 0 | 16664 | 0 |
| C | 0 | 19386 | 0 |
| D | 0 | 20533 | 0 |
| Mode M9 | |||
|---|---|---|---|
| Quadrant | BADHDUFLAG | Total packets | Discarded packets |
| A | 0 | 5 | 0 |
| B | 0 | 5 | 0 |
| C | 0 | 5 | 0 |
| D | 0 | 5 | 0 |
| Quadrant | Total seconds | Saturated seconds | Saturation percentage |
|---|---|---|---|
| A | 7671 | 276 | 3.597966% |
| B | 7671 | 295 | 3.845652% |
| C | 7671 | 482 | 6.283405% |
| D | 7671 | 599 | 7.808630% |
Noise dominated data is calculated using 1-second bins in cleaned event files. If a bin has >2000 counts, and if more than 50% of those come from <1% of pixels, then it is considered to be noise-dominated and hence unusable.
| Quadrant | # 1 sec bins | Bins with >0 counts | Bins with >2000 counts | High rate bins dominated by noise | Noise dominated (total time) | Noise dominated (detector-on time) | Marked lightcurve |
|---|---|---|---|---|---|---|---|
| A | 8081 | 7673 | 0 | 0 | 0.00% | 0.00% | 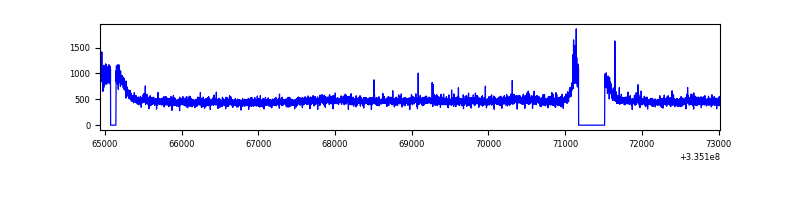 |
| B | 8081 | 7673 | 1 | 1 | 0.01% | 0.01% | 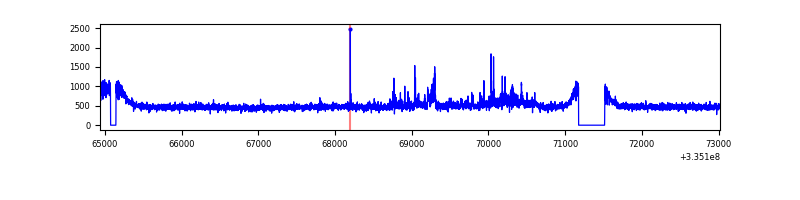 |
| C | 8081 | 7672 | 88 | 88 | 1.09% | 1.15% | 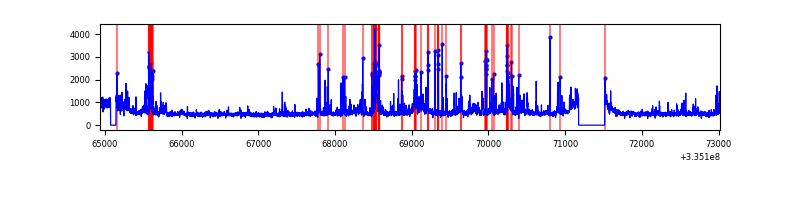 |
| D | 8081 | 7672 | 284 | 284 | 3.51% | 3.70% | 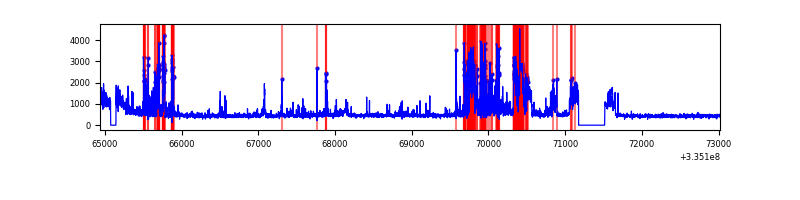 |
Top three noisy pixels from each quadrant. If the there are fewer than three noisy pixels in the level2.evt file, extra rows are filled as -1
| Pixel properties | Quadrant properties | ||||||
|---|---|---|---|---|---|---|---|
| Quadrant | DetID | PixID | Counts | Sigma | Mean | Median | Sigma |
| A | 0 | 13 | 28256 | 138.68 | 970 | 948 | 196.9 |
| A | 13 | 254 | 12242 | 57.35 | 970 | 948 | 196.9 |
| A | 3 | 137 | 9626 | 44.07 | 970 | 948 | 196.9 |
| B | 0 | 230 | 71684 | 372.8 | 967 | 940 | 189.8 |
| B | 0 | 244 | 66610 | 346.06 | 967 | 940 | 189.8 |
| B | 0 | 245 | 51652 | 267.24 | 967 | 940 | 189.8 |
| C | 3 | 233 | 920930 | 4184.63 | 920 | 927 | 219.9 |
| C | 2 | 16 | 221512 | 1003.33 | 920 | 927 | 219.9 |
| C | 14 | 238 | 143964 | 650.6 | 920 | 927 | 219.9 |
| D | 1 | 52 | 987342 | 4454.51 | 916 | 893 | 221.4 |
| D | 7 | 80 | 607422 | 2738.91 | 916 | 893 | 221.4 |
| D | 12 | 233 | 66662 | 296.99 | 916 | 893 | 221.4 |
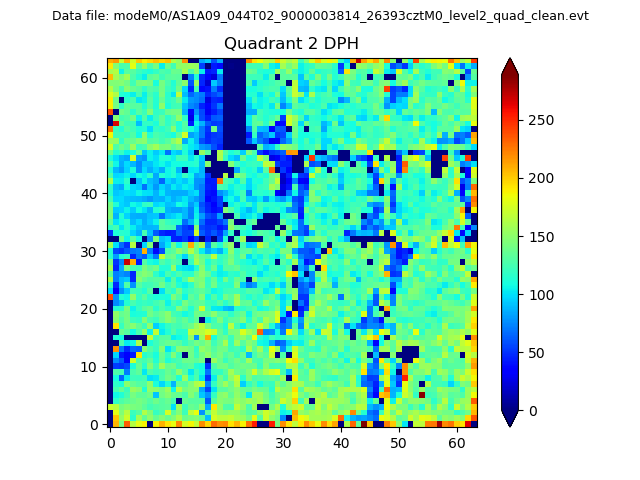
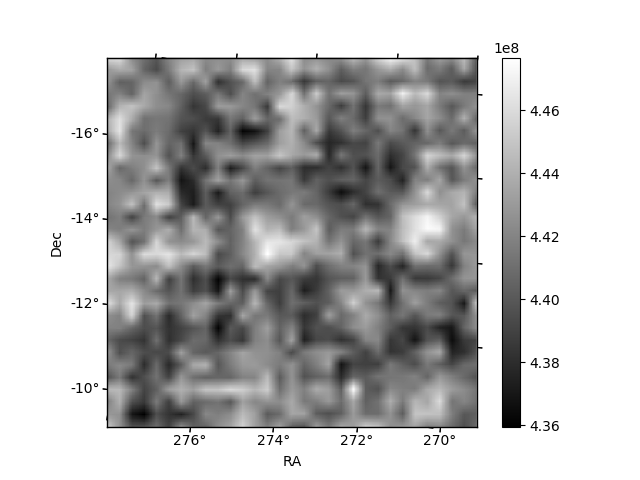
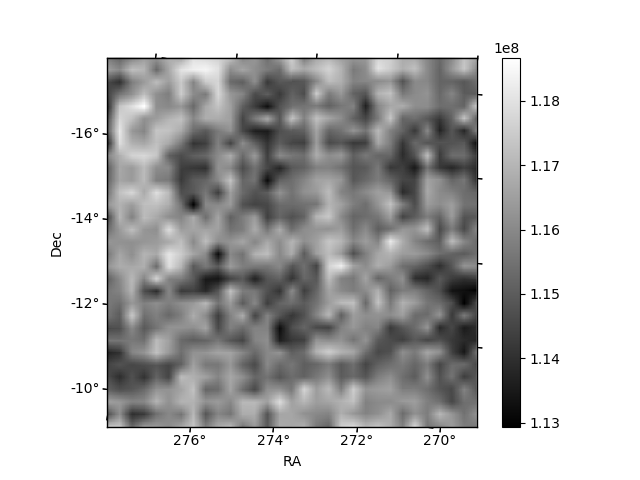
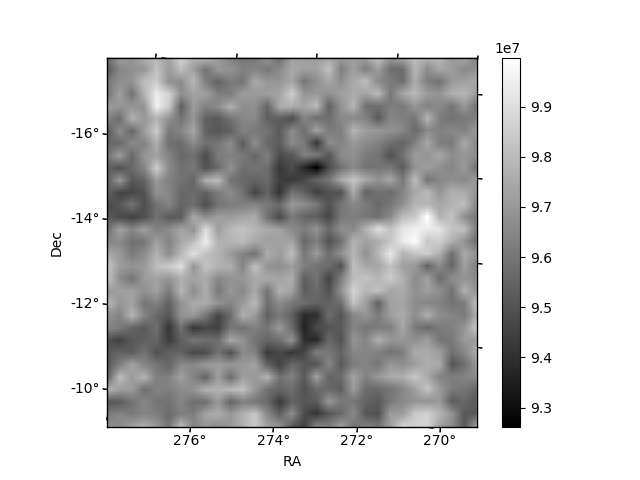
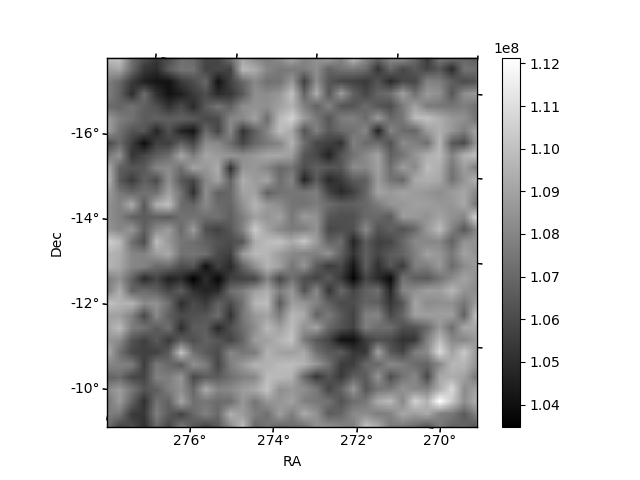
Histogram calculated using DETX and DETY for each event in the final _common_clean file
| Quadrant A | 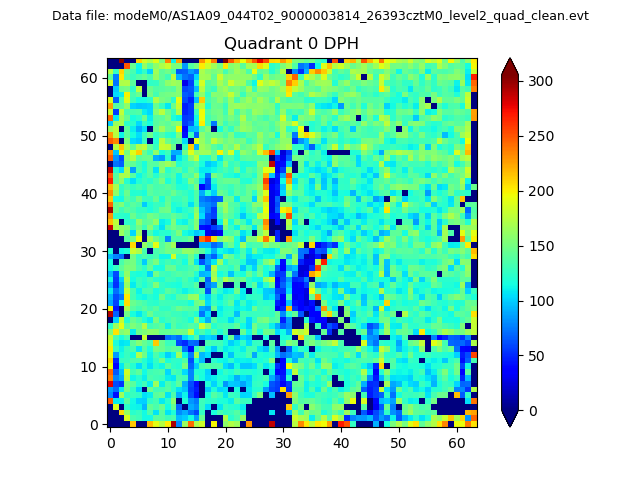 |
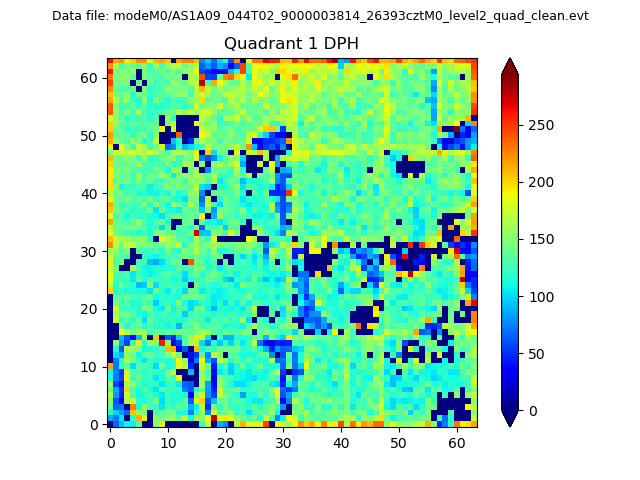 |
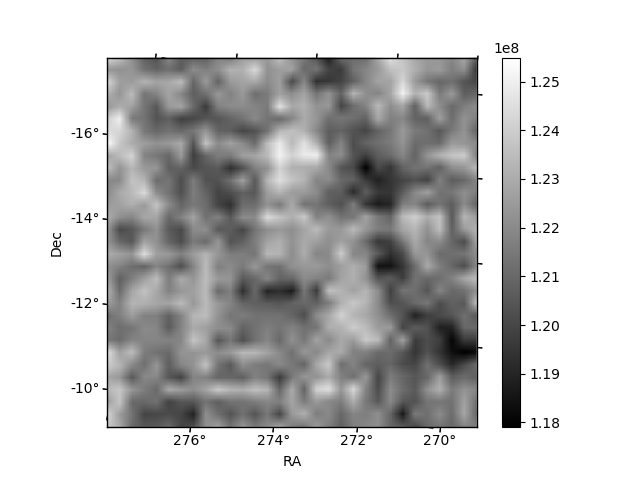
Quadrant B |
|---|---|---|---|
| Quadrant D | 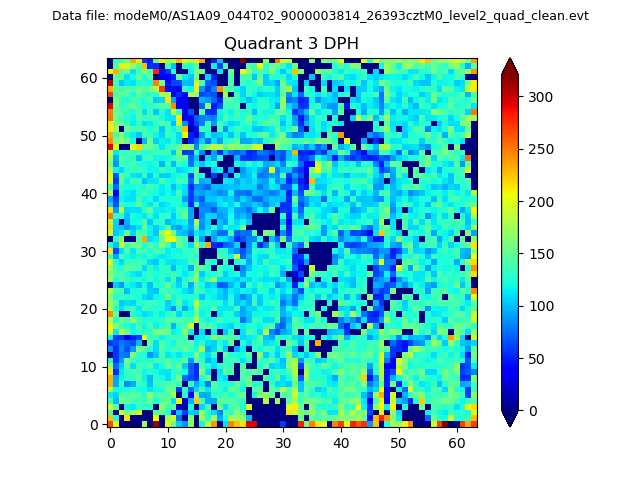 |
 |
Quadrant C |
| Plot type | Count rate plots | Images |
|---|---|---|
| Comparison with Poisson distribution Blue bars denote a histogram of data divided into 1 sec bins. Red curve is a Poisson curve with rate = median count rate of data. |
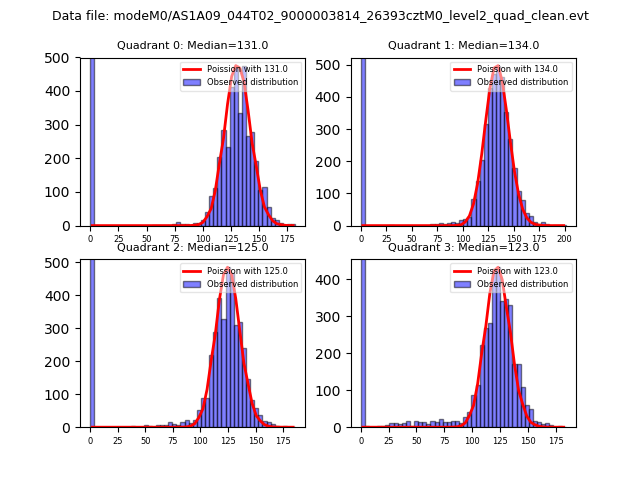 |
 |
| Quadrant-wise count rates Data is divided into 100 sec bins |
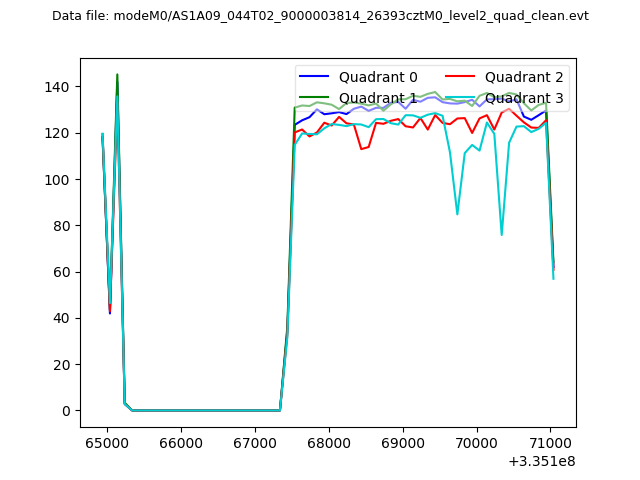 |
|
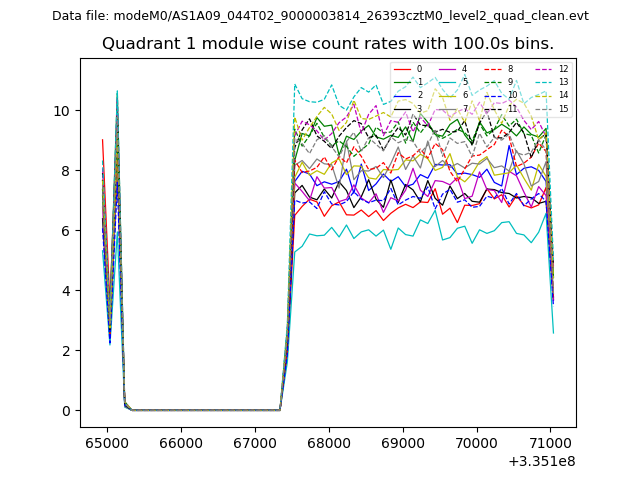
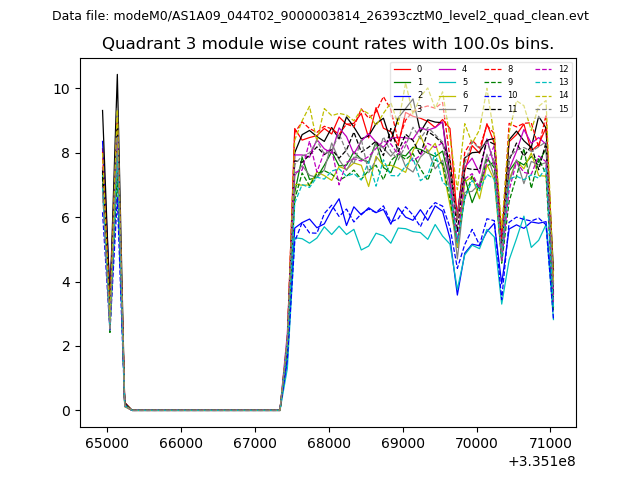
| Module-wise count rates for Quadrant A Data is divided into 100 sec bins |
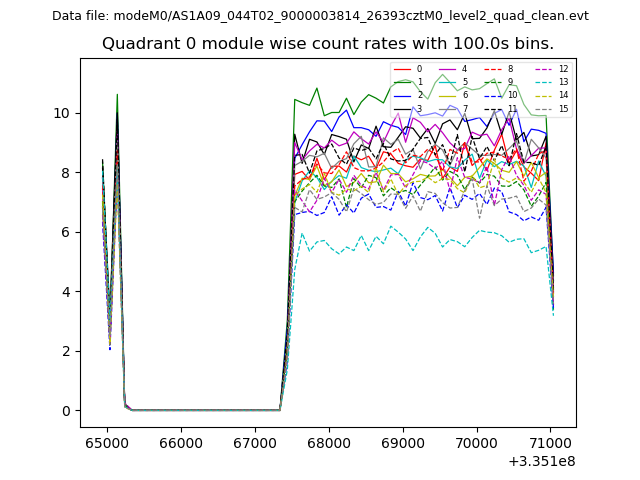 |
 |
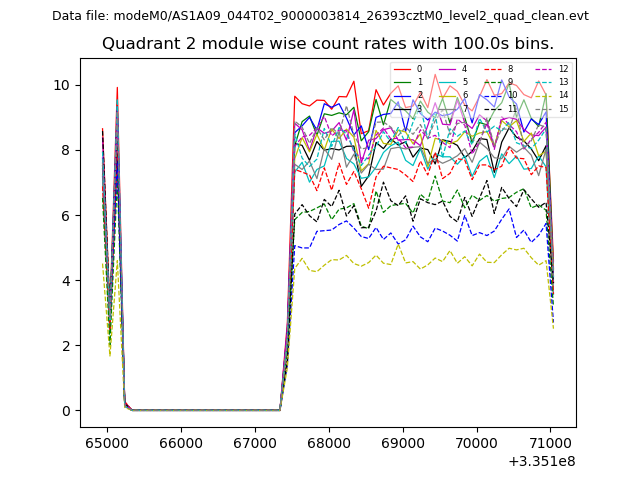
| Module-wise count rates for Quadrant B Data is divided into 100 sec bins |
 |
 |
| Module-wise count rates for Quadrant C Data is divided into 100 sec bins |
 |
 |
| Module-wise count rates for Quadrant D Data is divided into 100 sec bins |
 |
 |
| Parameter | Plot |
|---|---|
| CZT HV Monitor | 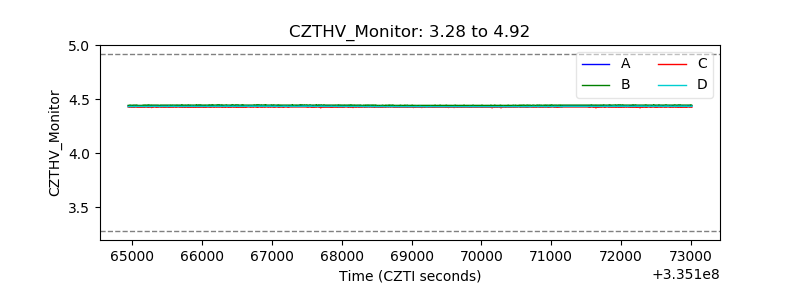 |
| D_VDD | 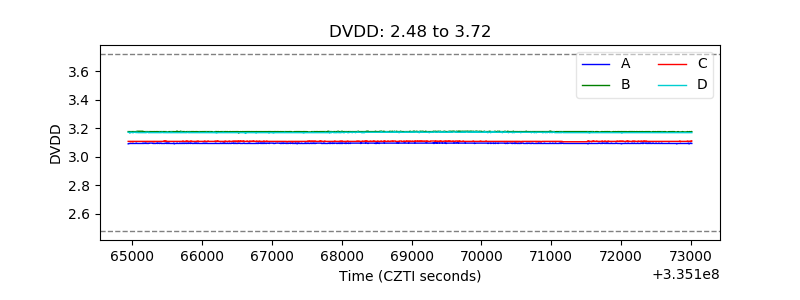 |
| Temperature 1 | 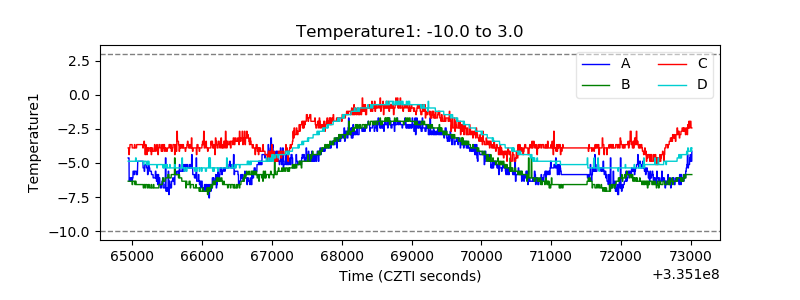 |
| Veto HV Monitor | 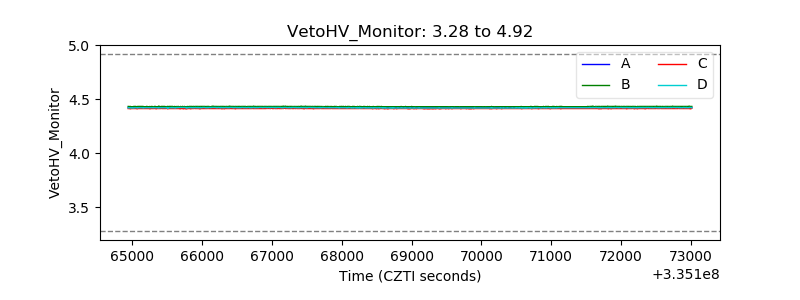 |
| Veto LLD | 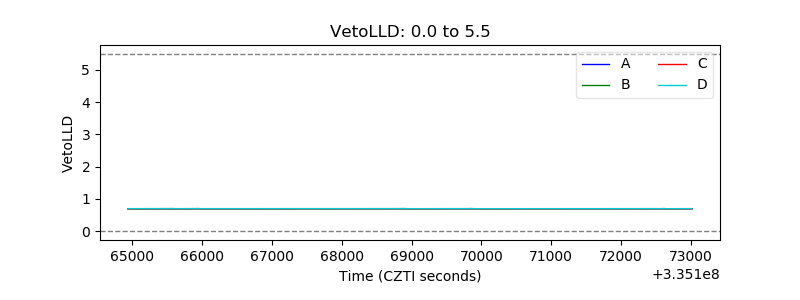 |
| Alpha Counter | 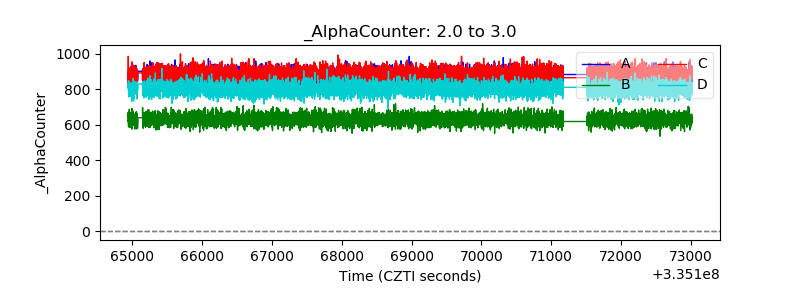 |
| _CPM_Rate | 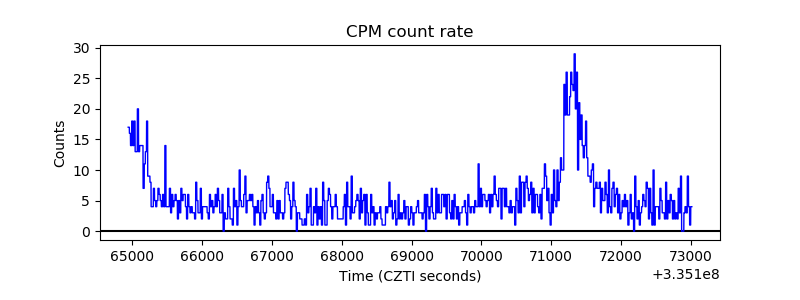 |
| CZT Counter | 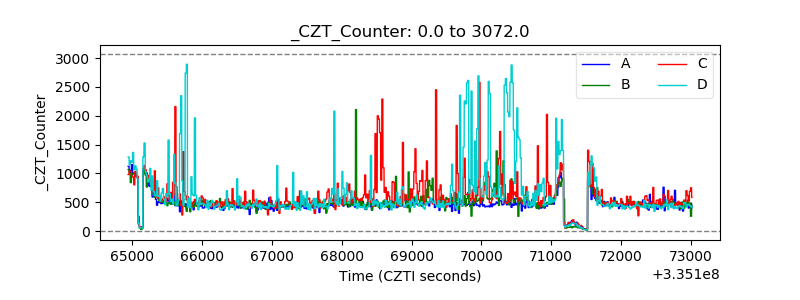 |
| +2.5 Volts monitor |  |
| +5 Volts monitor | 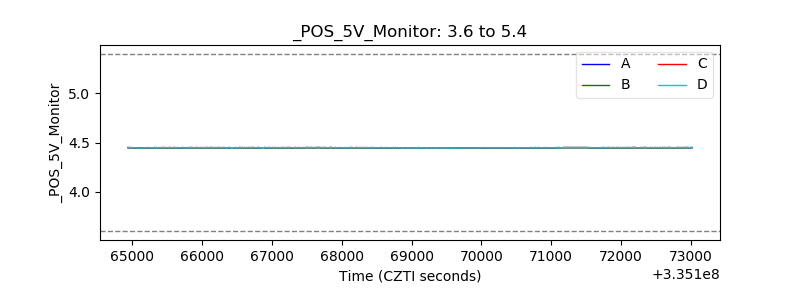 |
| _ROLL_ROT | 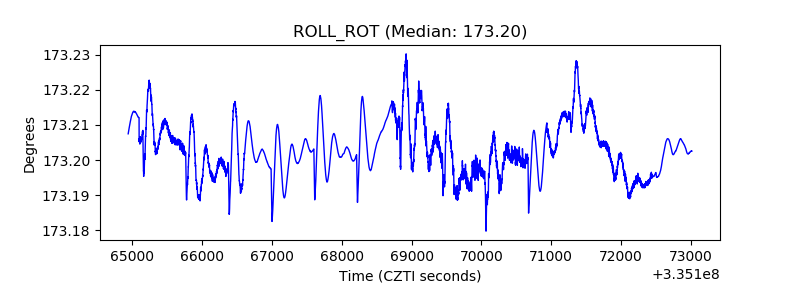 |
| _Roll_DEC | 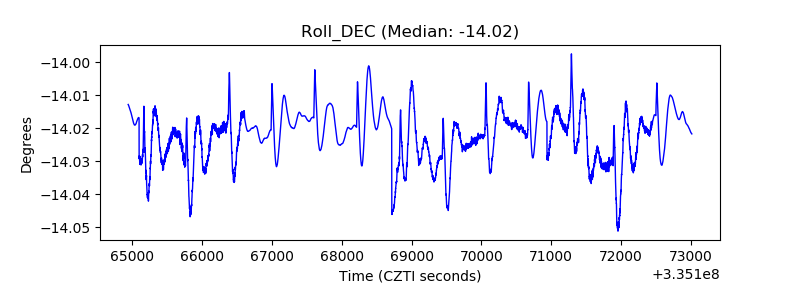 |
| _Roll_RA | 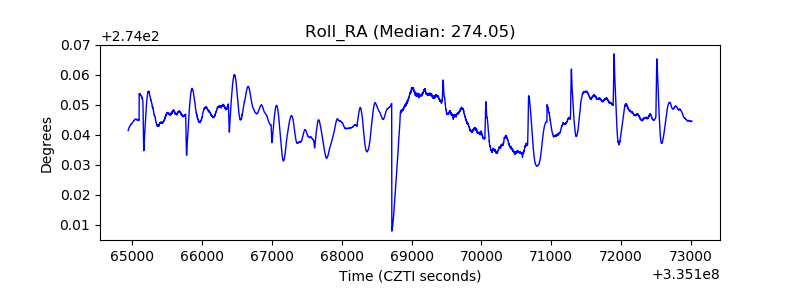 |
| Veto Counter | 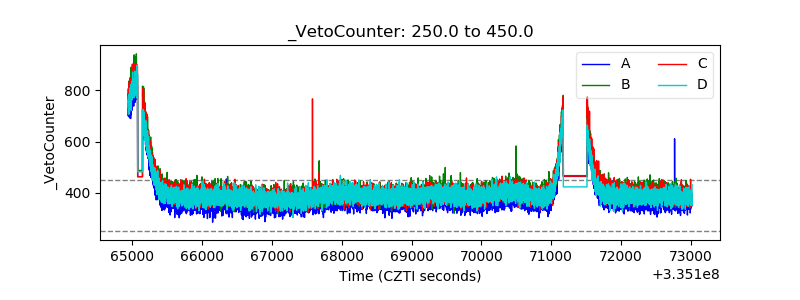 |