| Param | Original file | Final file |
|---|---|---|
| Filename | modeM0/AS1A09_127T01_9000003816cztM0_level2.fits | modeM0/AS1A09_127T01_9000003816cztM0_level2_quad_clean.evt |
| Size (bytes) | 561,899,520 | 423,509,760 |
| Size | 535.9 MB | 403.9 MB |
| Events in quadrant A | 3,509,776 | 2,375,043 |
| Events in quadrant B | 3,338,152 | 2,351,034 |
| Events in quadrant C | 3,296,730 | 2,136,301 |
| Events in quadrant D | 2,989,750 | 2,080,412 |
| Mode SS | |||
|---|---|---|---|
| Quadrant | BADHDUFLAG | Total packets | Discarded packets |
| A | 0 | 1146 | 0 |
| B | 0 | 1146 | 0 |
| C | 0 | 1146 | 0 |
| D | 0 | 1146 | 0 |
| Mode M0 | |||
|---|---|---|---|
| Quadrant | BADHDUFLAG | Total packets | Discarded packets |
| A | 0 | 119294 | 0 |
| B | 0 | 134983 | 0 |
| C | 0 | 164565 | 0 |
| D | 0 | 128809 | 0 |
| Mode M9 | |||
|---|---|---|---|
| Quadrant | BADHDUFLAG | Total packets | Discarded packets |
| A | 0 | 100 | 0 |
| B | 0 | 100 | 0 |
| C | 0 | 100 | 0 |
| D | 0 | 100 | 0 |
| Quadrant | Total seconds | Saturated seconds | Saturation percentage |
|---|---|---|---|
| A | 56587 | 597 | 1.055013% |
| B | 56587 | 1936 | 3.421281% |
| C | 56587 | 4675 | 8.261615% |
| D | 56587 | 1015 | 1.793698% |
Noise dominated data is calculated using 1-second bins in cleaned event files. If a bin has >2000 counts, and if more than 50% of those come from <1% of pixels, then it is considered to be noise-dominated and hence unusable.
| Quadrant | # 1 sec bins | Bins with >0 counts | Bins with >2000 counts | High rate bins dominated by noise | Noise dominated (total time) | Noise dominated (detector-on time) | Marked lightcurve |
|---|---|---|---|---|---|---|---|
| A | 66372 | 56587 | 0 | 0 | 0.00% | 0.00% |  |
| B | 66372 | 56576 | 0 | 0 | 0.00% | 0.00% |  |
| C | 66372 | 56548 | 0 | 0 | 0.00% | 0.00% |  |
| D | 66372 | 56581 | 0 | 0 | 0.00% | 0.00% |  |
Top three noisy pixels from each quadrant. If the there are fewer than three noisy pixels in the level2.evt file, extra rows are filled as -1
| Pixel properties | Quadrant properties | ||||||
|---|---|---|---|---|---|---|---|
| Quadrant | DetID | PixID | Counts | Sigma | Mean | Median | Sigma |
| A | 0 | 29 | 2863 | 8.93 | 914 | 860 | 224.3 |
| A | 7 | 110 | 2794 | 8.62 | 914 | 860 | 224.3 |
| A | 9 | 19 | 2581 | 7.67 | 914 | 860 | 224.3 |
| B | 2 | 9 | 2640 | 10.42 | 885 | 850 | 171.8 |
| B | 5 | 128 | 2229 | 8.03 | 885 | 850 | 171.8 |
| B | 2 | 8 | 2223 | 7.99 | 885 | 850 | 171.8 |
| C | 1 | 81 | 2687 | 8.5 | 870 | 818 | 220.0 |
| C | 1 | 80 | 2668 | 8.41 | 870 | 818 | 220.0 |
| C | 12 | 241 | 2416 | 7.26 | 870 | 818 | 220.0 |
| D | 15 | 46 | 2144 | 6.1 | 853 | 780 | 223.5 |
| D | 10 | 189 | 2143 | 6.1 | 853 | 780 | 223.5 |
| D | 6 | 67 | 2107 | 5.94 | 853 | 780 | 223.5 |
Histogram calculated using DETX and DETY for each event in the final _common_clean file
| Quadrant A |  |
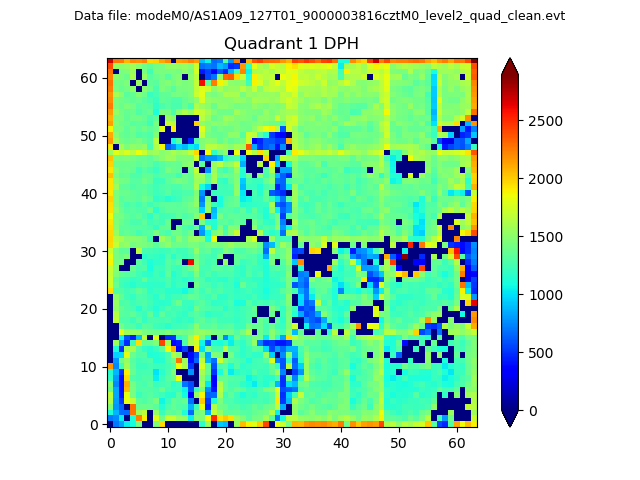 |
Quadrant B |
|---|---|---|---|
| Quadrant D |  |
 |
Quadrant C |
| Plot type | Count rate plots | Images |
|---|---|---|
| Comparison with Poisson distribution Blue bars denote a histogram of data divided into 1 sec bins. Red curve is a Poisson curve with rate = median count rate of data. |
 |
 |
| Quadrant-wise count rates Data is divided into 100 sec bins |
 |
|
| Module-wise count rates for Quadrant A Data is divided into 100 sec bins |
 |
 |
| Module-wise count rates for Quadrant B Data is divided into 100 sec bins |
 |
 |
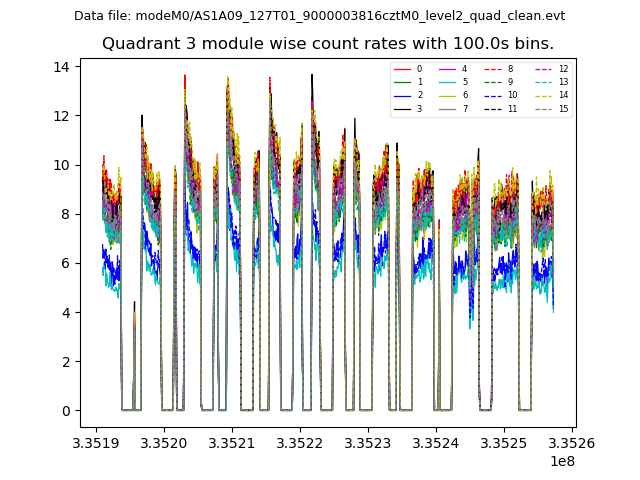
| Module-wise count rates for Quadrant C Data is divided into 100 sec bins |
 |
 |
| Module-wise count rates for Quadrant D Data is divided into 100 sec bins |
 |
 |
| Parameter | Plot |
|---|---|
| CZT HV Monitor |  |
| D_VDD | 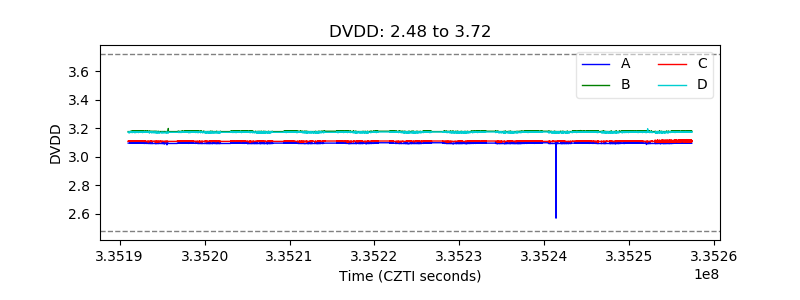 |
| Temperature 1 |  |
| Veto HV Monitor |  |
| Veto LLD |  |
| Alpha Counter | 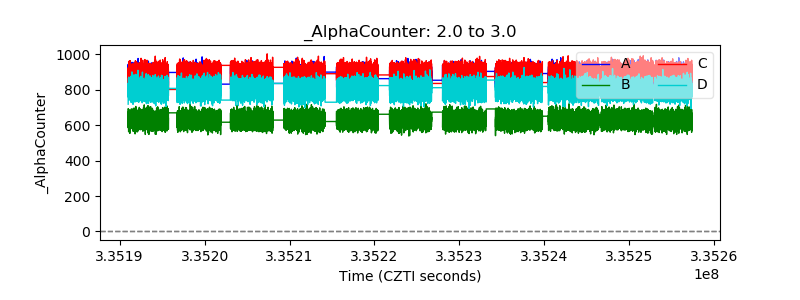 |
| _CPM_Rate | 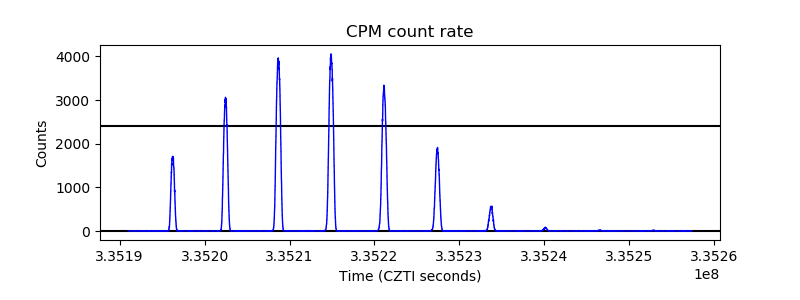 |
| CZT Counter | 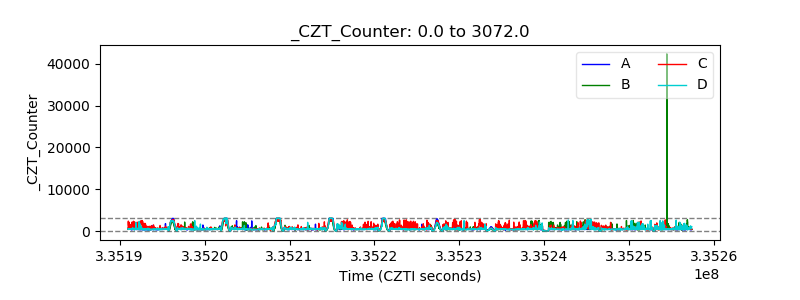 |
| +2.5 Volts monitor | 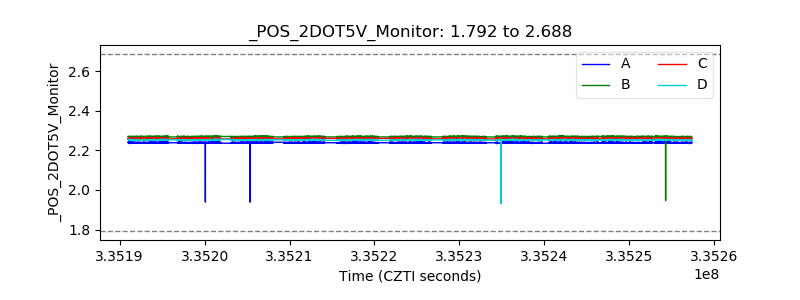 |
| +5 Volts monitor |  |
| _ROLL_ROT |  |
| _Roll_DEC |  |
| _Roll_RA |  |
| Veto Counter |  |