| Param | Original file | Final file |
|---|---|---|
| Filename | modeM0/AS1A09_127T01_9000003816_26397cztM0_level2.evt | modeM0/AS1A09_127T01_9000003816_26397cztM0_level2_quad_clean.evt |
| Size (bytes) | 524,079,360 | 88,338,240 |
| Size | 499.8 MB | 84.2 MB |
| Events in quadrant A | 3,002,299 | 581,217 |
| Events in quadrant B | 3,391,852 | 583,109 |
| Events in quadrant C | 5,973,965 | 522,842 |
| Events in quadrant D | 3,085,212 | 556,817 |
| Mode M0 | |||
|---|---|---|---|
| Quadrant | BADHDUFLAG | Total packets | Discarded packets |
| A | 0 | 13006 | 0 |
| B | 0 | 13743 | 0 |
| C | 0 | 21985 | 0 |
| D | 0 | 13310 | 0 |
| Mode M9 | |||
|---|---|---|---|
| Quadrant | BADHDUFLAG | Total packets | Discarded packets |
| A | 0 | 10 | 0 |
| B | 0 | 10 | 0 |
| C | 0 | 10 | 0 |
| D | 0 | 10 | 0 |
| Quadrant | Total seconds | Saturated seconds | Saturation percentage |
|---|---|---|---|
| A | 6170 | 49 | 0.794165% |
| B | 6170 | 77 | 1.247974% |
| C | 6170 | 754 | 12.220421% |
| D | 6170 | 44 | 0.713128% |
Noise dominated data is calculated using 1-second bins in cleaned event files. If a bin has >2000 counts, and if more than 50% of those come from <1% of pixels, then it is considered to be noise-dominated and hence unusable.
| Quadrant | # 1 sec bins | Bins with >0 counts | Bins with >2000 counts | High rate bins dominated by noise | Noise dominated (total time) | Noise dominated (detector-on time) | Marked lightcurve |
|---|---|---|---|---|---|---|---|
| A | 7190 | 6171 | 14 | 14 | 0.19% | 0.23% | 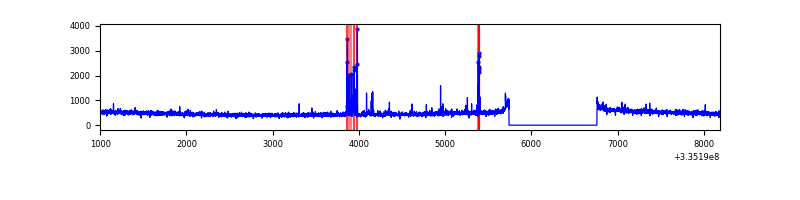 |
| B | 7190 | 6171 | 26 | 26 | 0.36% | 0.42% | 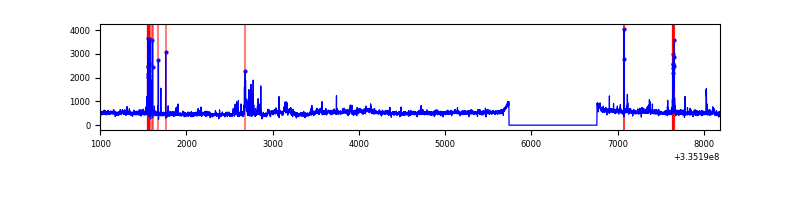 |
| C | 7190 | 6171 | 434 | 434 | 6.04% | 7.03% | 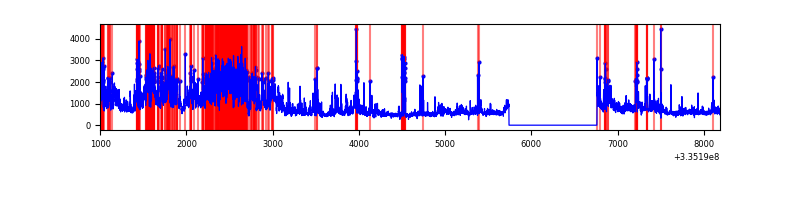 |
| D | 7190 | 6171 | 23 | 23 | 0.32% | 0.37% | 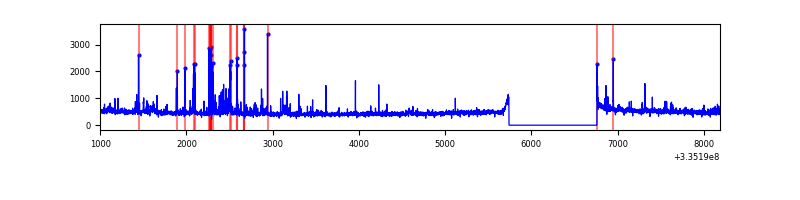 |
Top three noisy pixels from each quadrant. If the there are fewer than three noisy pixels in the level2.evt file, extra rows are filled as -1
| Pixel properties | Quadrant properties | ||||||
|---|---|---|---|---|---|---|---|
| Quadrant | DetID | PixID | Counts | Sigma | Mean | Median | Sigma |
| A | 0 | 13 | 110166 | 723.07 | 747 | 730 | 151.3 |
| A | 13 | 254 | 10828 | 66.72 | 747 | 730 | 151.3 |
| A | 6 | 16 | 8000 | 48.03 | 747 | 730 | 151.3 |
| B | 3 | 112 | 259451 | 1852.13 | 740 | 722 | 139.7 |
| B | 5 | 172 | 173778 | 1238.84 | 740 | 722 | 139.7 |
| B | 0 | 244 | 40613 | 285.56 | 740 | 722 | 139.7 |
| C | 3 | 233 | 2887866 | 17669.92 | 697 | 700 | 163.4 |
| C | 4 | 254 | 133173 | 810.76 | 697 | 700 | 163.4 |
| C | 2 | 16 | 115240 | 701.0 | 697 | 700 | 163.4 |
| D | 12 | 233 | 129980 | 740.92 | 731 | 713 | 174.5 |
| D | 1 | 52 | 95574 | 543.71 | 731 | 713 | 174.5 |
| D | 7 | 80 | 56162 | 317.82 | 731 | 713 | 174.5 |
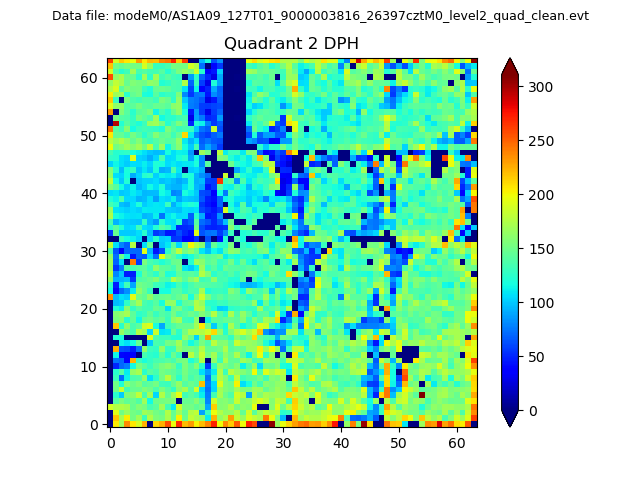
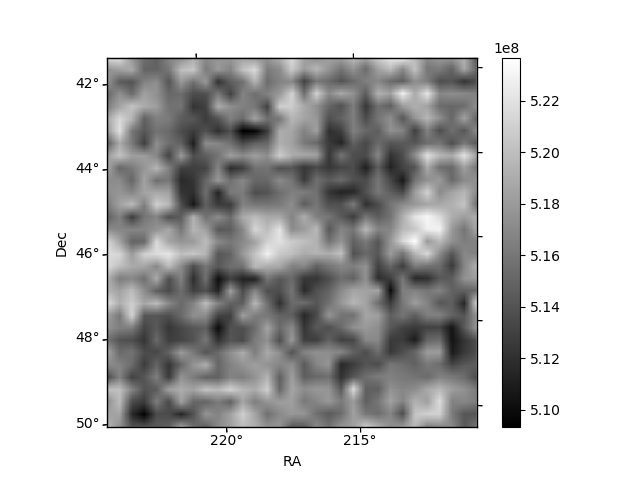
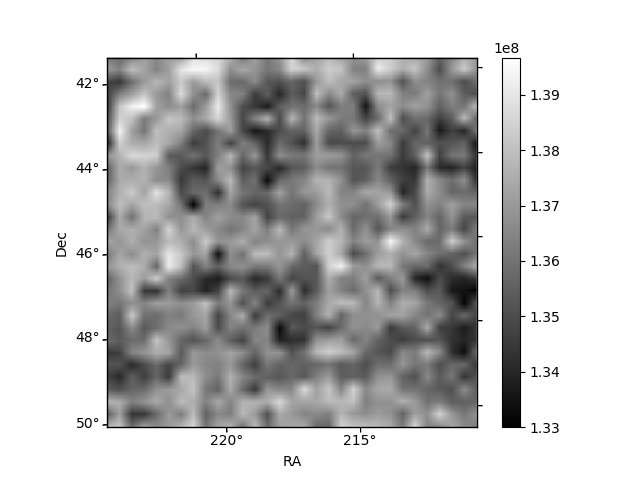
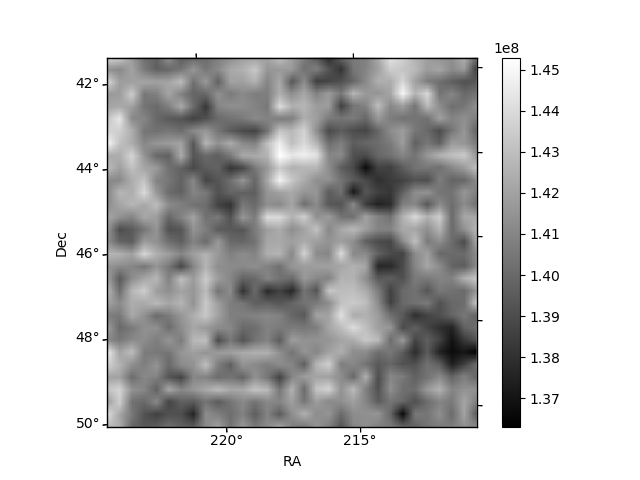
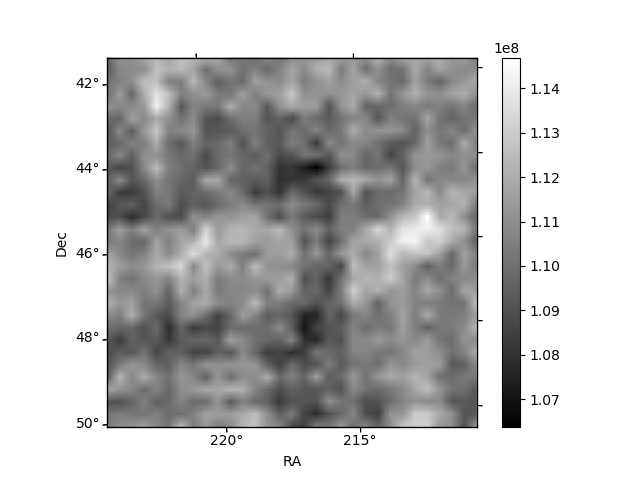
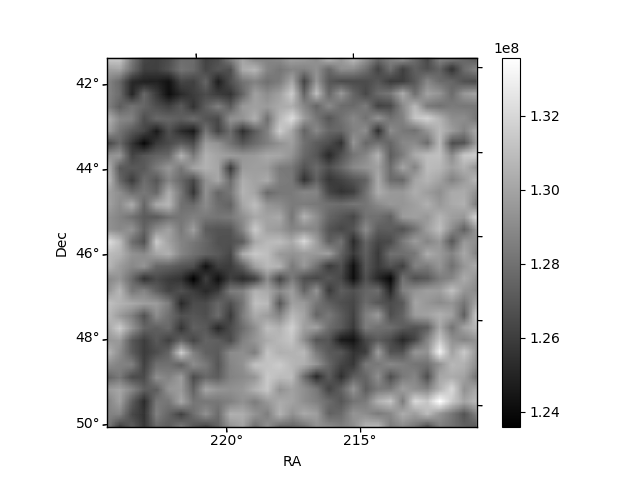
Histogram calculated using DETX and DETY for each event in the final _common_clean file
| Quadrant A | 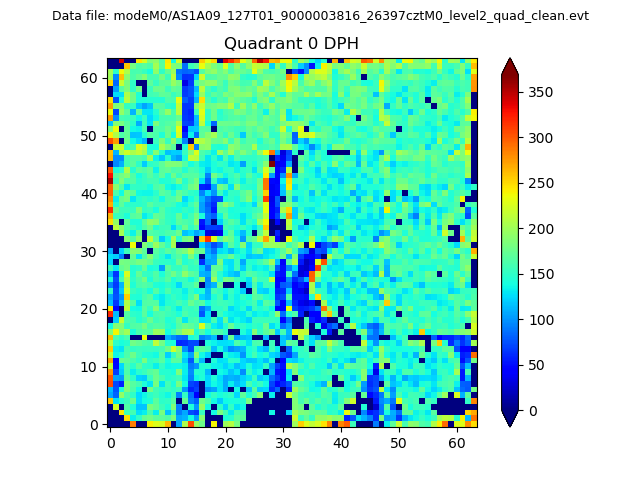 |
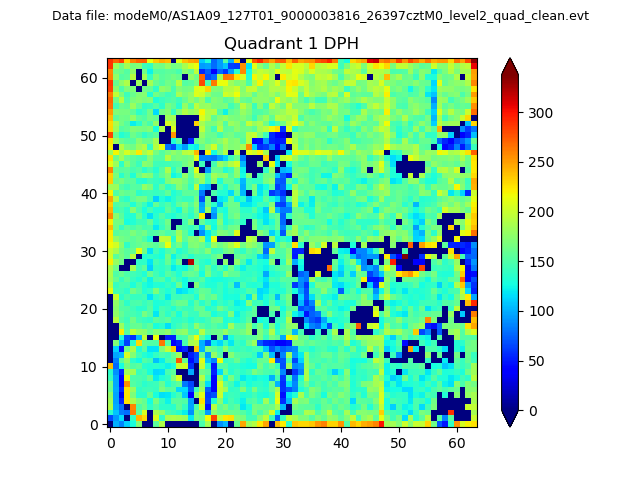 |
Quadrant B |
|---|---|---|---|
| Quadrant D | 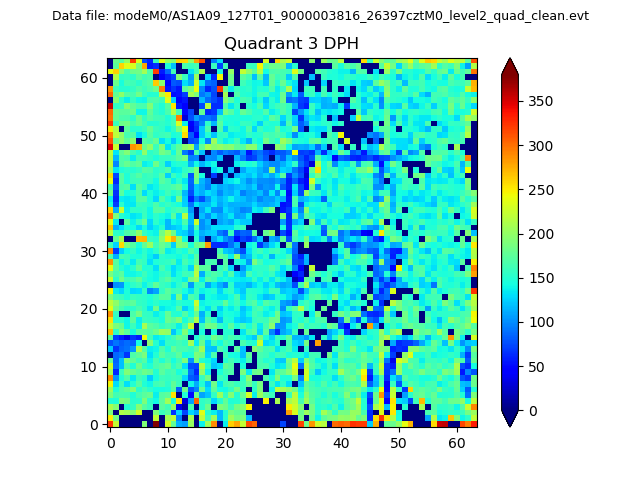 |
 |
Quadrant C |
| Plot type | Count rate plots | Images |
|---|---|---|
| Comparison with Poisson distribution Blue bars denote a histogram of data divided into 1 sec bins. Red curve is a Poisson curve with rate = median count rate of data. |
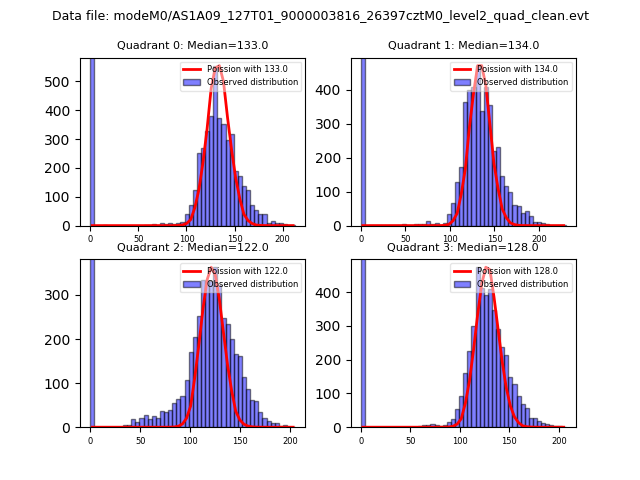 |
 |
| Quadrant-wise count rates Data is divided into 100 sec bins |
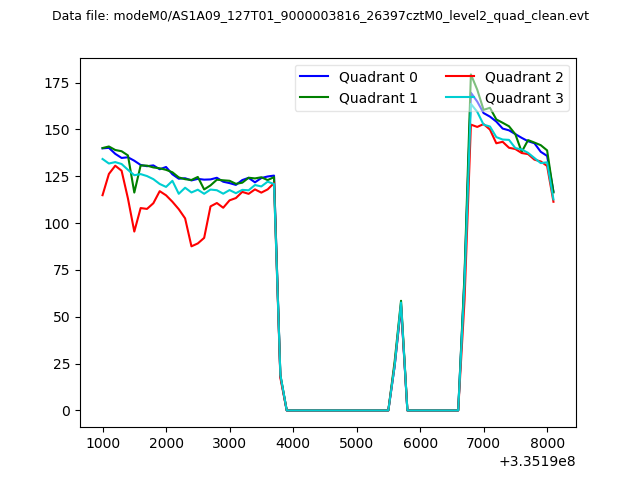 |
|
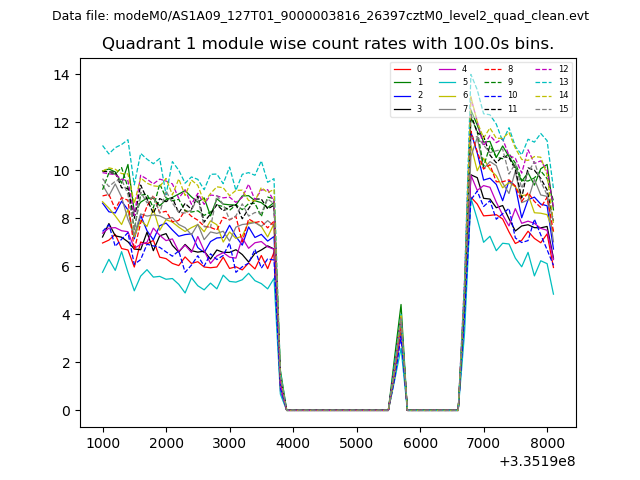
| Module-wise count rates for Quadrant A Data is divided into 100 sec bins |
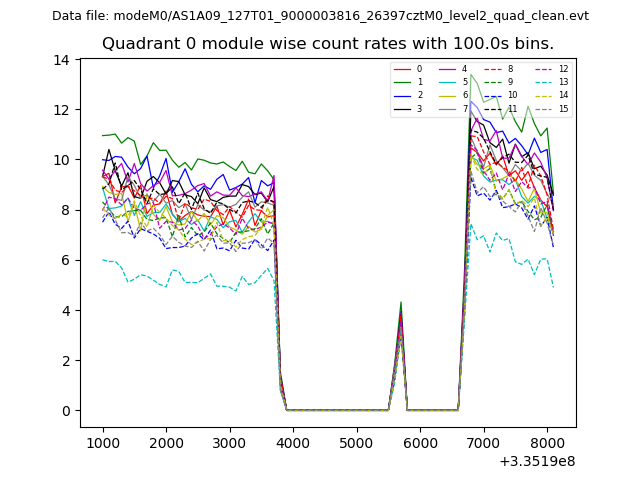 |
 |
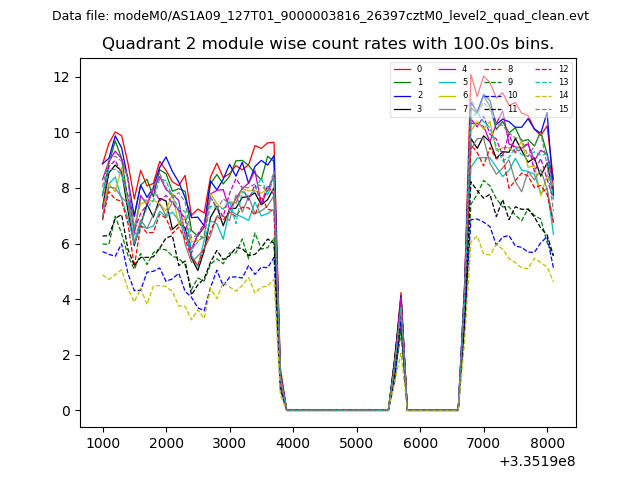
| Module-wise count rates for Quadrant B Data is divided into 100 sec bins |
 |
 |
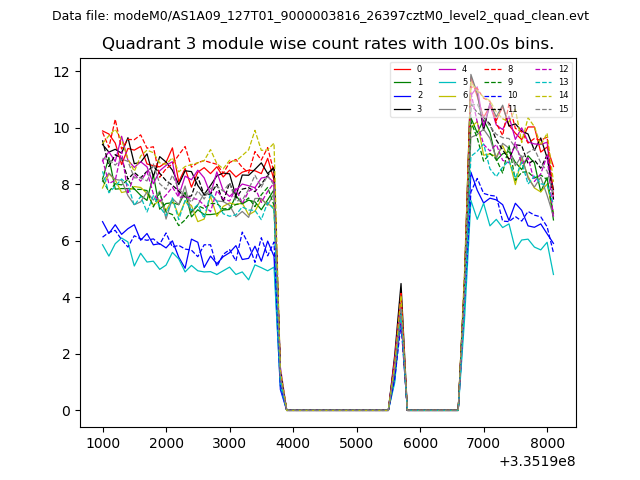
| Module-wise count rates for Quadrant C Data is divided into 100 sec bins |
 |
 |
| Module-wise count rates for Quadrant D Data is divided into 100 sec bins |
 |
 |
| Parameter | Plot |
|---|---|
| CZT HV Monitor | 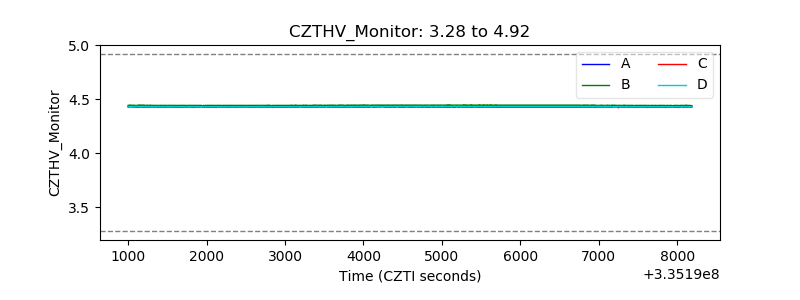 |
| D_VDD | 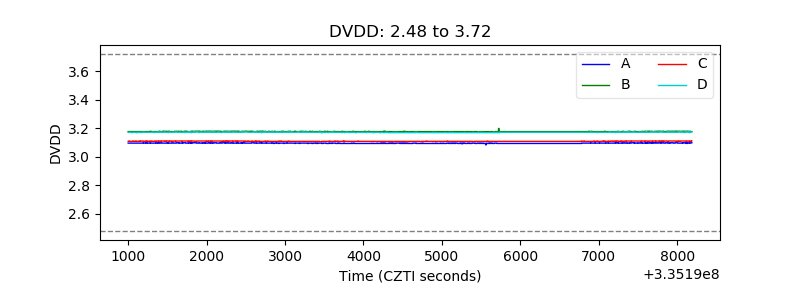 |
| Temperature 1 | 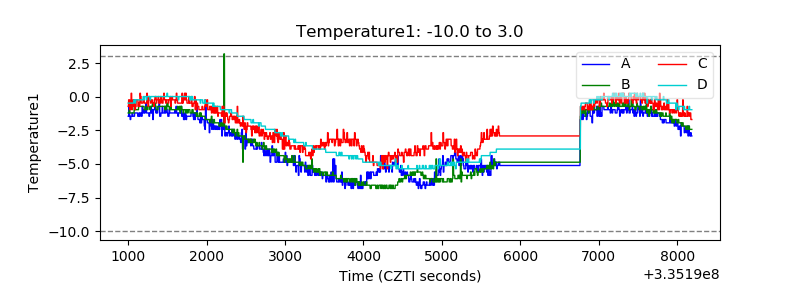 |
| Veto HV Monitor | 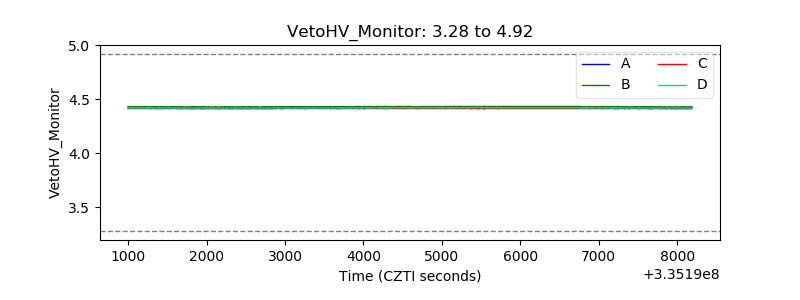 |
| Veto LLD |  |
| Alpha Counter | 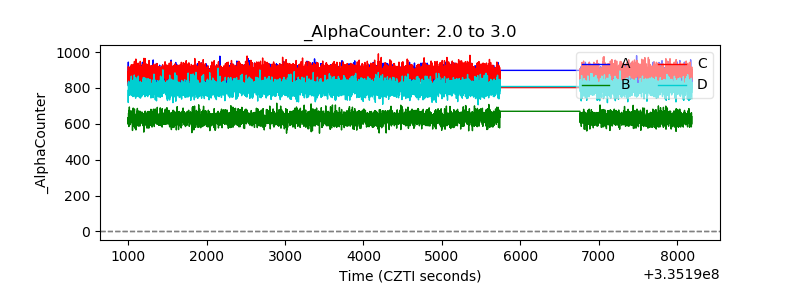 |
| _CPM_Rate | 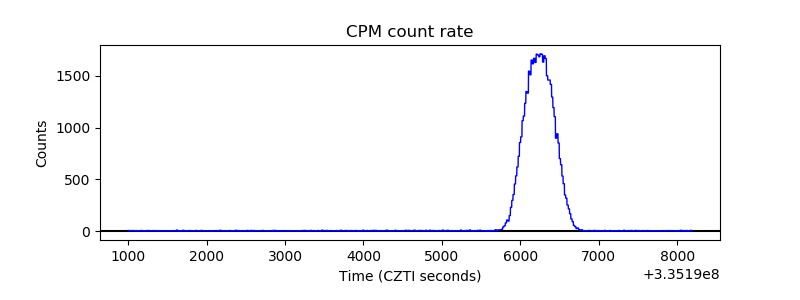 |
| CZT Counter | 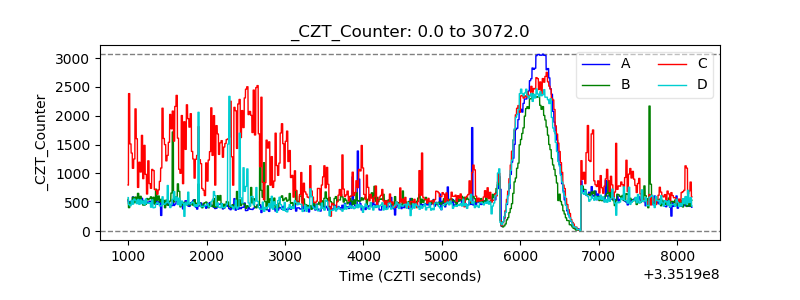 |
| +2.5 Volts monitor |  |
| +5 Volts monitor |  |
| _ROLL_ROT |  |
| _Roll_DEC | 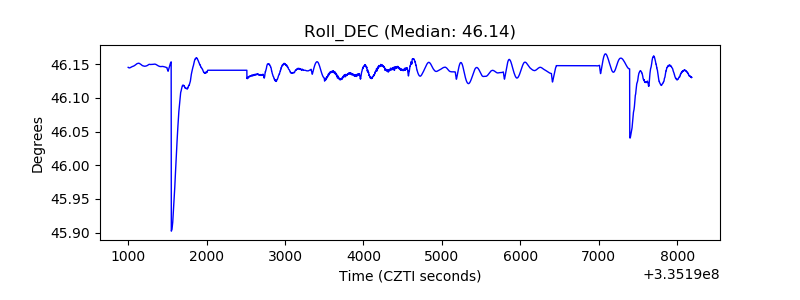 |
| _Roll_RA | 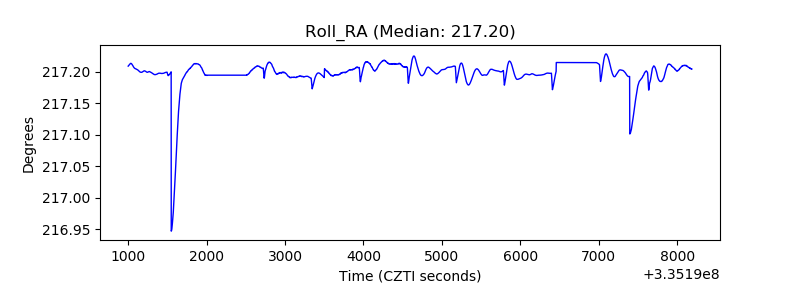 |
| Veto Counter |  |