| Param | Original file | Final file |
|---|---|---|
| Filename | modeM0/AS1A09_127T01_9000003816_26400cztM0_level2.evt | modeM0/AS1A09_127T01_9000003816_26400cztM0_level2_quad_clean.evt |
| Size (bytes) | 455,060,160 | 102,300,480 |
| Size | 434.0 MB | 97.6 MB |
| Events in quadrant A | 3,330,044 | 671,520 |
| Events in quadrant B | 3,497,882 | 691,358 |
| Events in quadrant C | 3,366,973 | 657,253 |
| Events in quadrant D | 3,165,128 | 644,791 |
| Mode M0 | |||
|---|---|---|---|
| Quadrant | BADHDUFLAG | Total packets | Discarded packets |
| A | 0 | 13888 | 0 |
| B | 0 | 14357 | 0 |
| C | 0 | 14029 | 0 |
| D | 0 | 13553 | 0 |
| Mode M9 | |||
|---|---|---|---|
| Quadrant | BADHDUFLAG | Total packets | Discarded packets |
| A | 0 | 13 | 0 |
| B | 0 | 13 | 0 |
| C | 0 | 13 | 0 |
| D | 0 | 13 | 0 |
| Quadrant | Total seconds | Saturated seconds | Saturation percentage |
|---|---|---|---|
| A | 6208 | 74 | 1.192010% |
| B | 6208 | 65 | 1.047036% |
| C | 6208 | 88 | 1.417526% |
| D | 6209 | 45 | 0.724754% |
Noise dominated data is calculated using 1-second bins in cleaned event files. If a bin has >2000 counts, and if more than 50% of those come from <1% of pixels, then it is considered to be noise-dominated and hence unusable.
| Quadrant | # 1 sec bins | Bins with >0 counts | Bins with >2000 counts | High rate bins dominated by noise | Noise dominated (total time) | Noise dominated (detector-on time) | Marked lightcurve |
|---|---|---|---|---|---|---|---|
| A | 7483 | 6209 | 30 | 30 | 0.40% | 0.48% | 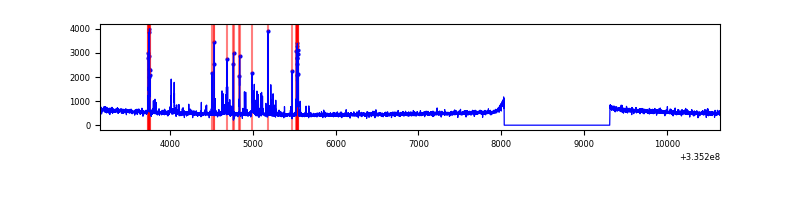 |
| B | 7483 | 6209 | 15 | 15 | 0.20% | 0.24% | 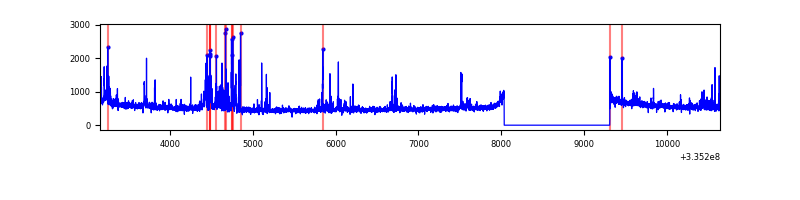 |
| C | 7483 | 6209 | 10 | 10 | 0.13% | 0.16% | 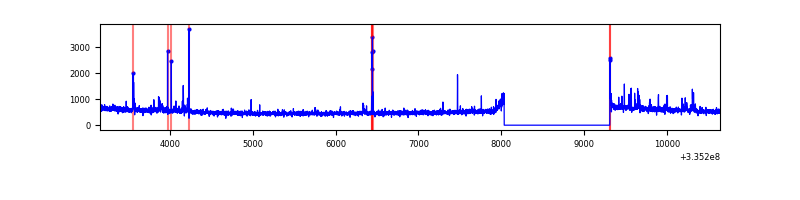 |
| D | 7484 | 6210 | 12 | 12 | 0.16% | 0.19% | 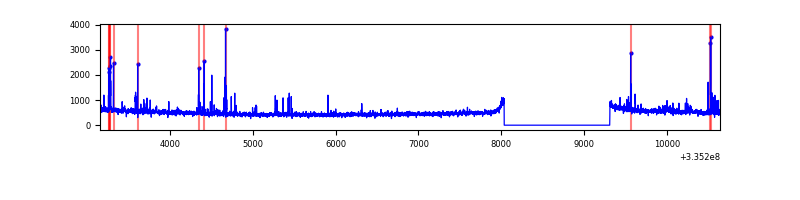 |
Top three noisy pixels from each quadrant. If the there are fewer than three noisy pixels in the level2.evt file, extra rows are filled as -1
| Pixel properties | Quadrant properties | ||||||
|---|---|---|---|---|---|---|---|
| Quadrant | DetID | PixID | Counts | Sigma | Mean | Median | Sigma |
| A | 0 | 13 | 253616 | 1608.02 | 794 | 778 | 157.2 |
| A | 13 | 254 | 10834 | 63.95 | 794 | 778 | 157.2 |
| A | 6 | 16 | 10132 | 59.49 | 794 | 778 | 157.2 |
| B | 5 | 172 | 181463 | 1215.62 | 802 | 784 | 148.6 |
| B | 0 | 189 | 106457 | 710.98 | 802 | 784 | 148.6 |
| B | 0 | 244 | 51968 | 344.37 | 802 | 784 | 148.6 |
| C | 3 | 233 | 185400 | 1031.84 | 777 | 786 | 178.9 |
| C | 14 | 238 | 124749 | 692.85 | 777 | 786 | 178.9 |
| C | 0 | 207 | 13745 | 72.43 | 777 | 786 | 178.9 |
| D | 12 | 233 | 69240 | 368.92 | 783 | 765 | 185.6 |
| D | 1 | 52 | 36927 | 194.83 | 783 | 765 | 185.6 |
| D | 10 | 1 | 34212 | 180.2 | 783 | 765 | 185.6 |
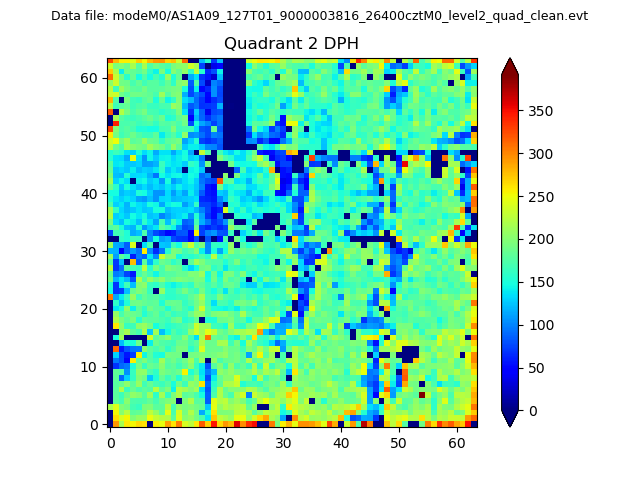
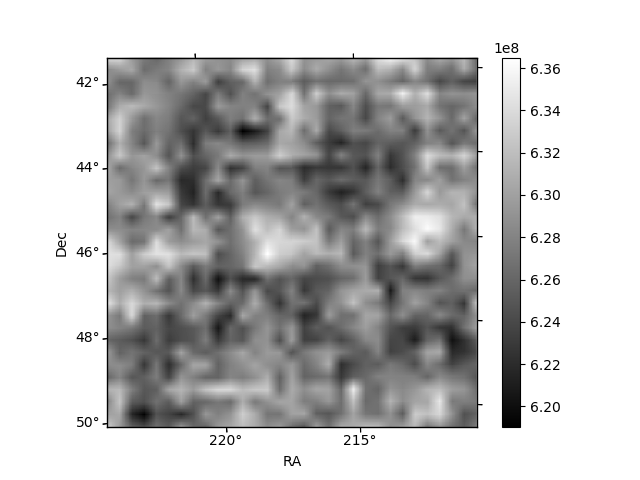
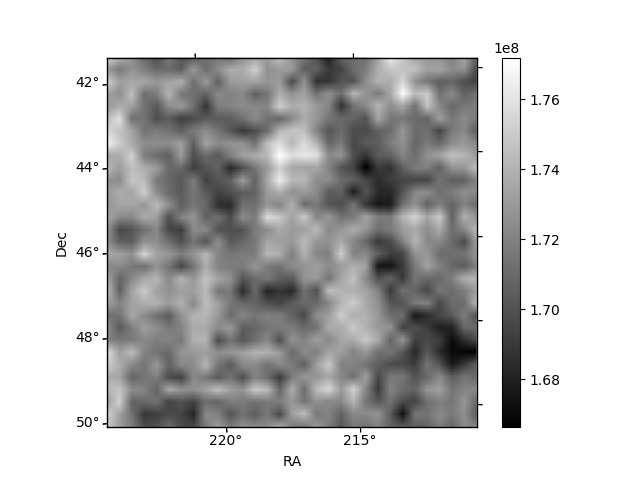
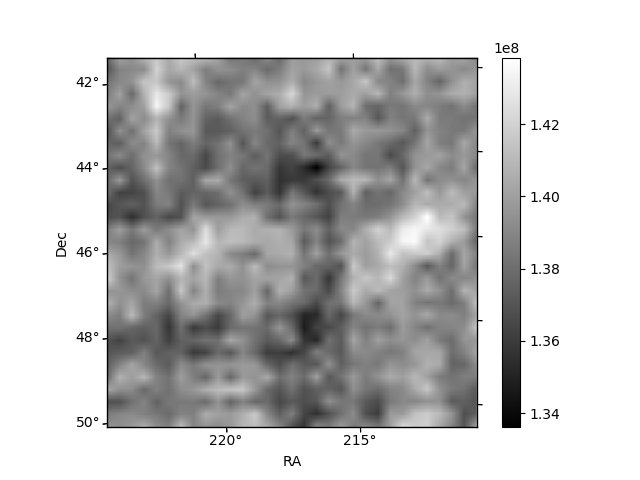
Histogram calculated using DETX and DETY for each event in the final _common_clean file
| Quadrant A | 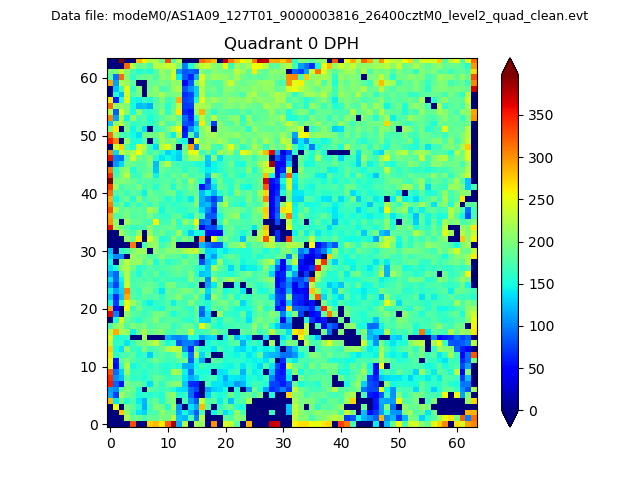 |
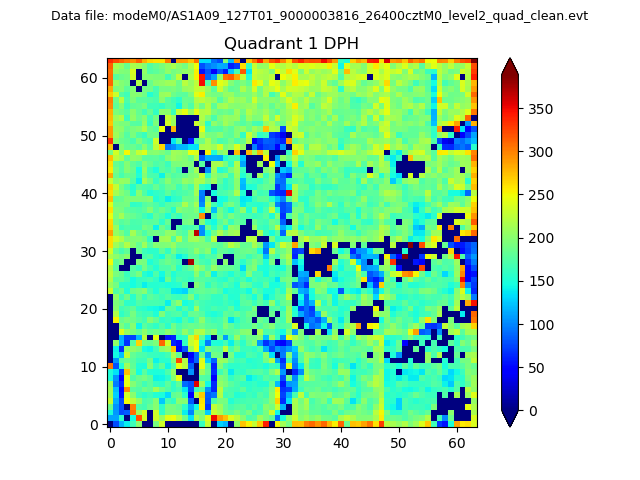 |
Quadrant B |
|---|---|---|---|
| Quadrant D | 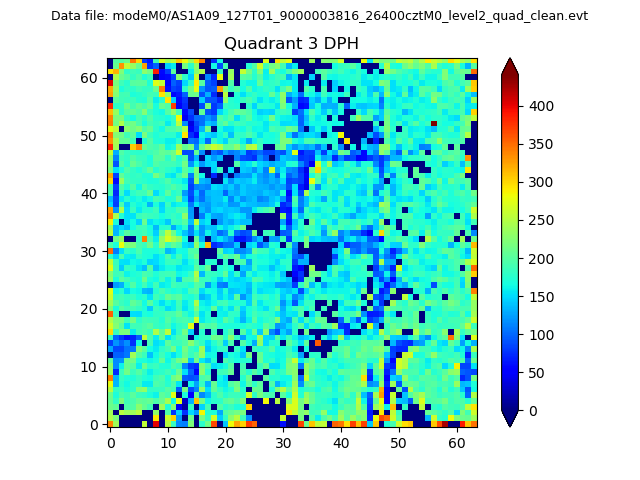 |
 |
Quadrant C |
| Plot type | Count rate plots | Images |
|---|---|---|
| Comparison with Poisson distribution Blue bars denote a histogram of data divided into 1 sec bins. Red curve is a Poisson curve with rate = median count rate of data. |
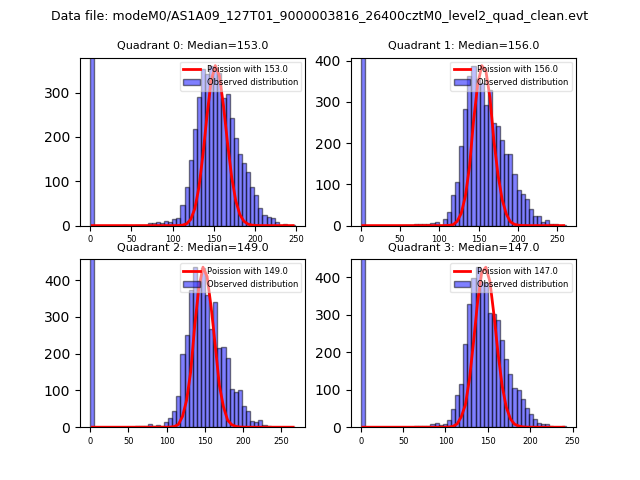 |
 |
| Quadrant-wise count rates Data is divided into 100 sec bins |
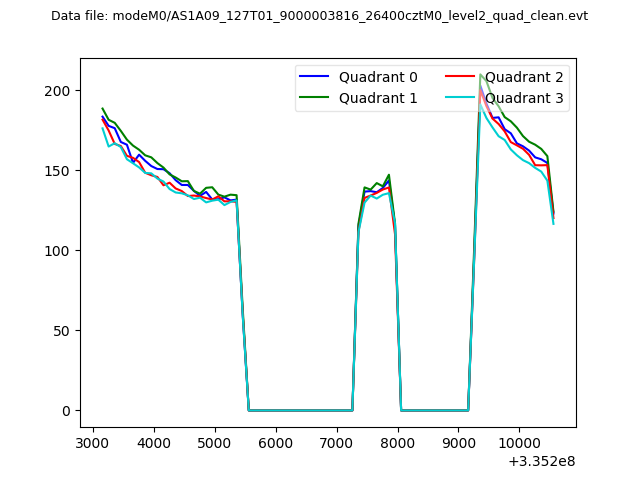 |
|
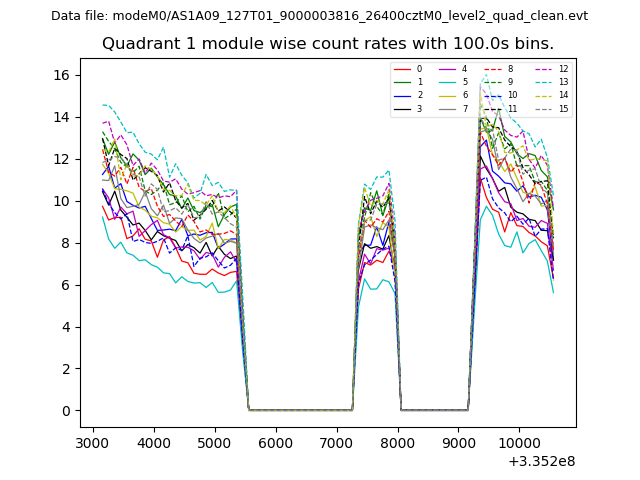
| Module-wise count rates for Quadrant A Data is divided into 100 sec bins |
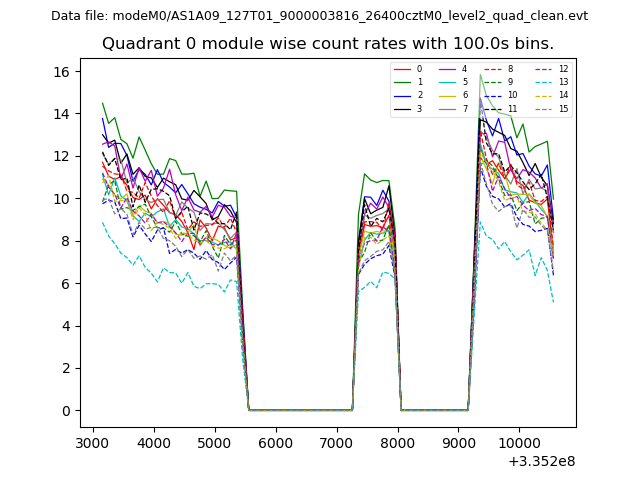 |
 |
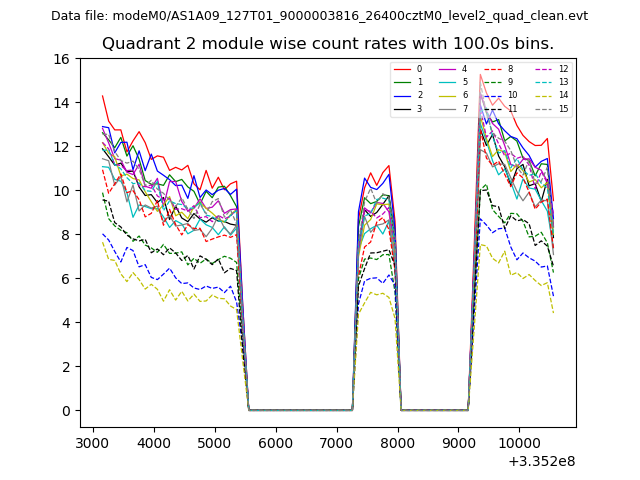
| Module-wise count rates for Quadrant B Data is divided into 100 sec bins |
 |
 |
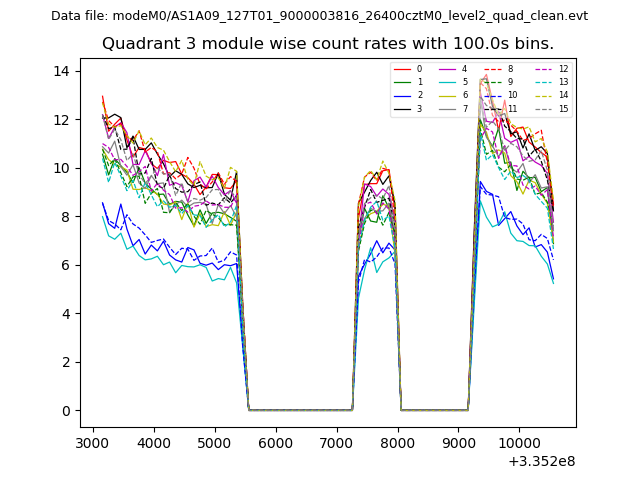
| Module-wise count rates for Quadrant C Data is divided into 100 sec bins |
 |
 |
| Module-wise count rates for Quadrant D Data is divided into 100 sec bins |
 |
 |
| Parameter | Plot |
|---|---|
| CZT HV Monitor | 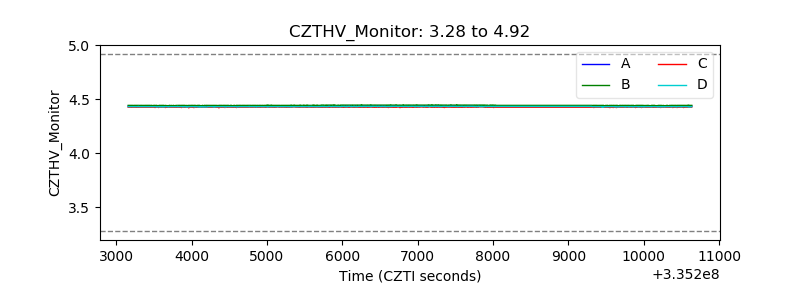 |
| D_VDD | 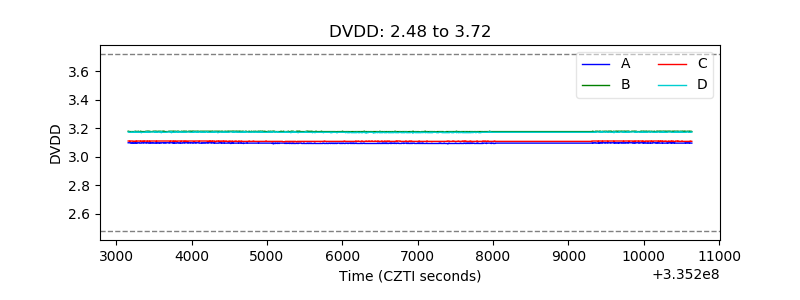 |
| Temperature 1 | 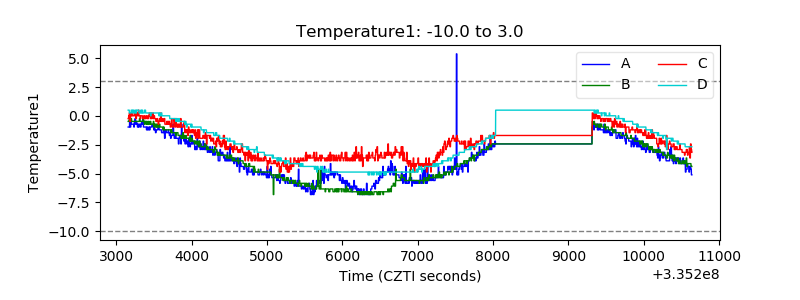 |
| Veto HV Monitor | 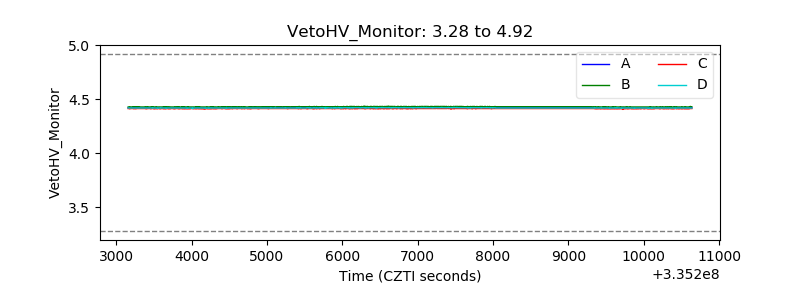 |
| Veto LLD | 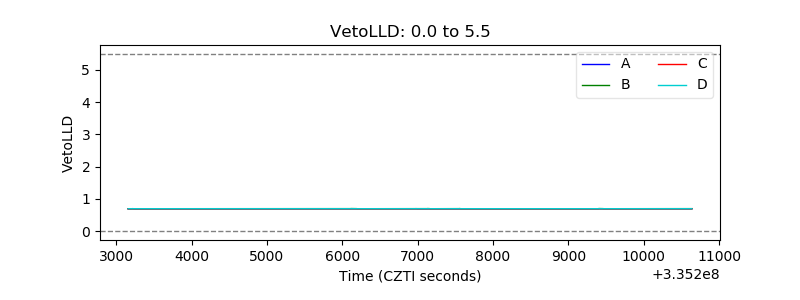 |
| Alpha Counter | 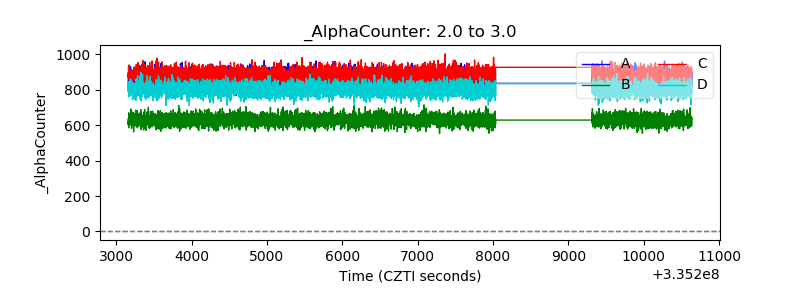 |
| _CPM_Rate | 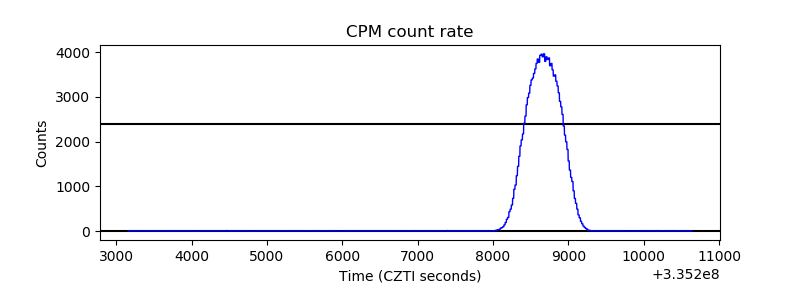 |
| CZT Counter | 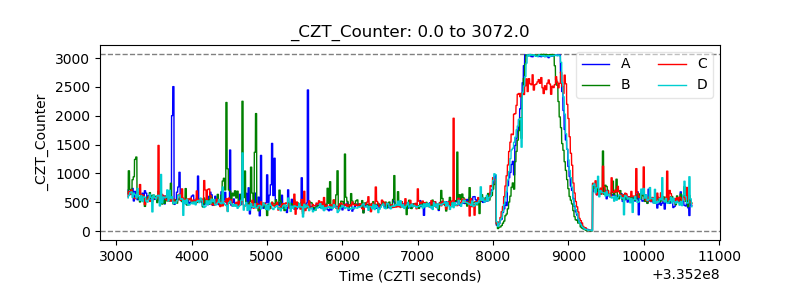 |
| +2.5 Volts monitor |  |
| +5 Volts monitor | 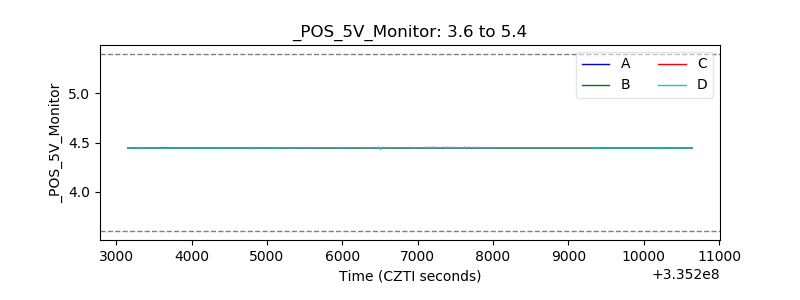 |
| _ROLL_ROT | 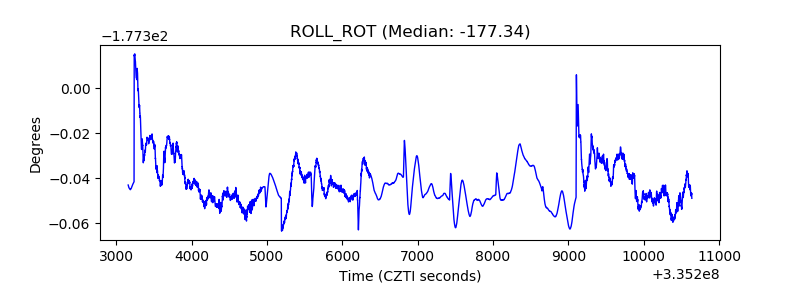 |
| _Roll_DEC | 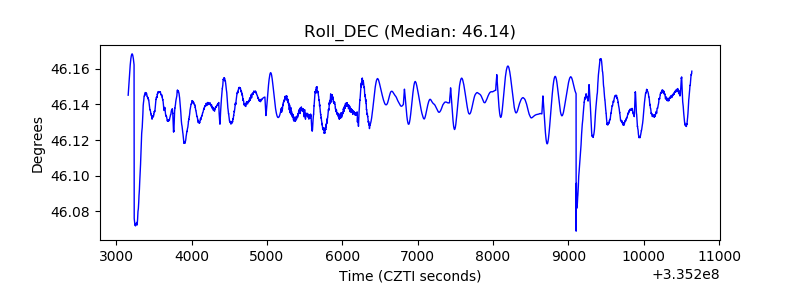 |
| _Roll_RA | 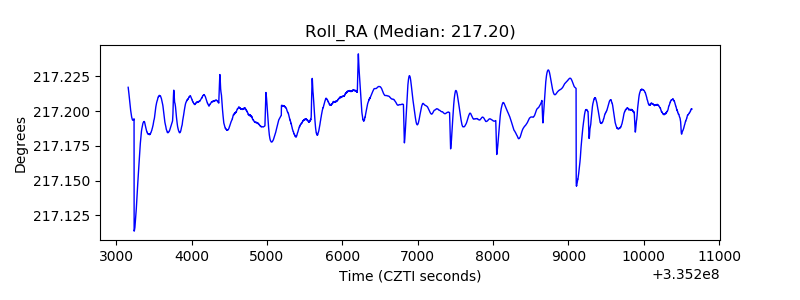 |
| Veto Counter | 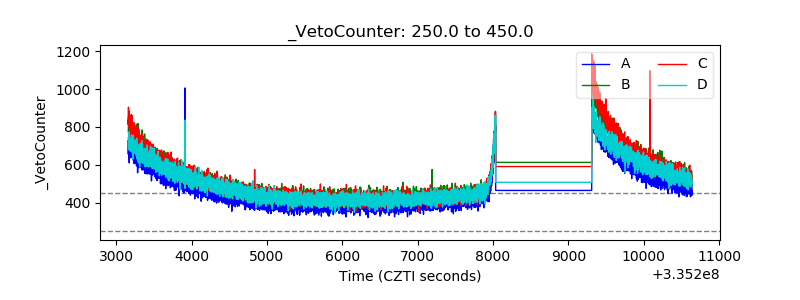 |