| Param | Original file | Final file |
|---|---|---|
| Filename | modeM0/AS1A09_127T01_9000003816_26401cztM0_level2.evt | modeM0/AS1A09_127T01_9000003816_26401cztM0_level2_quad_clean.evt |
| Size (bytes) | 480,072,960 | 102,346,560 |
| Size | 457.8 MB | 97.6 MB |
| Events in quadrant A | 3,120,236 | 677,351 |
| Events in quadrant B | 3,374,803 | 703,647 |
| Events in quadrant C | 4,098,699 | 648,476 |
| Events in quadrant D | 3,532,575 | 645,332 |
| Mode M0 | |||
|---|---|---|---|
| Quadrant | BADHDUFLAG | Total packets | Discarded packets |
| A | 0 | 13084 | 0 |
| B | 0 | 13865 | 0 |
| C | 0 | 16139 | 0 |
| D | 0 | 14520 | 0 |
| Mode M9 | |||
|---|---|---|---|
| Quadrant | BADHDUFLAG | Total packets | Discarded packets |
| A | 0 | 14 | 0 |
| B | 0 | 14 | 0 |
| C | 0 | 14 | 0 |
| D | 0 | 14 | 0 |
| Quadrant | Total seconds | Saturated seconds | Saturation percentage |
|---|---|---|---|
| A | 6088 | 15 | 0.246386% |
| B | 6089 | 43 | 0.706191% |
| C | 6088 | 288 | 4.730618% |
| D | 6088 | 40 | 0.657030% |
Noise dominated data is calculated using 1-second bins in cleaned event files. If a bin has >2000 counts, and if more than 50% of those come from <1% of pixels, then it is considered to be noise-dominated and hence unusable.
| Quadrant | # 1 sec bins | Bins with >0 counts | Bins with >2000 counts | High rate bins dominated by noise | Noise dominated (total time) | Noise dominated (detector-on time) | Marked lightcurve |
|---|---|---|---|---|---|---|---|
| A | 7453 | 6089 | 2 | 2 | 0.03% | 0.03% | 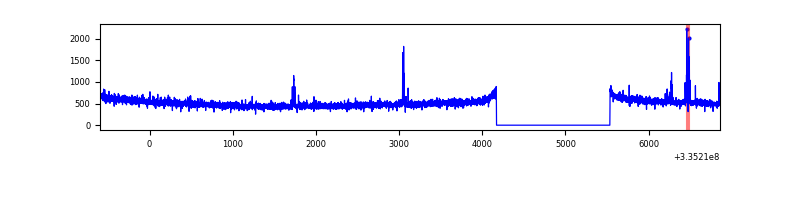 |
| B | 7454 | 6090 | 11 | 11 | 0.15% | 0.18% | 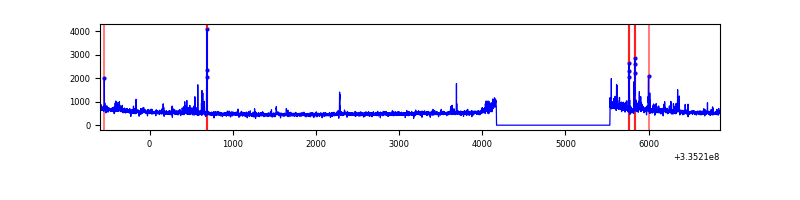 |
| C | 7453 | 6089 | 145 | 145 | 1.95% | 2.38% | 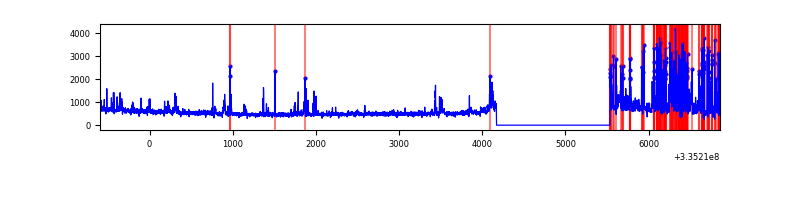 |
| D | 7453 | 6089 | 25 | 25 | 0.34% | 0.41% | 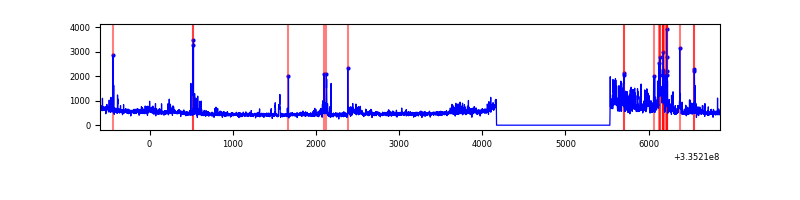 |
Top three noisy pixels from each quadrant. If the there are fewer than three noisy pixels in the level2.evt file, extra rows are filled as -1
| Pixel properties | Quadrant properties | ||||||
|---|---|---|---|---|---|---|---|
| Quadrant | DetID | PixID | Counts | Sigma | Mean | Median | Sigma |
| A | 0 | 13 | 50435 | 317.86 | 795 | 782 | 156.2 |
| A | 13 | 254 | 11356 | 67.69 | 795 | 782 | 156.2 |
| A | 0 | 226 | 6770 | 38.33 | 795 | 782 | 156.2 |
| B | 0 | 189 | 88941 | 594.87 | 805 | 785 | 148.2 |
| B | 0 | 244 | 66102 | 440.76 | 805 | 785 | 148.2 |
| B | 5 | 172 | 43654 | 289.28 | 805 | 785 | 148.2 |
| C | 2 | 16 | 548975 | 3101.41 | 769 | 778 | 176.8 |
| C | 3 | 233 | 387293 | 2186.7 | 769 | 778 | 176.8 |
| C | 14 | 238 | 123207 | 692.64 | 769 | 778 | 176.8 |
| D | 1 | 52 | 395594 | 2145.2 | 778 | 761 | 184.1 |
| D | 12 | 233 | 84047 | 452.51 | 778 | 761 | 184.1 |
| D | 7 | 223 | 61486 | 329.93 | 778 | 761 | 184.1 |
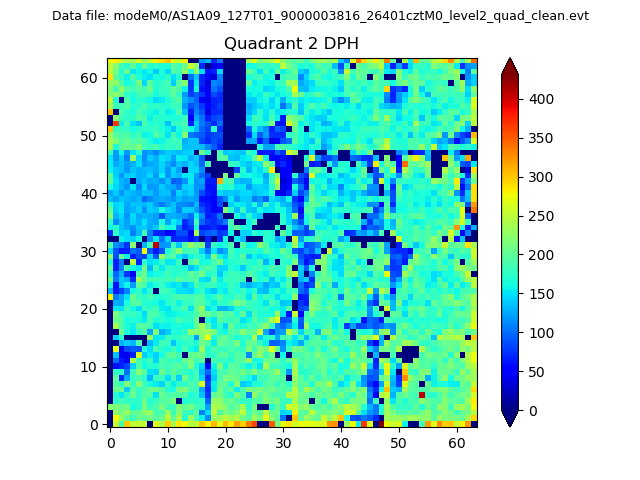
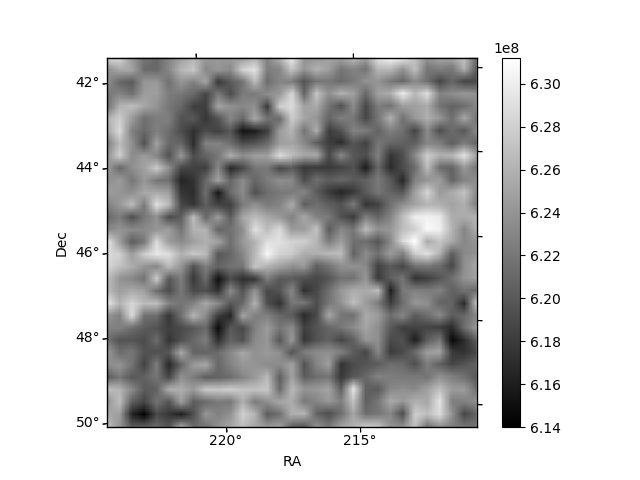
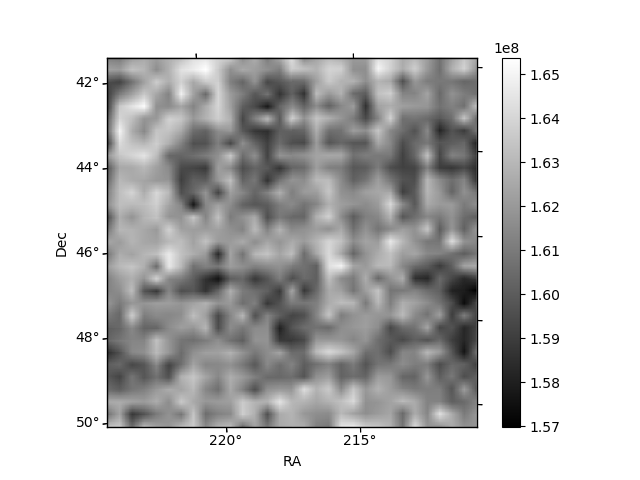
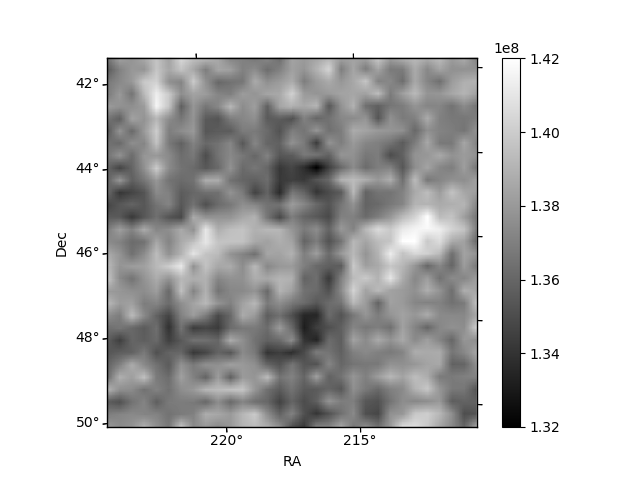
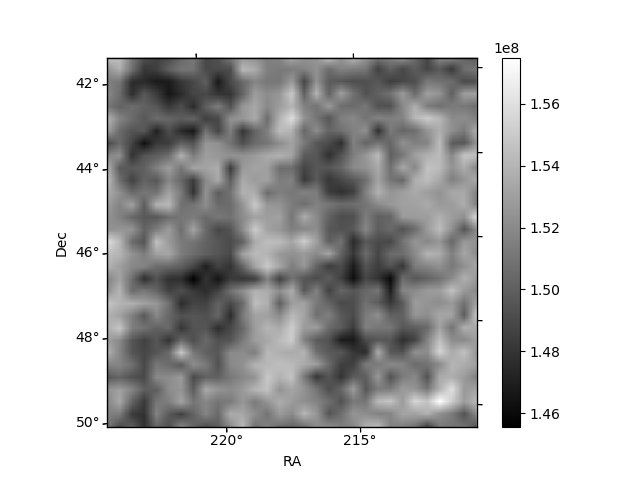
Histogram calculated using DETX and DETY for each event in the final _common_clean file
| Quadrant A | 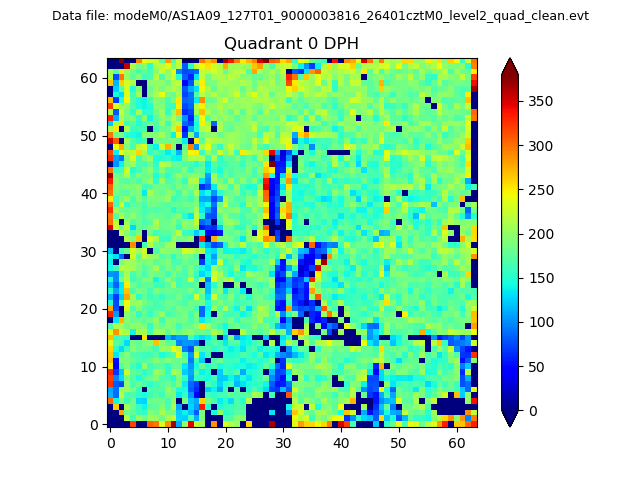 |
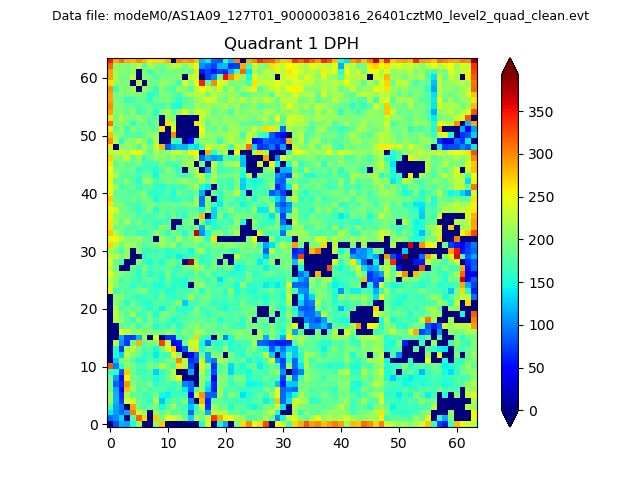 |
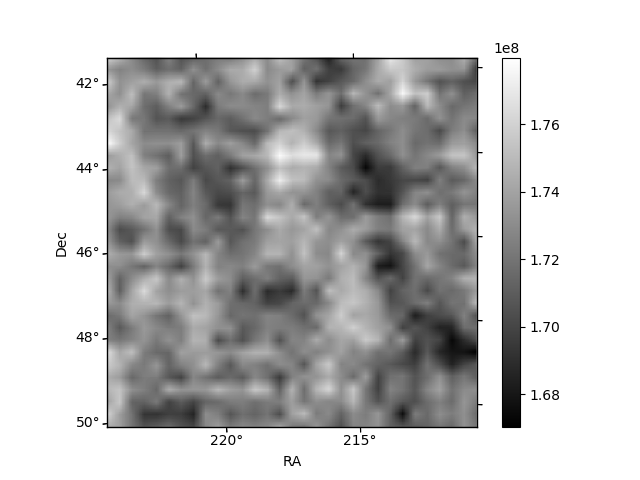
Quadrant B |
|---|---|---|---|
| Quadrant D | 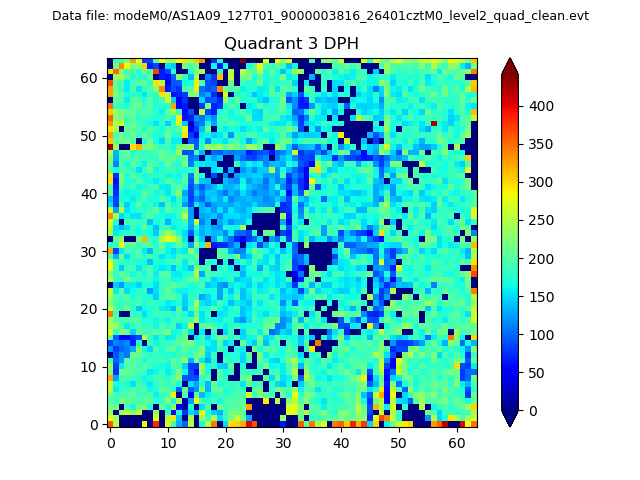 |
 |
Quadrant C |
| Plot type | Count rate plots | Images |
|---|---|---|
| Comparison with Poisson distribution Blue bars denote a histogram of data divided into 1 sec bins. Red curve is a Poisson curve with rate = median count rate of data. |
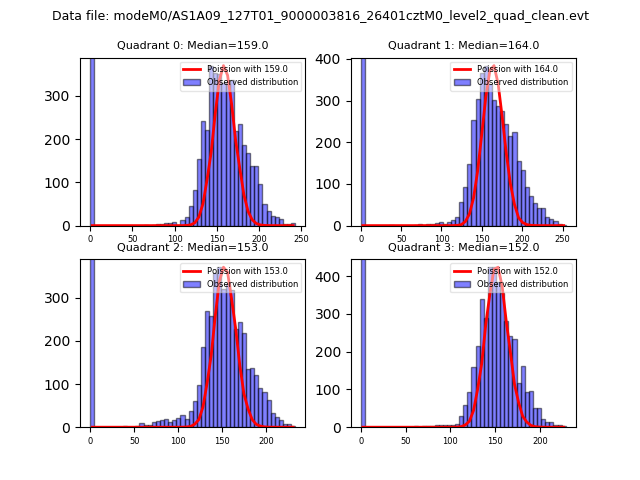 |
 |
| Quadrant-wise count rates Data is divided into 100 sec bins |
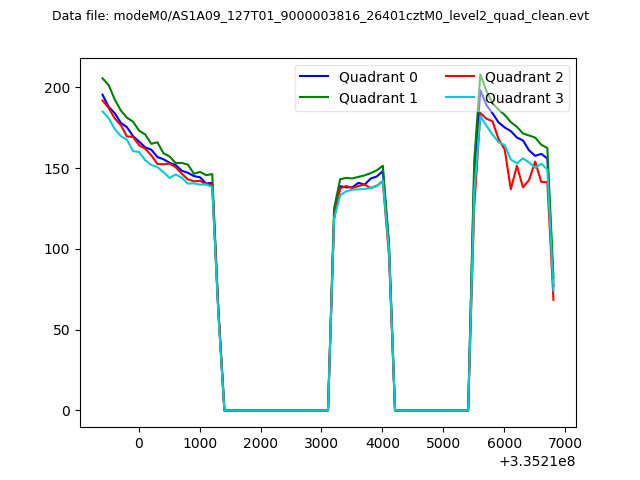 |
|
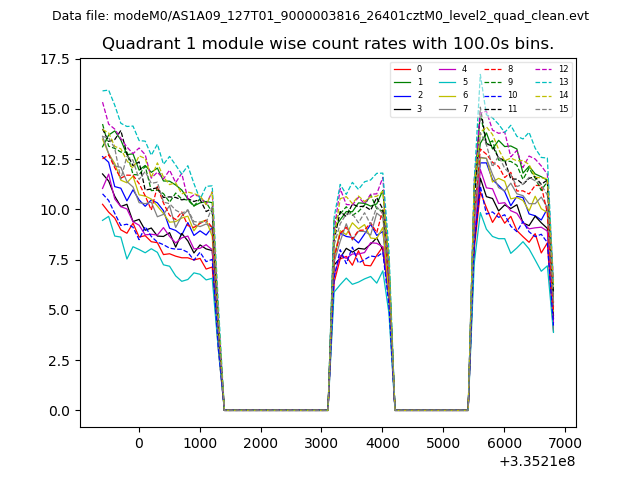
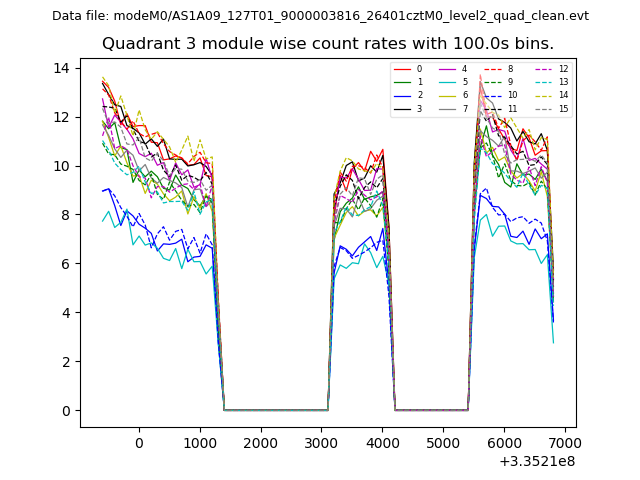
| Module-wise count rates for Quadrant A Data is divided into 100 sec bins |
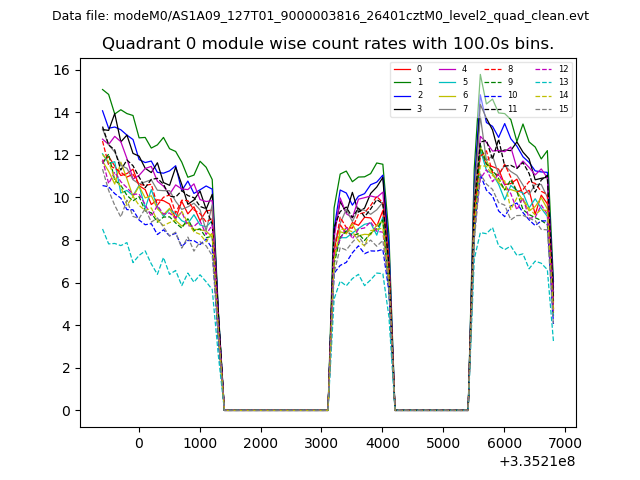 |
 |
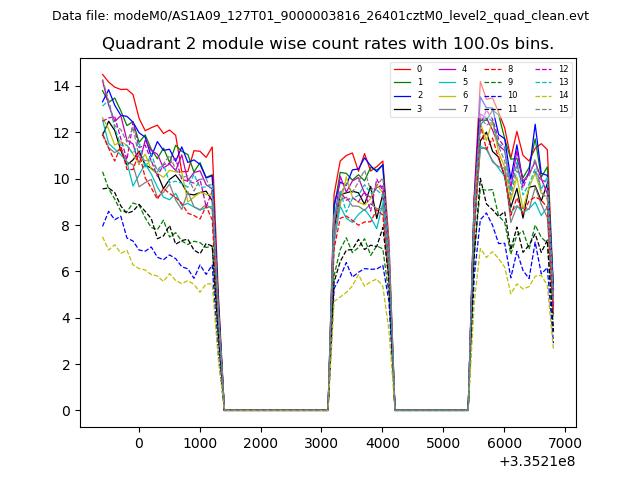
| Module-wise count rates for Quadrant B Data is divided into 100 sec bins |
 |
 |
| Module-wise count rates for Quadrant C Data is divided into 100 sec bins |
 |
 |
| Module-wise count rates for Quadrant D Data is divided into 100 sec bins |
 |
 |
| Parameter | Plot |
|---|---|
| CZT HV Monitor | 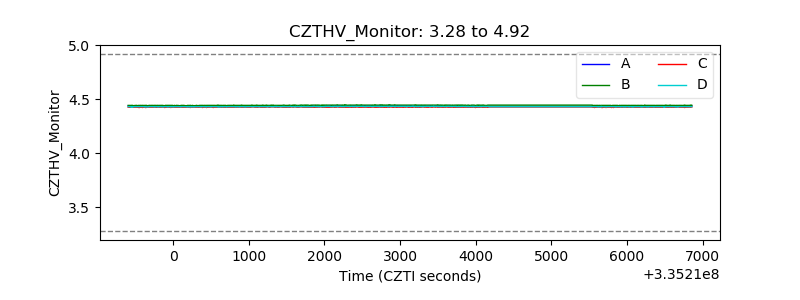 |
| D_VDD | 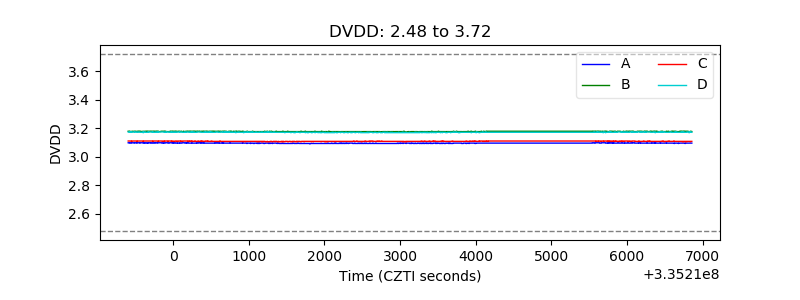 |
| Temperature 1 | 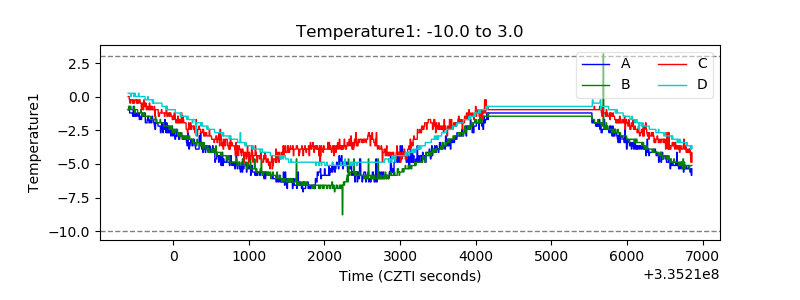 |
| Veto HV Monitor | 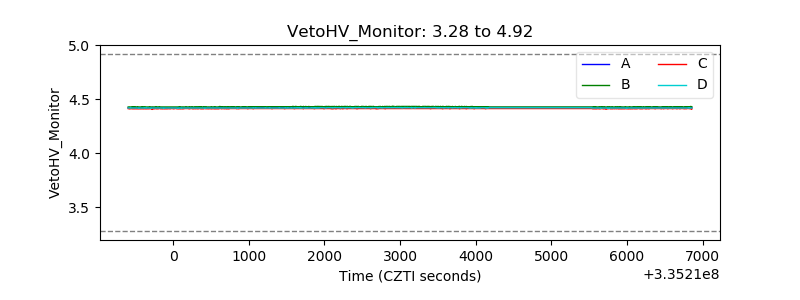 |
| Veto LLD | 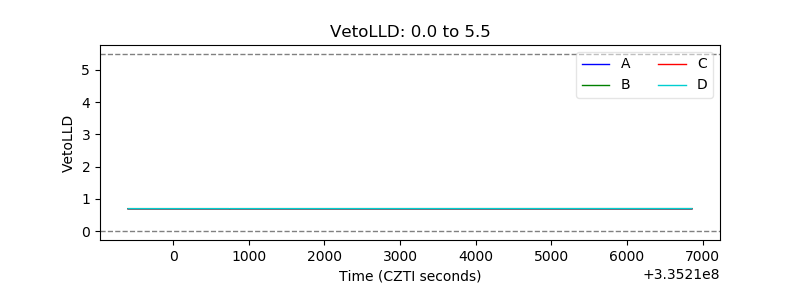 |
| Alpha Counter | 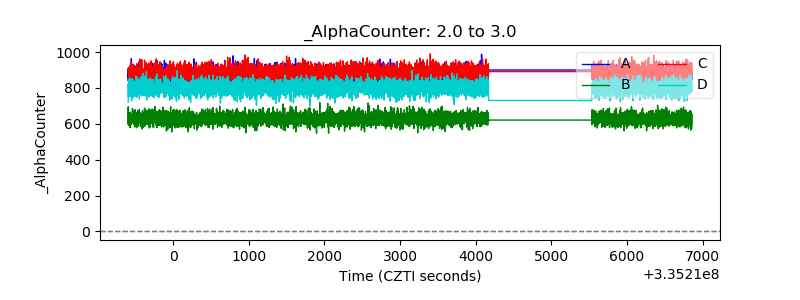 |
| _CPM_Rate | 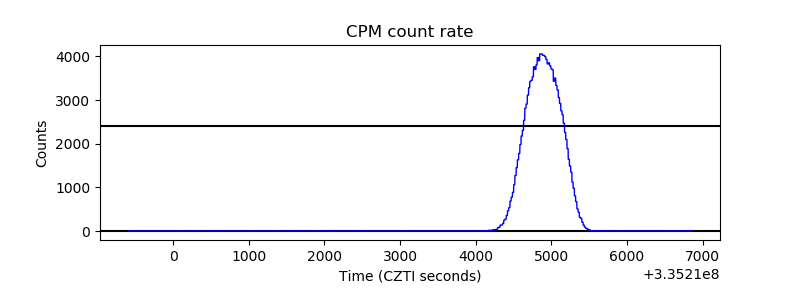 |
| CZT Counter | 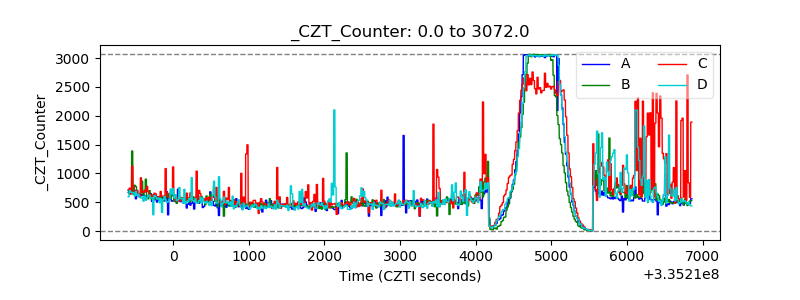 |
| +2.5 Volts monitor | 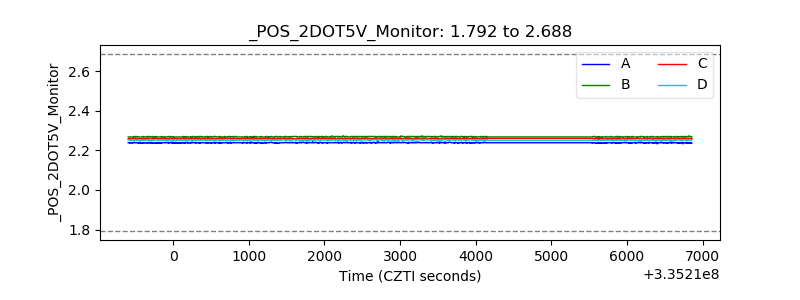 |
| +5 Volts monitor | 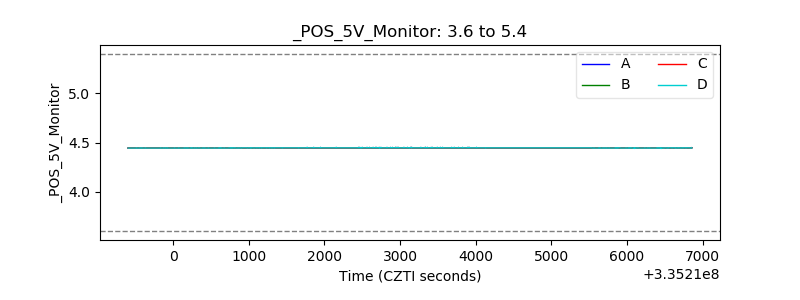 |
| _ROLL_ROT | 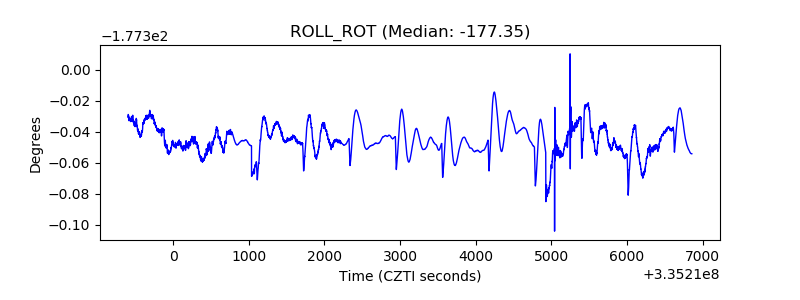 |
| _Roll_DEC |  |
| _Roll_RA | 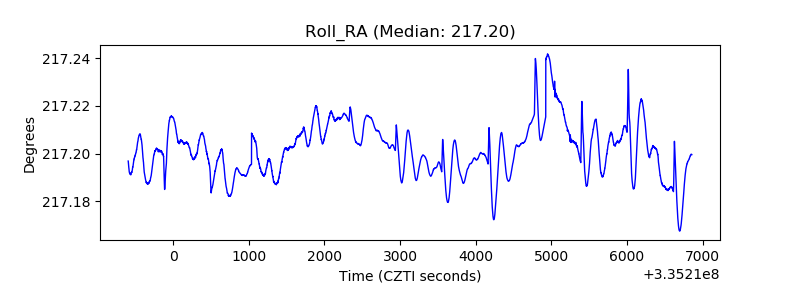 |
| Veto Counter | 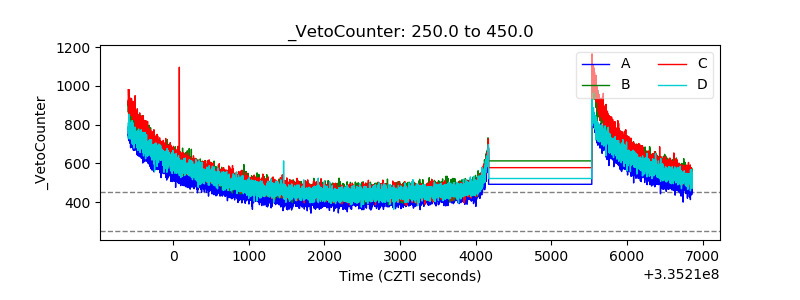 |