| Param | Original file | Final file |
|---|---|---|
| Filename | modeM0/AS1A09_127T01_9000003816_26402cztM0_level2.evt | modeM0/AS1A09_127T01_9000003816_26402cztM0_level2_quad_clean.evt |
| Size (bytes) | 525,291,840 | 100,166,400 |
| Size | 501.0 MB | 95.5 MB |
| Events in quadrant A | 3,119,649 | 668,117 |
| Events in quadrant B | 3,441,008 | 693,210 |
| Events in quadrant C | 5,485,221 | 609,660 |
| Events in quadrant D | 3,447,794 | 635,018 |
| Mode M0 | |||
|---|---|---|---|
| Quadrant | BADHDUFLAG | Total packets | Discarded packets |
| A | 0 | 13003 | 0 |
| B | 0 | 14064 | 0 |
| C | 0 | 20421 | 0 |
| D | 0 | 14258 | 0 |
| Mode M9 | |||
|---|---|---|---|
| Quadrant | BADHDUFLAG | Total packets | Discarded packets |
| A | 0 | 14 | 0 |
| B | 0 | 14 | 0 |
| C | 0 | 14 | 0 |
| D | 0 | 14 | 0 |
| Quadrant | Total seconds | Saturated seconds | Saturation percentage |
|---|---|---|---|
| A | 6121 | 45 | 0.735174% |
| B | 6121 | 84 | 1.372325% |
| C | 6121 | 728 | 11.893481% |
| D | 6121 | 50 | 0.816860% |
Noise dominated data is calculated using 1-second bins in cleaned event files. If a bin has >2000 counts, and if more than 50% of those come from <1% of pixels, then it is considered to be noise-dominated and hence unusable.
| Quadrant | # 1 sec bins | Bins with >0 counts | Bins with >2000 counts | High rate bins dominated by noise | Noise dominated (total time) | Noise dominated (detector-on time) | Marked lightcurve |
|---|---|---|---|---|---|---|---|
| A | 7481 | 6122 | 2 | 2 | 0.03% | 0.03% |  |
| B | 7481 | 6122 | 19 | 19 | 0.25% | 0.31% |  |
| C | 7481 | 6121 | 357 | 357 | 4.77% | 5.83% |  |
| D | 7481 | 6122 | 22 | 22 | 0.29% | 0.36% |  |
Top three noisy pixels from each quadrant. If the there are fewer than three noisy pixels in the level2.evt file, extra rows are filled as -1
| Pixel properties | Quadrant properties | ||||||
|---|---|---|---|---|---|---|---|
| Quadrant | DetID | PixID | Counts | Sigma | Mean | Median | Sigma |
| A | 0 | 13 | 29659 | 182.07 | 801 | 787 | 158.6 |
| A | 13 | 254 | 10961 | 64.16 | 801 | 787 | 158.6 |
| A | 0 | 226 | 7080 | 39.68 | 801 | 787 | 158.6 |
| B | 0 | 189 | 106193 | 712.64 | 812 | 796 | 147.9 |
| B | 0 | 244 | 65871 | 440.0 | 812 | 796 | 147.9 |
| B | 5 | 172 | 64106 | 428.07 | 812 | 796 | 147.9 |
| C | 2 | 16 | 1355462 | 7832.89 | 755 | 762 | 173.0 |
| C | 3 | 233 | 1033535 | 5971.51 | 755 | 762 | 173.0 |
| C | 14 | 238 | 120648 | 693.18 | 755 | 762 | 173.0 |
| D | 1 | 52 | 324776 | 1763.29 | 782 | 767 | 183.8 |
| D | 12 | 233 | 100345 | 541.91 | 782 | 767 | 183.8 |
| D | 7 | 223 | 37871 | 201.92 | 782 | 767 | 183.8 |
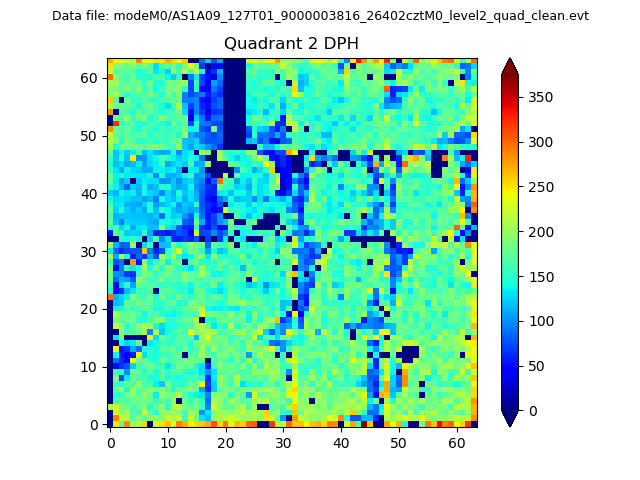
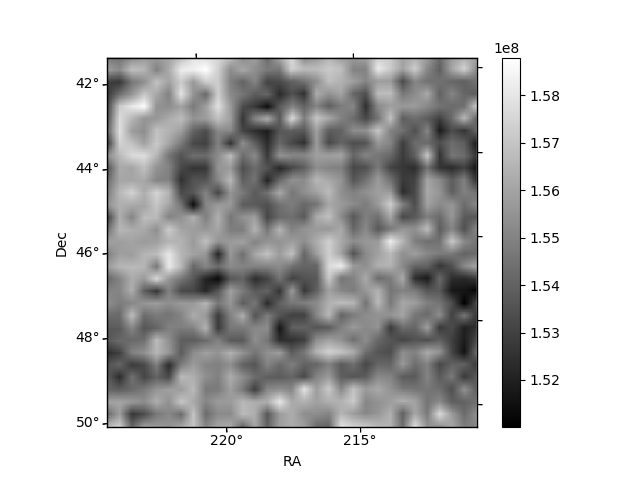
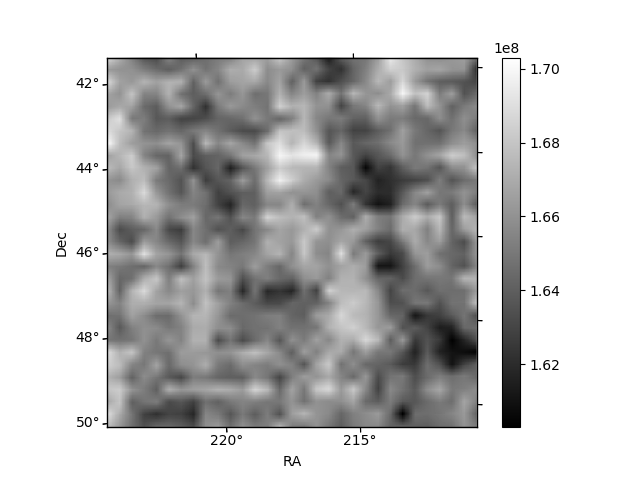
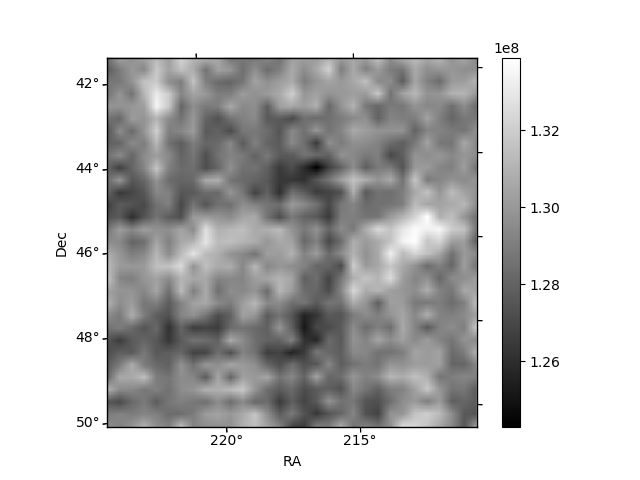
Histogram calculated using DETX and DETY for each event in the final _common_clean file
| Quadrant A | 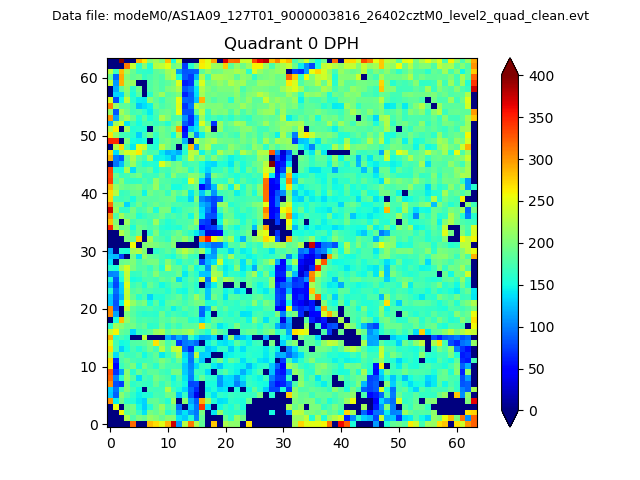 |
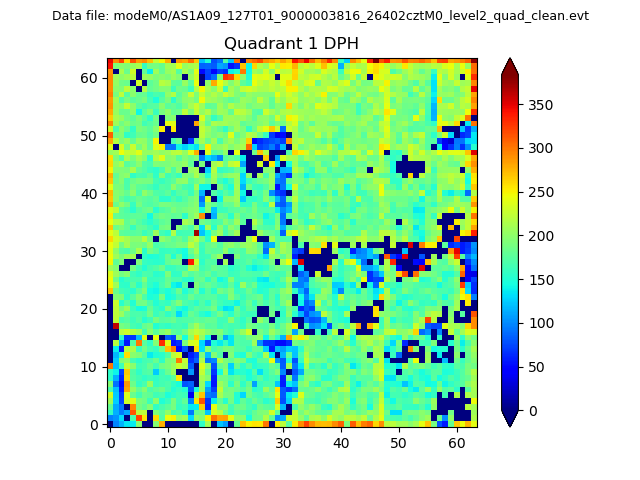 |
Quadrant B |
|---|---|---|---|
| Quadrant D | 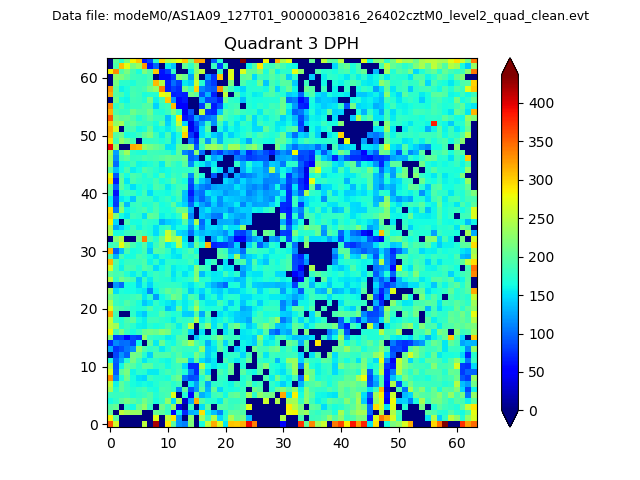 |
 |
Quadrant C |
| Plot type | Count rate plots | Images |
|---|---|---|
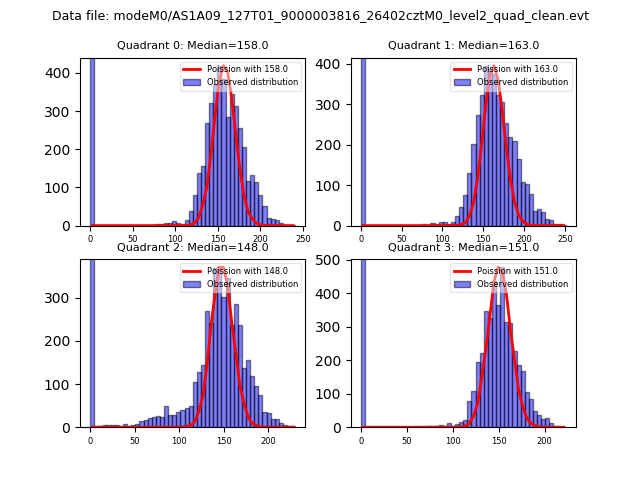
| Comparison with Poisson distribution Blue bars denote a histogram of data divided into 1 sec bins. Red curve is a Poisson curve with rate = median count rate of data. |
 |
 |
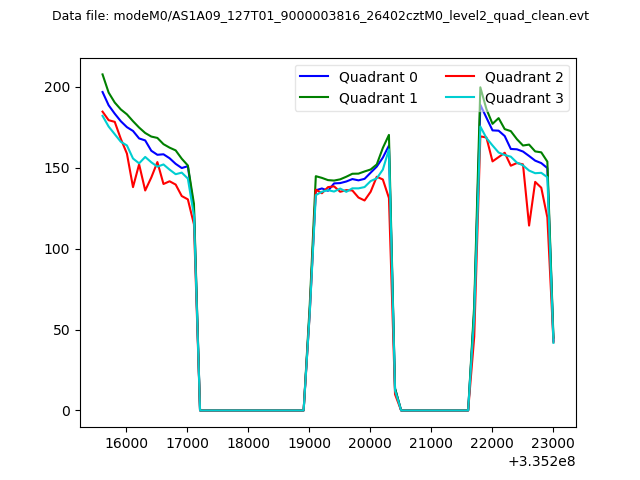
| Quadrant-wise count rates Data is divided into 100 sec bins |
 |
|
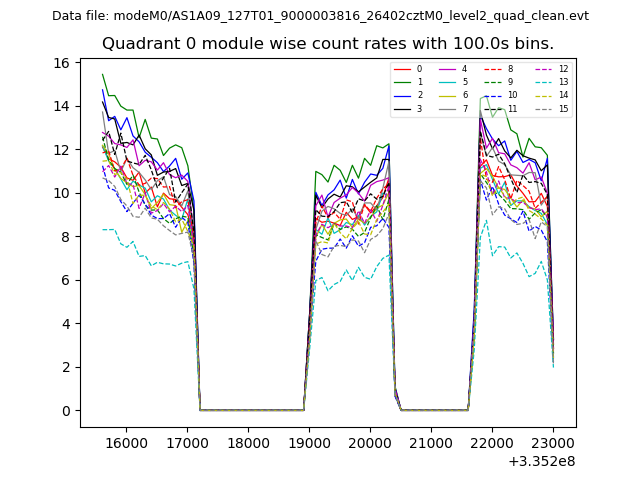
| Module-wise count rates for Quadrant A Data is divided into 100 sec bins |
 |
 |
| Module-wise count rates for Quadrant B Data is divided into 100 sec bins |
 |
 |
| Module-wise count rates for Quadrant C Data is divided into 100 sec bins |
 |
 |
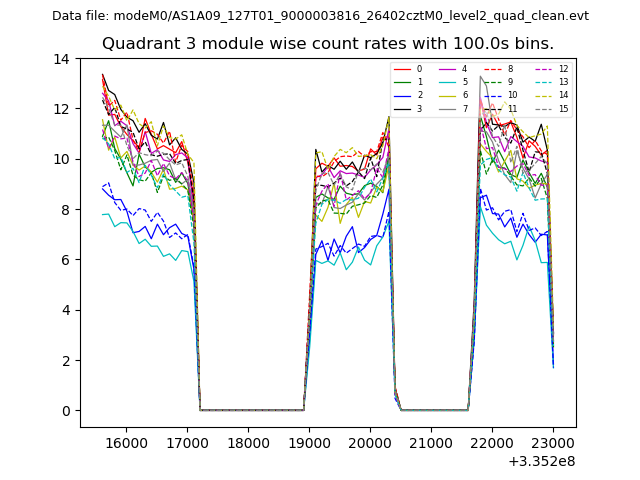
| Module-wise count rates for Quadrant D Data is divided into 100 sec bins |
 |
 |
| Parameter | Plot |
|---|---|
| CZT HV Monitor | 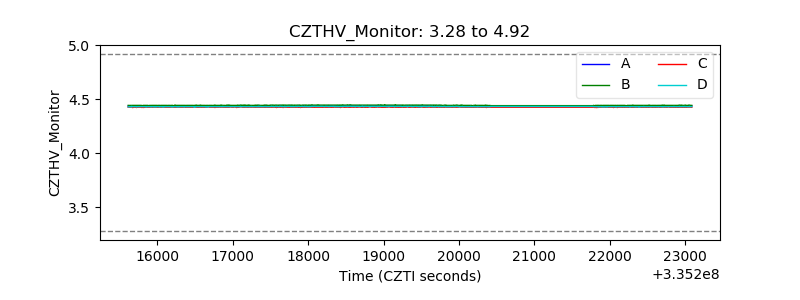 |
| D_VDD | 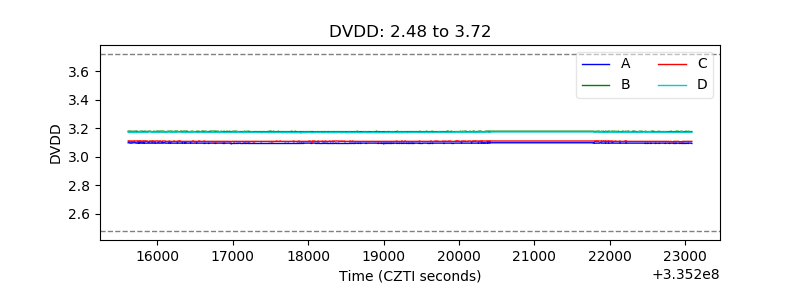 |
| Temperature 1 | 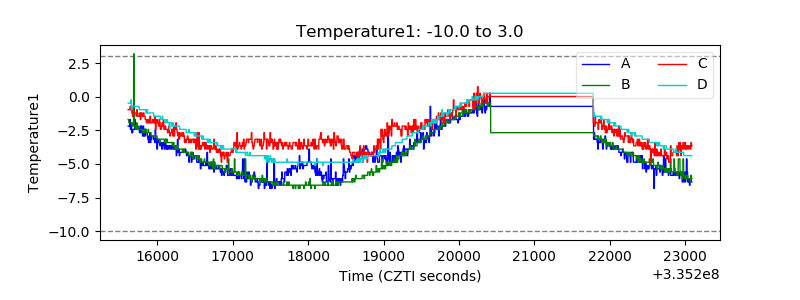 |
| Veto HV Monitor | 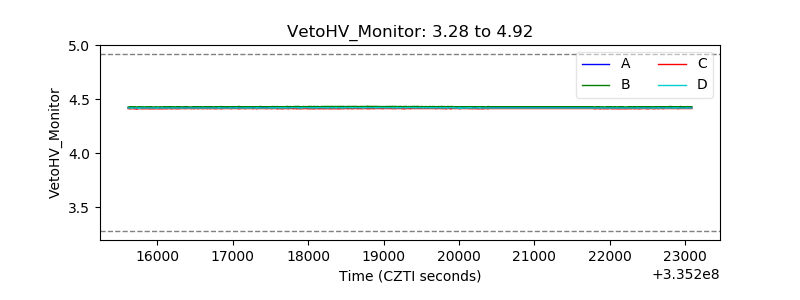 |
| Veto LLD | 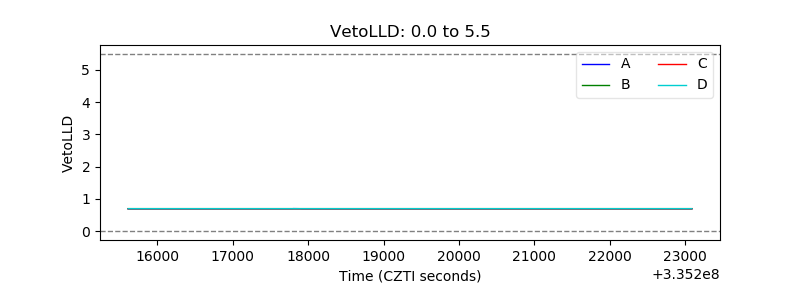 |
| Alpha Counter | 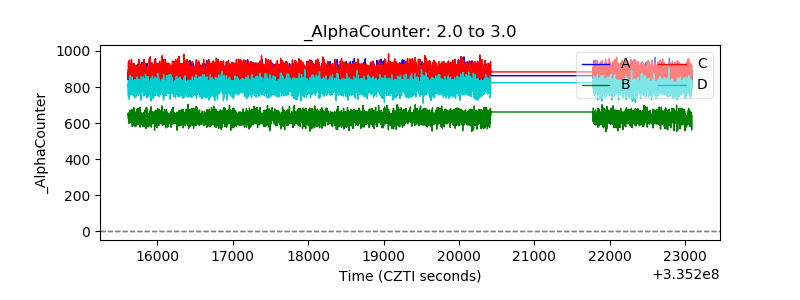 |
| _CPM_Rate | 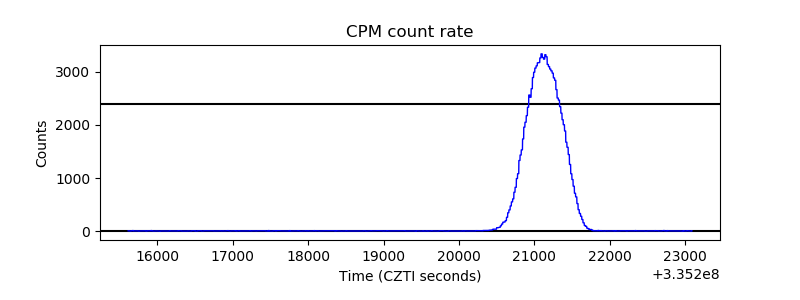 |
| CZT Counter | 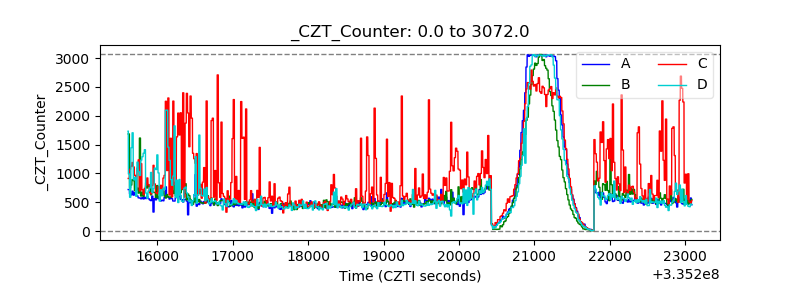 |
| +2.5 Volts monitor | 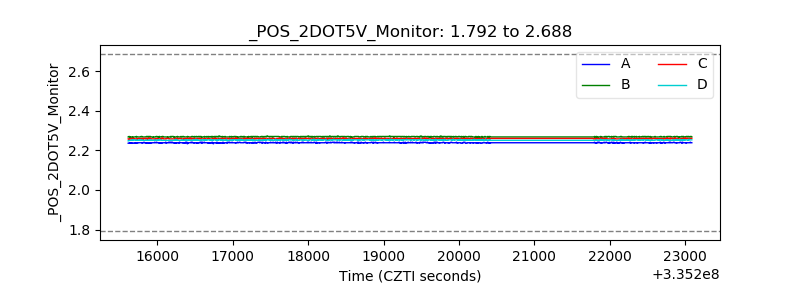 |
| +5 Volts monitor |  |
| _ROLL_ROT |  |
| _Roll_DEC |  |
| _Roll_RA | 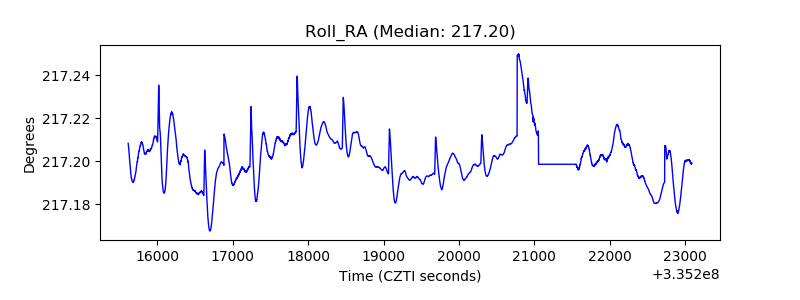 |
| Veto Counter |  |