| Param | Original file | Final file |
|---|---|---|
| Filename | modeM0/AS1A09_127T01_9000003816_26403cztM0_level2.evt | modeM0/AS1A09_127T01_9000003816_26403cztM0_level2_quad_clean.evt |
| Size (bytes) | 535,645,440 | 92,062,080 |
| Size | 510.8 MB | 87.8 MB |
| Events in quadrant A | 3,197,769 | 602,537 |
| Events in quadrant B | 3,528,417 | 620,857 |
| Events in quadrant C | 5,830,814 | 551,676 |
| Events in quadrant D | 3,239,497 | 574,893 |
| Mode M0 | |||
|---|---|---|---|
| Quadrant | BADHDUFLAG | Total packets | Discarded packets |
| A | 0 | 13341 | 0 |
| B | 0 | 14366 | 0 |
| C | 0 | 21449 | 0 |
| D | 0 | 13715 | 0 |
| Mode M9 | |||
|---|---|---|---|
| Quadrant | BADHDUFLAG | Total packets | Discarded packets |
| A | 0 | 15 | 0 |
| B | 0 | 16 | 0 |
| C | 0 | 16 | 0 |
| D | 0 | 16 | 0 |
| Quadrant | Total seconds | Saturated seconds | Saturation percentage |
|---|---|---|---|
| A | 6278 | 64 | 1.019433% |
| B | 6278 | 130 | 2.070723% |
| C | 6278 | 999 | 15.912711% |
| D | 6278 | 51 | 0.812361% |
Noise dominated data is calculated using 1-second bins in cleaned event files. If a bin has >2000 counts, and if more than 50% of those come from <1% of pixels, then it is considered to be noise-dominated and hence unusable.
| Quadrant | # 1 sec bins | Bins with >0 counts | Bins with >2000 counts | High rate bins dominated by noise | Noise dominated (total time) | Noise dominated (detector-on time) | Marked lightcurve |
|---|---|---|---|---|---|---|---|
| A | 7573 | 6279 | 14 | 14 | 0.18% | 0.22% | 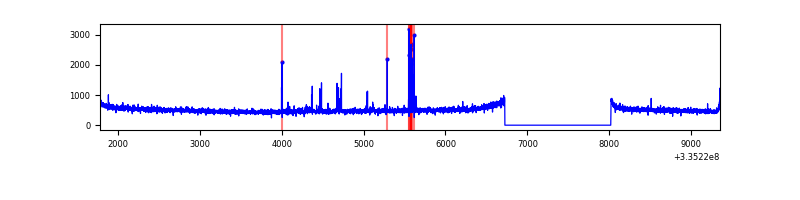 |
| B | 7573 | 6279 | 24 | 24 | 0.32% | 0.38% | 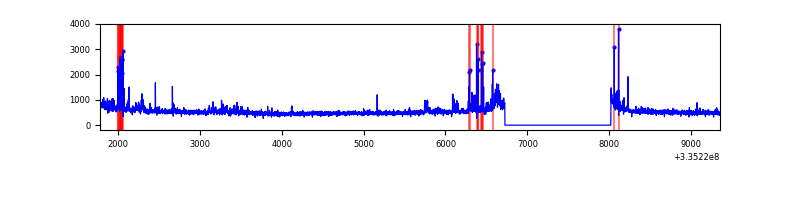 |
| C | 7572 | 6278 | 562 | 562 | 7.42% | 8.95% | 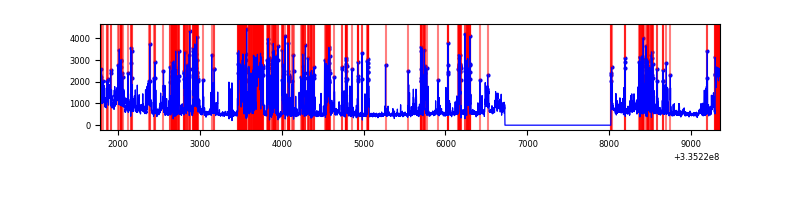 |
| D | 7573 | 6279 | 9 | 9 | 0.12% | 0.14% | 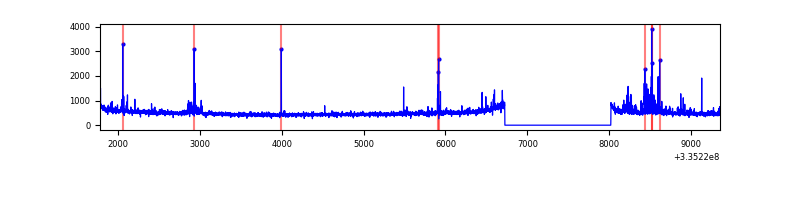 |
Top three noisy pixels from each quadrant. If the there are fewer than three noisy pixels in the level2.evt file, extra rows are filled as -1
| Pixel properties | Quadrant properties | ||||||
|---|---|---|---|---|---|---|---|
| Quadrant | DetID | PixID | Counts | Sigma | Mean | Median | Sigma |
| A | 0 | 13 | 91604 | 570.6 | 805 | 790 | 159.2 |
| A | 13 | 254 | 10764 | 62.67 | 805 | 790 | 159.2 |
| A | 0 | 226 | 6970 | 38.83 | 805 | 790 | 159.2 |
| B | 0 | 189 | 127332 | 851.95 | 813 | 796 | 148.5 |
| B | 5 | 172 | 126877 | 848.89 | 813 | 796 | 148.5 |
| B | 0 | 244 | 38951 | 256.89 | 813 | 796 | 148.5 |
| C | 2 | 16 | 1977380 | 11609.2 | 739 | 747 | 170.3 |
| C | 3 | 233 | 841747 | 4939.38 | 739 | 747 | 170.3 |
| C | 14 | 238 | 119891 | 699.76 | 739 | 747 | 170.3 |
| D | 1 | 52 | 199963 | 1083.62 | 782 | 764 | 183.8 |
| D | 12 | 233 | 32774 | 174.13 | 782 | 764 | 183.8 |
| D | 2 | 234 | 32189 | 170.95 | 782 | 764 | 183.8 |
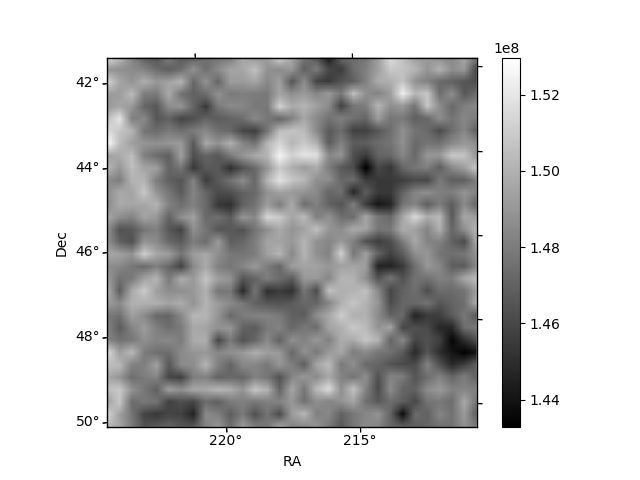
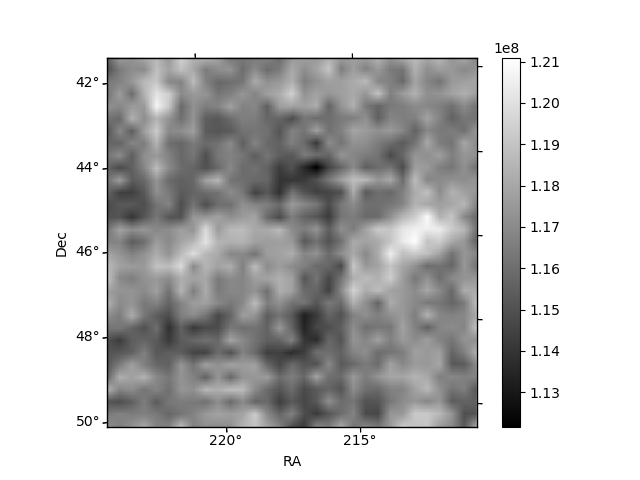
Histogram calculated using DETX and DETY for each event in the final _common_clean file
| Quadrant A | 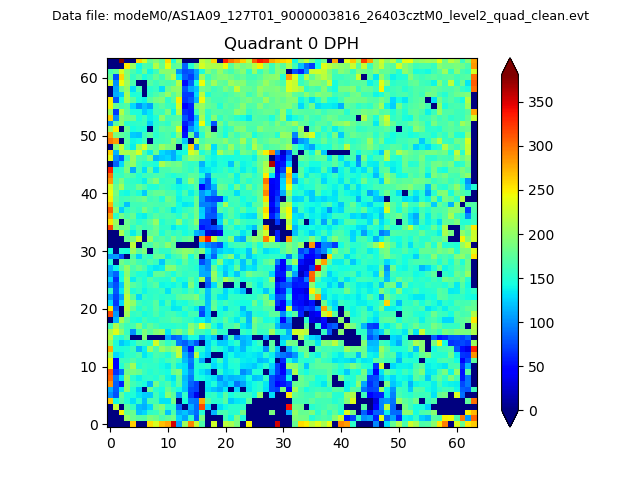 |
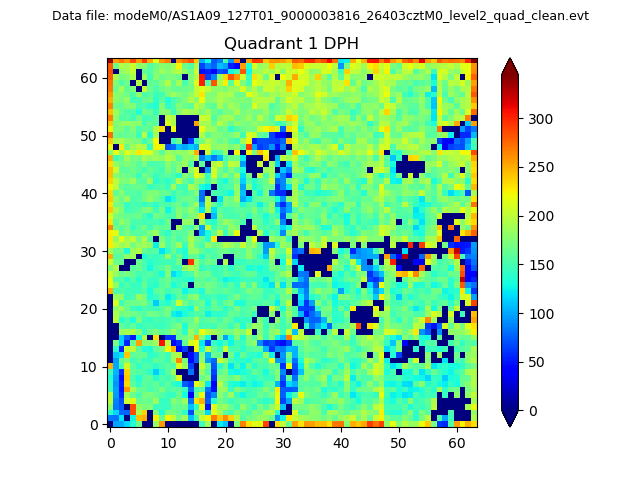 |
Quadrant B |
|---|---|---|---|
| Quadrant D |  |
 |
Quadrant C |
| Plot type | Count rate plots | Images |
|---|---|---|
| Comparison with Poisson distribution Blue bars denote a histogram of data divided into 1 sec bins. Red curve is a Poisson curve with rate = median count rate of data. |
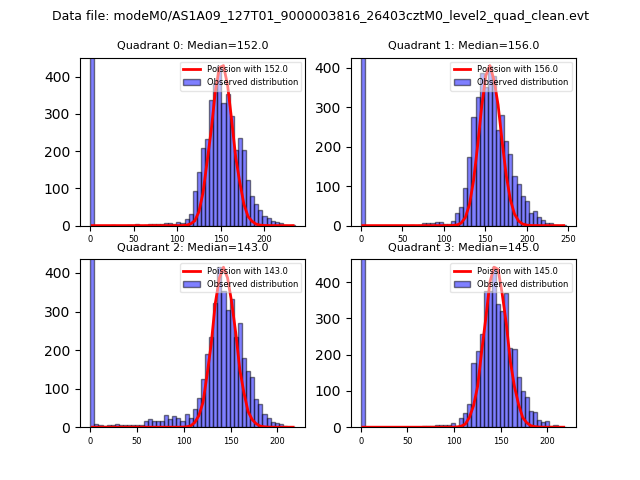 |
 |
| Quadrant-wise count rates Data is divided into 100 sec bins |
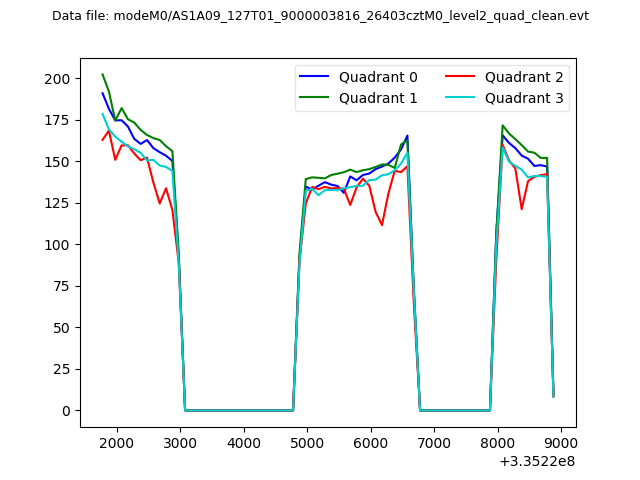 |
|
| Module-wise count rates for Quadrant A Data is divided into 100 sec bins |
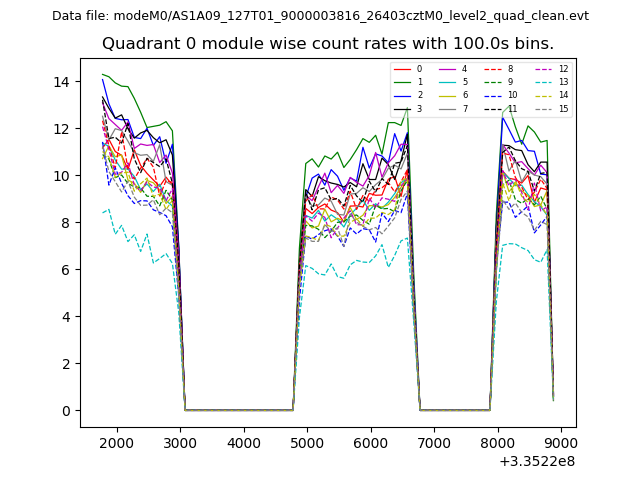 |
 |
| Module-wise count rates for Quadrant B Data is divided into 100 sec bins |
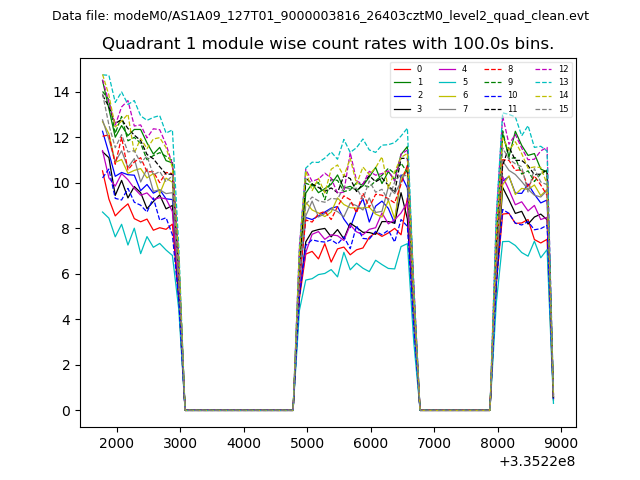 |
 |
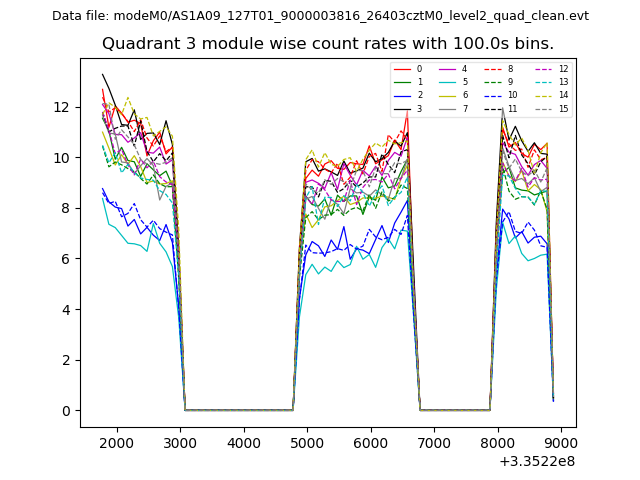
| Module-wise count rates for Quadrant C Data is divided into 100 sec bins |
 |
 |
| Module-wise count rates for Quadrant D Data is divided into 100 sec bins |
 |
 |
| Parameter | Plot |
|---|---|
| CZT HV Monitor | 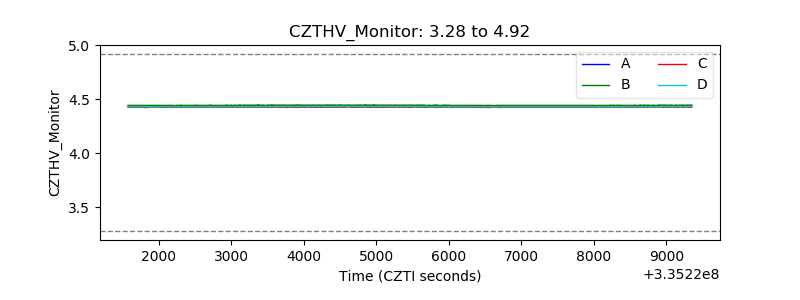 |
| D_VDD | 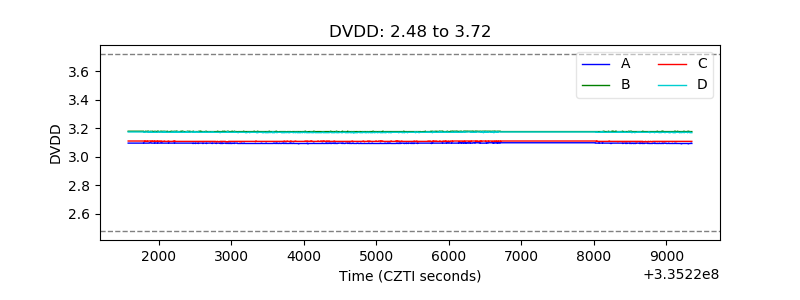 |
| Temperature 1 | 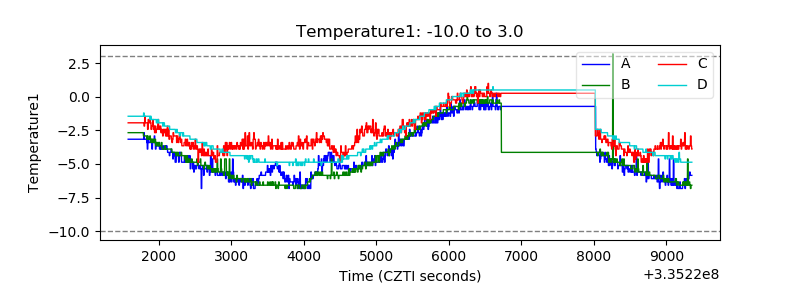 |
| Veto HV Monitor | 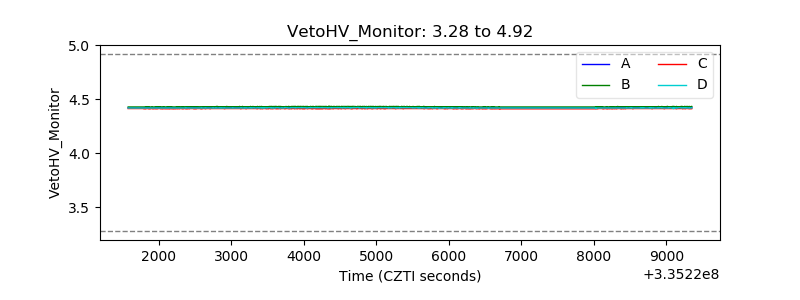 |
| Veto LLD | 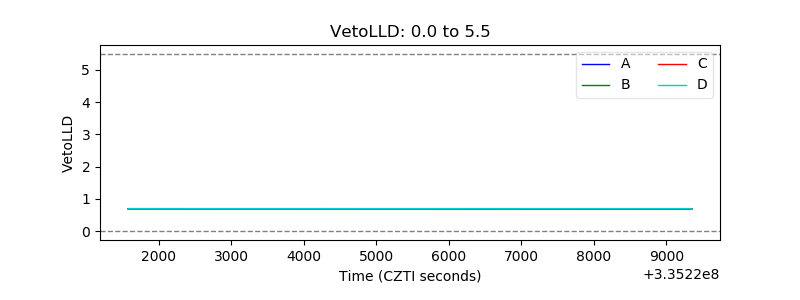 |
| Alpha Counter | 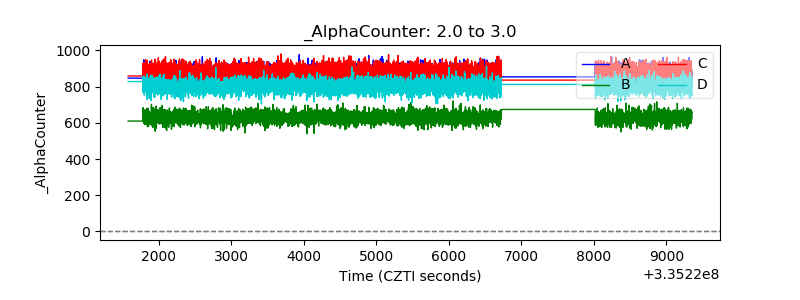 |
| _CPM_Rate | 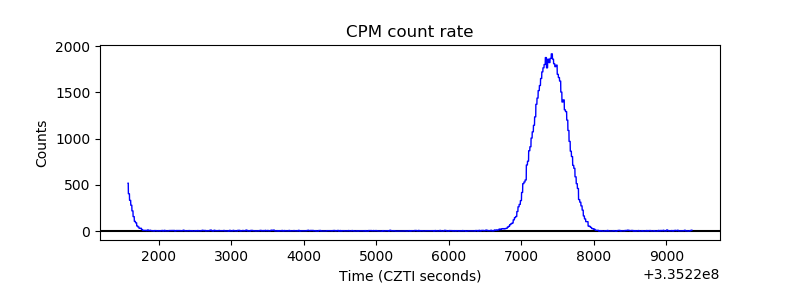 |
| CZT Counter | 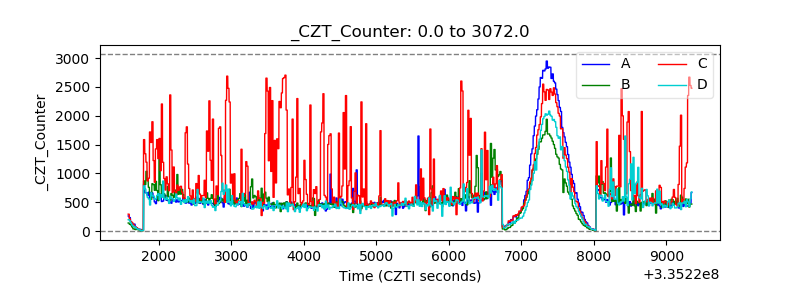 |
| +2.5 Volts monitor |  |
| +5 Volts monitor |  |
| _ROLL_ROT | 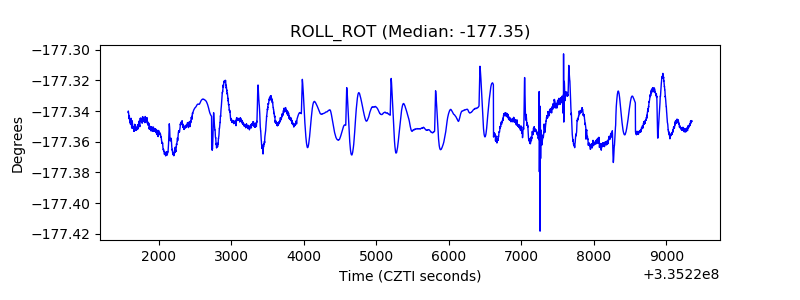 |
| _Roll_DEC | 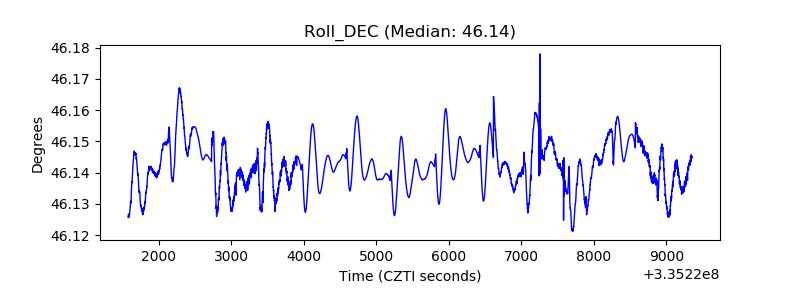 |
| _Roll_RA | 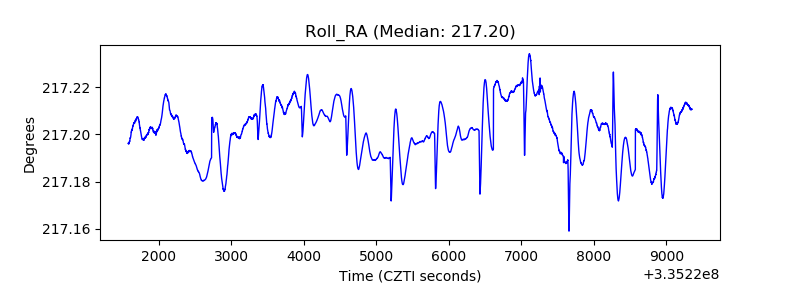 |
| Veto Counter | 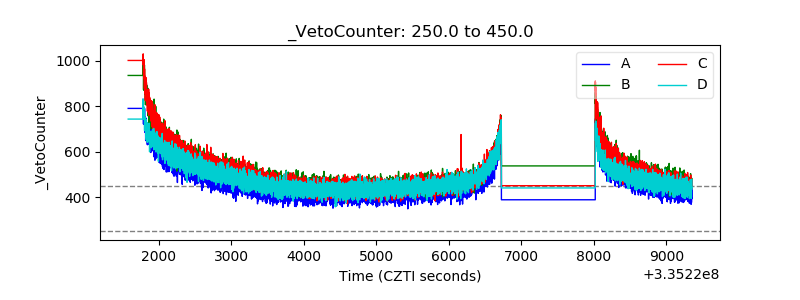 |