| Param | Original file | Final file |
|---|---|---|
| Filename | modeM0/AS1A09_127T01_9000003816_26404cztM0_level2.evt | modeM0/AS1A09_127T01_9000003816_26404cztM0_level2_quad_clean.evt |
| Size (bytes) | 549,302,400 | 84,424,320 |
| Size | 523.9 MB | 80.5 MB |
| Events in quadrant A | 3,388,349 | 537,525 |
| Events in quadrant B | 3,548,373 | 549,849 |
| Events in quadrant C | 5,890,416 | 486,958 |
| Events in quadrant D | 3,353,540 | 514,227 |
| Mode M0 | |||
|---|---|---|---|
| Quadrant | BADHDUFLAG | Total packets | Discarded packets |
| A | 0 | 14230 | 0 |
| B | 0 | 14735 | 0 |
| C | 0 | 21919 | 0 |
| D | 0 | 14466 | 0 |
| Mode M9 | |||
|---|---|---|---|
| Quadrant | BADHDUFLAG | Total packets | Discarded packets |
| A | 0 | 16 | 0 |
| B | 0 | 17 | 0 |
| C | 0 | 17 | 0 |
| D | 0 | 17 | 0 |
| Quadrant | Total seconds | Saturated seconds | Saturation percentage |
|---|---|---|---|
| A | 6709 | 49 | 0.730362% |
| B | 6709 | 83 | 1.237144% |
| C | 6709 | 895 | 13.340289% |
| D | 6709 | 23 | 0.342823% |
Noise dominated data is calculated using 1-second bins in cleaned event files. If a bin has >2000 counts, and if more than 50% of those come from <1% of pixels, then it is considered to be noise-dominated and hence unusable.
| Quadrant | # 1 sec bins | Bins with >0 counts | Bins with >2000 counts | High rate bins dominated by noise | Noise dominated (total time) | Noise dominated (detector-on time) | Marked lightcurve |
|---|---|---|---|---|---|---|---|
| A | 7799 | 6710 | 8 | 8 | 0.10% | 0.12% | 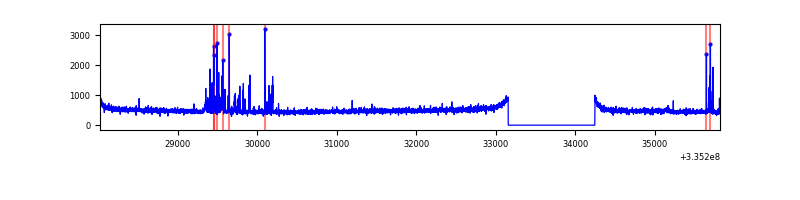 |
| B | 7799 | 6710 | 12 | 12 | 0.15% | 0.18% | 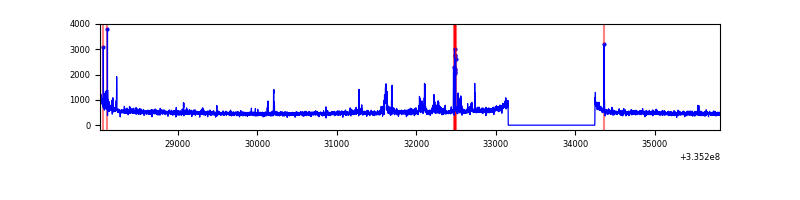 |
| C | 7799 | 6709 | 516 | 516 | 6.62% | 7.69% | 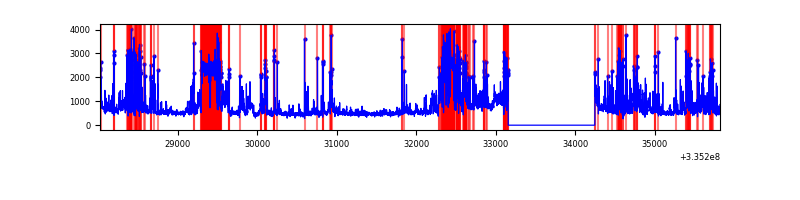 |
| D | 7799 | 6710 | 9 | 9 | 0.12% | 0.13% | 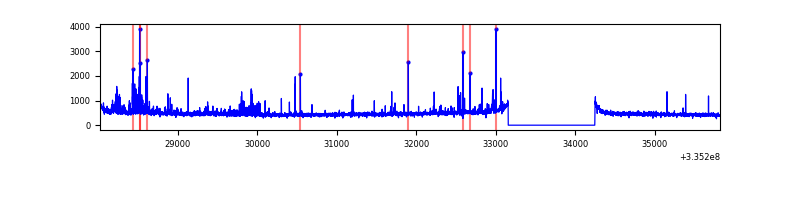 |
Top three noisy pixels from each quadrant. If the there are fewer than three noisy pixels in the level2.evt file, extra rows are filled as -1
| Pixel properties | Quadrant properties | ||||||
|---|---|---|---|---|---|---|---|
| Quadrant | DetID | PixID | Counts | Sigma | Mean | Median | Sigma |
| A | 0 | 13 | 148030 | 888.52 | 837 | 821 | 165.7 |
| A | 13 | 254 | 11511 | 64.52 | 837 | 821 | 165.7 |
| A | 5 | 203 | 10733 | 59.83 | 837 | 821 | 165.7 |
| B | 0 | 189 | 104760 | 669.1 | 839 | 817 | 155.3 |
| B | 5 | 172 | 75146 | 478.47 | 839 | 817 | 155.3 |
| B | 0 | 244 | 36878 | 232.13 | 839 | 817 | 155.3 |
| C | 3 | 233 | 1894701 | 10784.22 | 760 | 765 | 175.6 |
| C | 2 | 16 | 830549 | 4724.85 | 760 | 765 | 175.6 |
| C | 14 | 238 | 123927 | 701.29 | 760 | 765 | 175.6 |
| D | 1 | 52 | 217463 | 1123.76 | 809 | 790 | 192.8 |
| D | 2 | 234 | 32932 | 166.7 | 809 | 790 | 192.8 |
| D | 2 | 249 | 16456 | 81.25 | 809 | 790 | 192.8 |
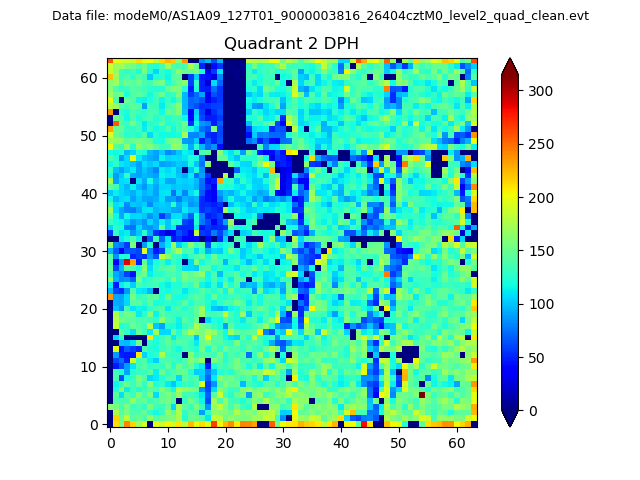
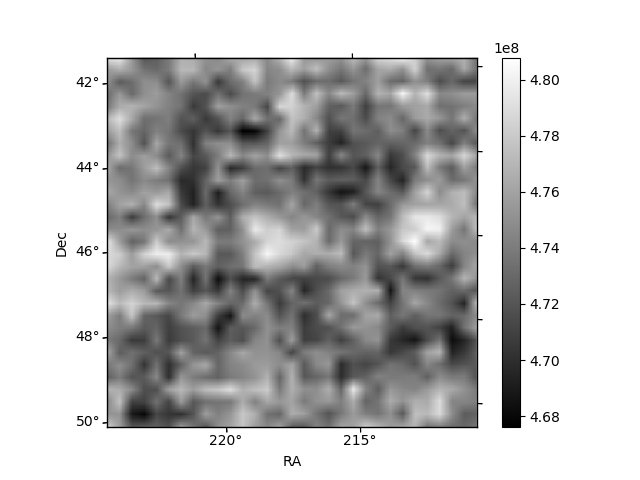
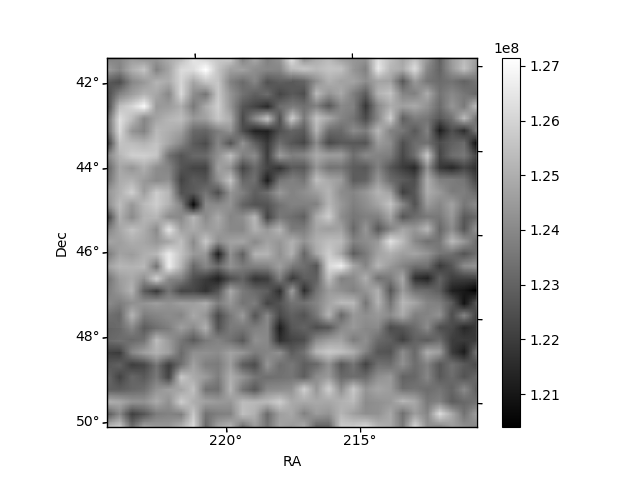
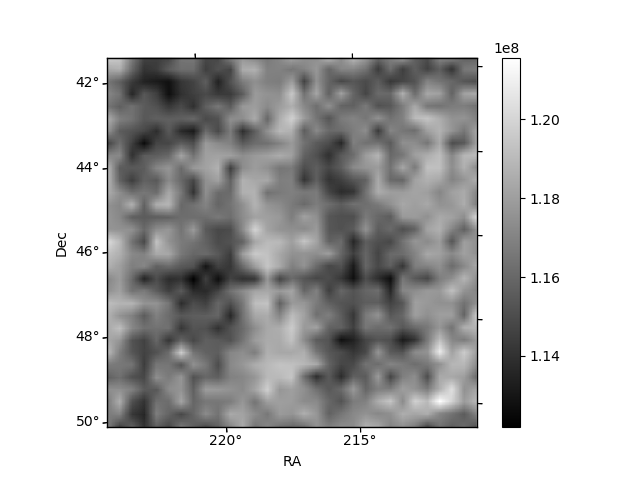
Histogram calculated using DETX and DETY for each event in the final _common_clean file
| Quadrant A | 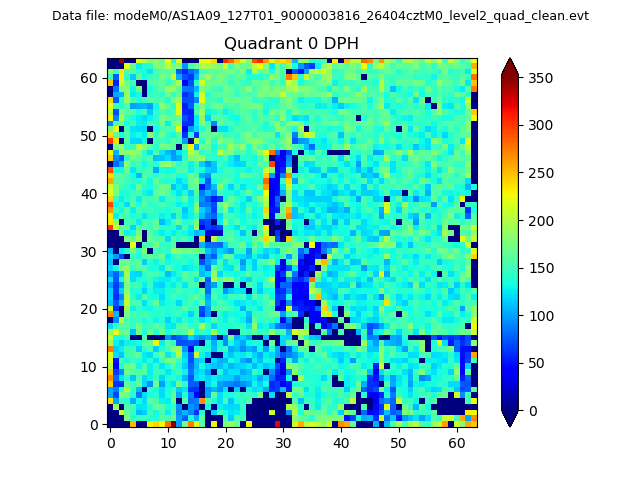 |
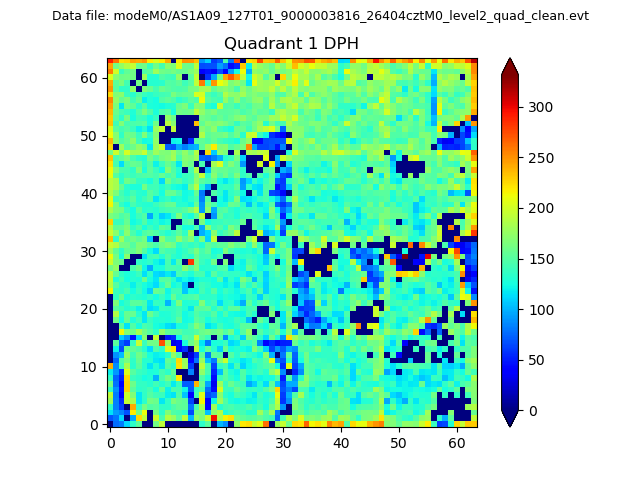 |
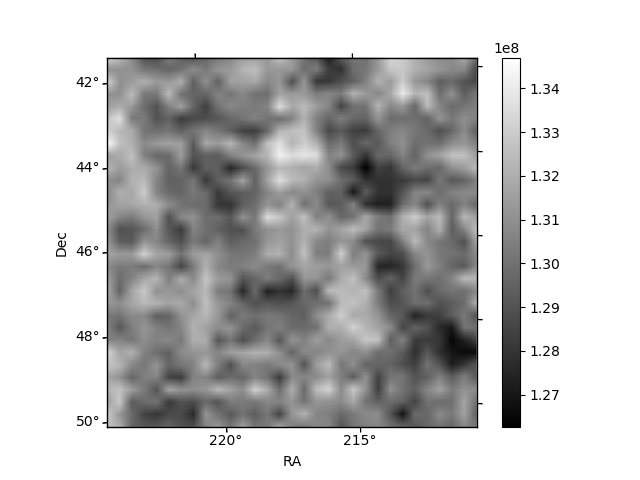
Quadrant B |
|---|---|---|---|
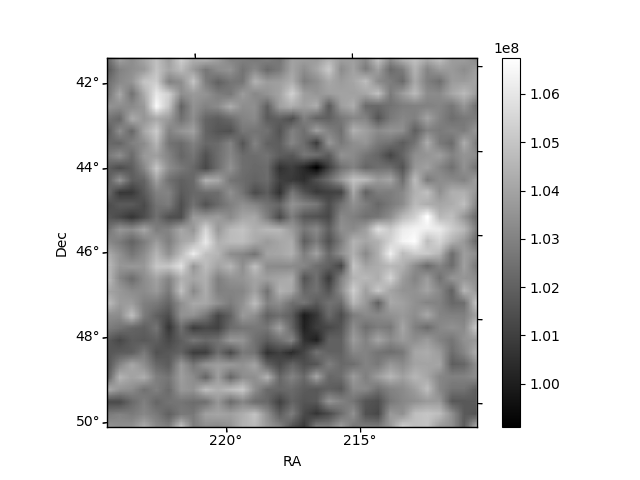
| Quadrant D | 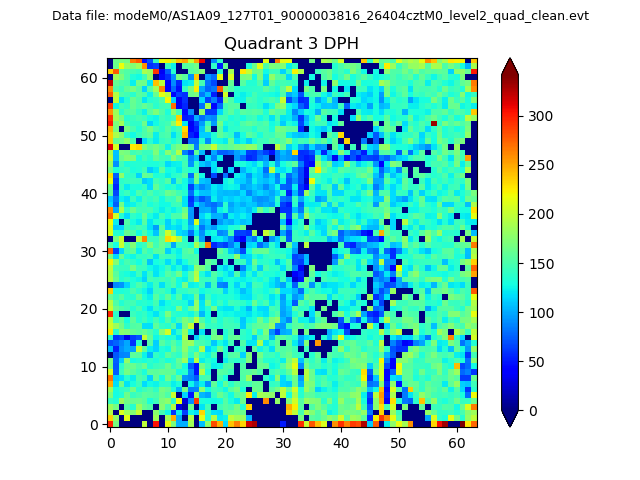 |
 |
Quadrant C |
| Plot type | Count rate plots | Images |
|---|---|---|
| Comparison with Poisson distribution Blue bars denote a histogram of data divided into 1 sec bins. Red curve is a Poisson curve with rate = median count rate of data. |
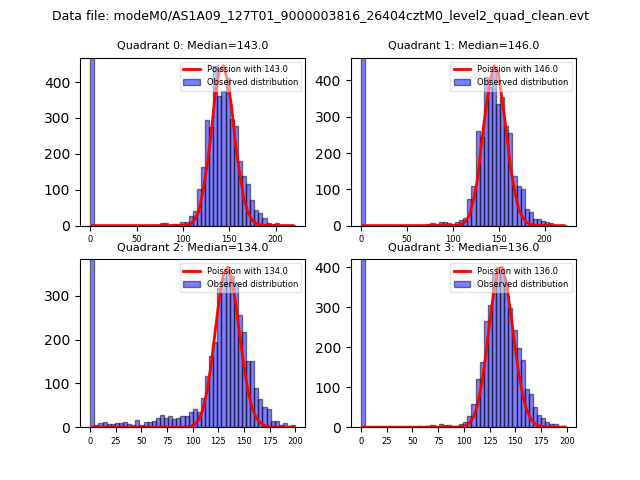 |
 |
| Quadrant-wise count rates Data is divided into 100 sec bins |
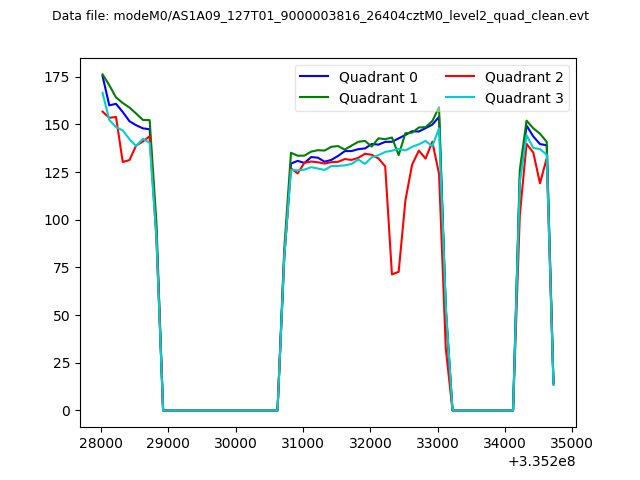 |
|
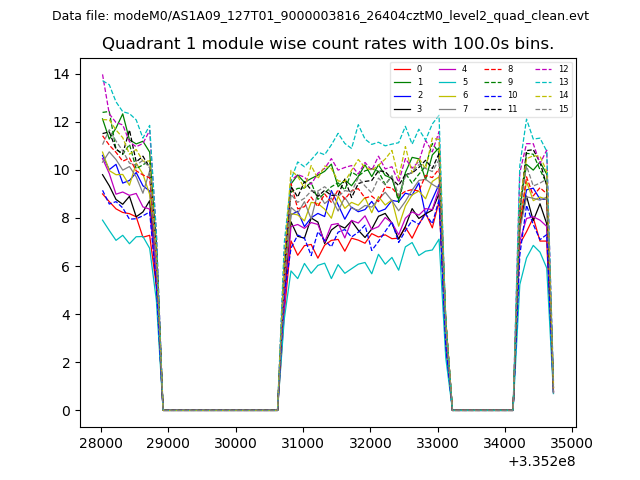
| Module-wise count rates for Quadrant A Data is divided into 100 sec bins |
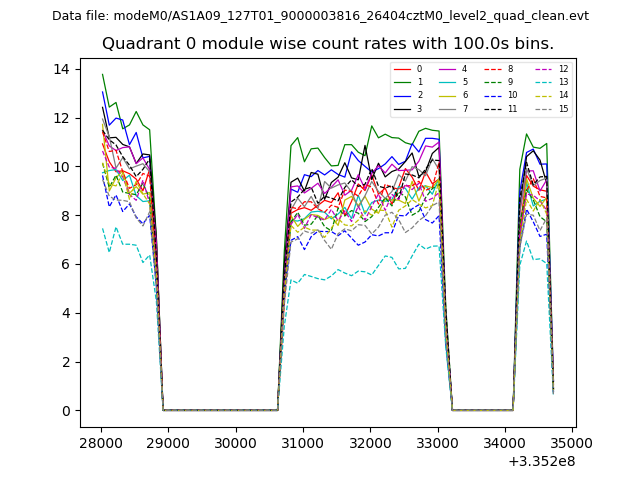 |
 |
| Module-wise count rates for Quadrant B Data is divided into 100 sec bins |
 |
 |
| Module-wise count rates for Quadrant C Data is divided into 100 sec bins |
 |
 |
| Module-wise count rates for Quadrant D Data is divided into 100 sec bins |
 |
 |
| Parameter | Plot |
|---|---|
| CZT HV Monitor | 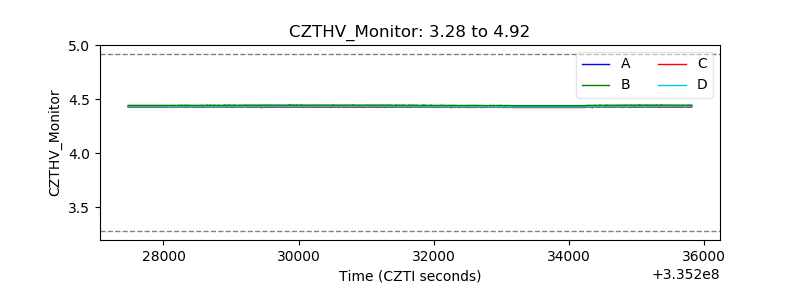 |
| D_VDD | 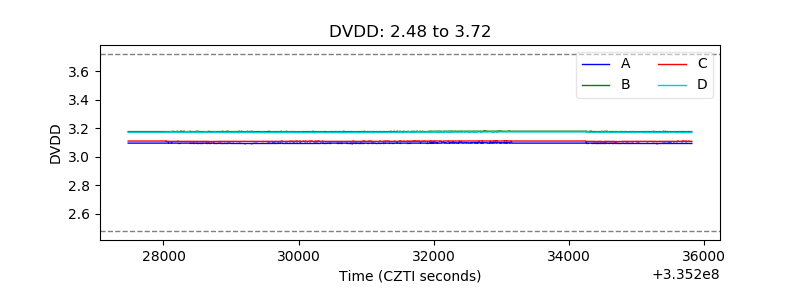 |
| Temperature 1 | 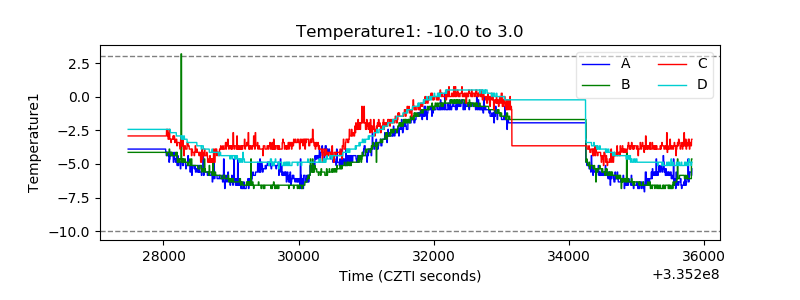 |
| Veto HV Monitor | 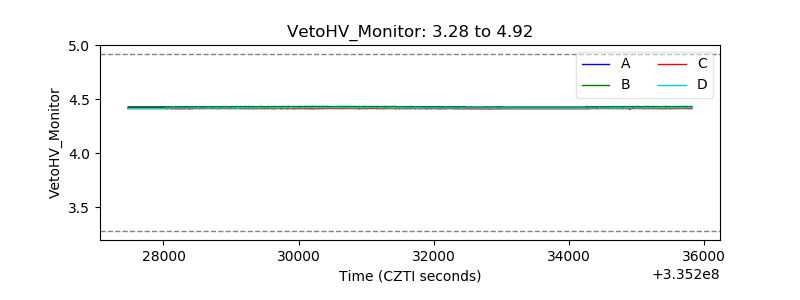 |
| Veto LLD | 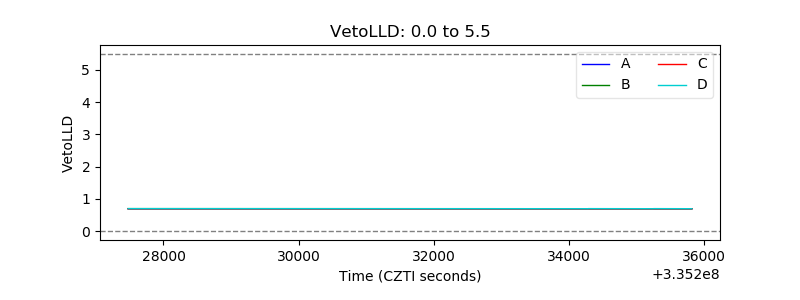 |
| Alpha Counter | 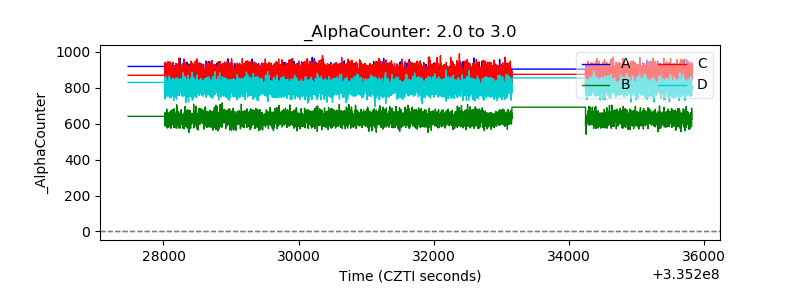 |
| _CPM_Rate | 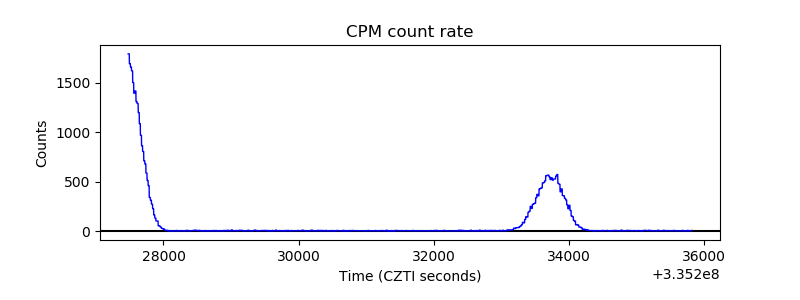 |
| CZT Counter | 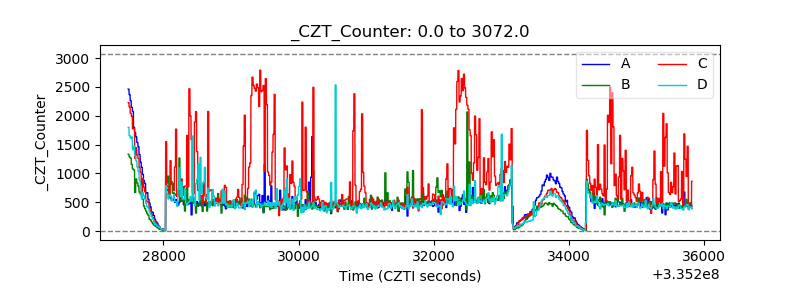 |
| +2.5 Volts monitor |  |
| +5 Volts monitor |  |
| _ROLL_ROT | 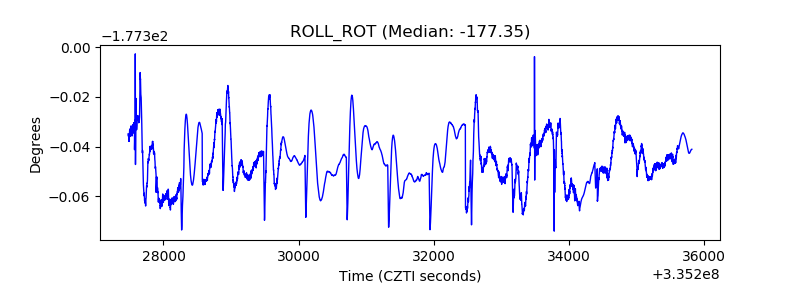 |
| _Roll_DEC | 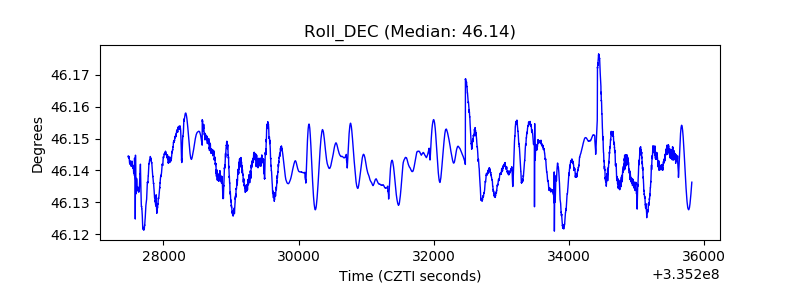 |
| _Roll_RA | 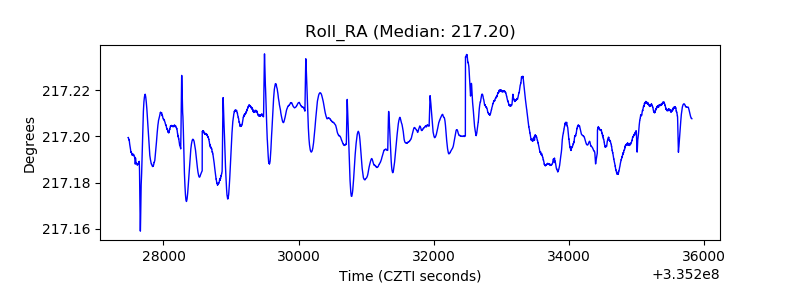 |
| Veto Counter |  |