| Param | Original file | Final file |
|---|---|---|
| Filename | modeM0/AS1A09_127T01_9000003816_26405cztM0_level2.evt | modeM0/AS1A09_127T01_9000003816_26405cztM0_level2_quad_clean.evt |
| Size (bytes) | 581,014,080 | 80,729,280 |
| Size | 554.1 MB | 77.0 MB |
| Events in quadrant A | 3,383,769 | 505,212 |
| Events in quadrant B | 4,637,976 | 500,250 |
| Events in quadrant C | 5,670,247 | 464,588 |
| Events in quadrant D | 3,428,005 | 485,163 |
| Mode M0 | |||
|---|---|---|---|
| Quadrant | BADHDUFLAG | Total packets | Discarded packets |
| A | 0 | 14552 | 0 |
| B | 0 | 18376 | 0 |
| C | 0 | 21539 | 0 |
| D | 0 | 15067 | 0 |
| Mode M9 | |||
|---|---|---|---|
| Quadrant | BADHDUFLAG | Total packets | Discarded packets |
| A | 0 | 18 | 0 |
| B | 0 | 19 | 0 |
| C | 0 | 19 | 0 |
| D | 0 | 19 | 0 |
| Quadrant | Total seconds | Saturated seconds | Saturation percentage |
|---|---|---|---|
| A | 7023 | 68 | 0.968247% |
| B | 7023 | 539 | 7.674783% |
| C | 7023 | 626 | 8.913570% |
| D | 7022 | 68 | 0.968385% |
Noise dominated data is calculated using 1-second bins in cleaned event files. If a bin has >2000 counts, and if more than 50% of those come from <1% of pixels, then it is considered to be noise-dominated and hence unusable.
| Quadrant | # 1 sec bins | Bins with >0 counts | Bins with >2000 counts | High rate bins dominated by noise | Noise dominated (total time) | Noise dominated (detector-on time) | Marked lightcurve |
|---|---|---|---|---|---|---|---|
| A | 7738 | 7024 | 11 | 11 | 0.14% | 0.16% | 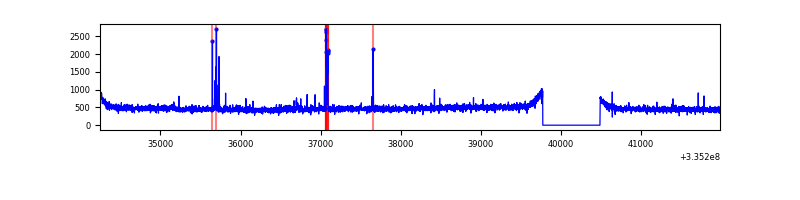 |
| B | 7738 | 7024 | 276 | 276 | 3.57% | 3.93% | 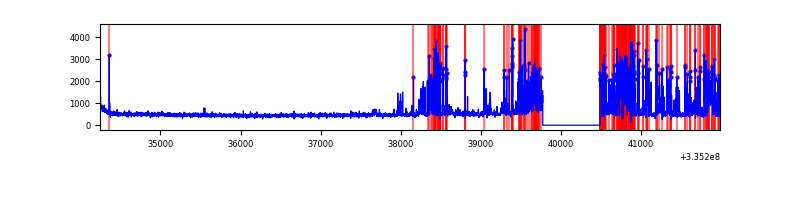 |
| C | 7738 | 7024 | 243 | 243 | 3.14% | 3.46% | 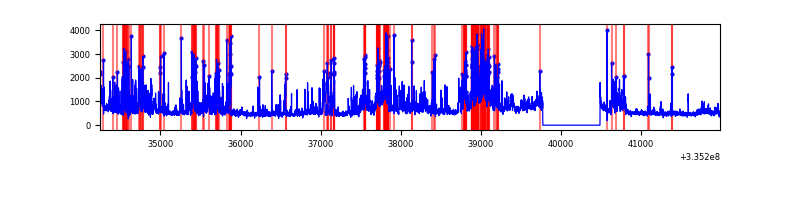 |
| D | 7737 | 7023 | 25 | 25 | 0.32% | 0.36% | 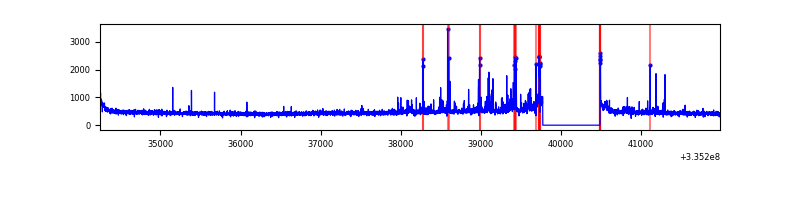 |
Top three noisy pixels from each quadrant. If the there are fewer than three noisy pixels in the level2.evt file, extra rows are filled as -1
| Pixel properties | Quadrant properties | ||||||
|---|---|---|---|---|---|---|---|
| Quadrant | DetID | PixID | Counts | Sigma | Mean | Median | Sigma |
| A | 0 | 13 | 72800 | 420.36 | 854 | 837 | 171.2 |
| A | 13 | 254 | 12197 | 66.36 | 854 | 837 | 171.2 |
| A | 5 | 203 | 11666 | 63.26 | 854 | 837 | 171.2 |
| B | 0 | 189 | 987176 | 6333.81 | 827 | 806 | 155.7 |
| B | 5 | 172 | 320332 | 2051.78 | 827 | 806 | 155.7 |
| B | 0 | 244 | 63792 | 404.45 | 827 | 806 | 155.7 |
| C | 3 | 233 | 1766385 | 9396.78 | 804 | 810 | 187.9 |
| C | 2 | 16 | 515069 | 2737.0 | 804 | 810 | 187.9 |
| C | 14 | 238 | 128895 | 681.7 | 804 | 810 | 187.9 |
| D | 1 | 52 | 108699 | 545.23 | 828 | 808 | 197.9 |
| D | 12 | 233 | 96290 | 482.52 | 828 | 808 | 197.9 |
| D | 15 | 0 | 48258 | 239.79 | 828 | 808 | 197.9 |
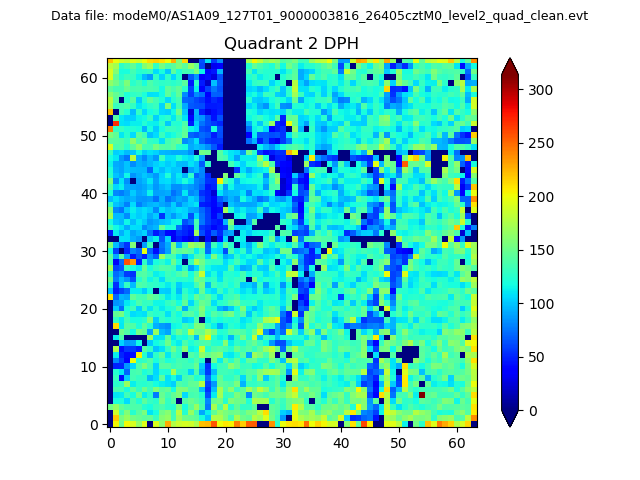
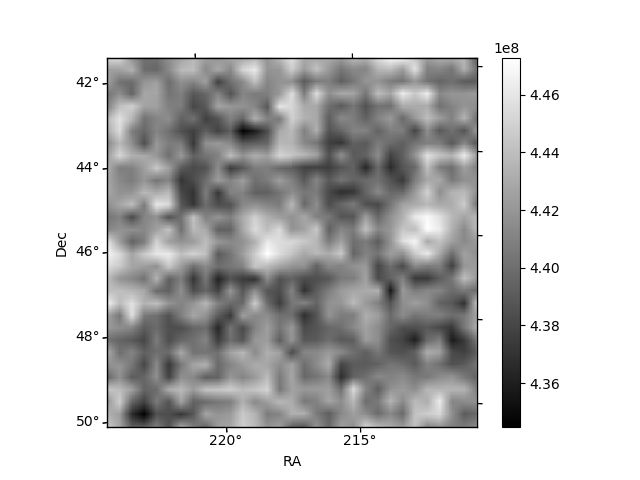
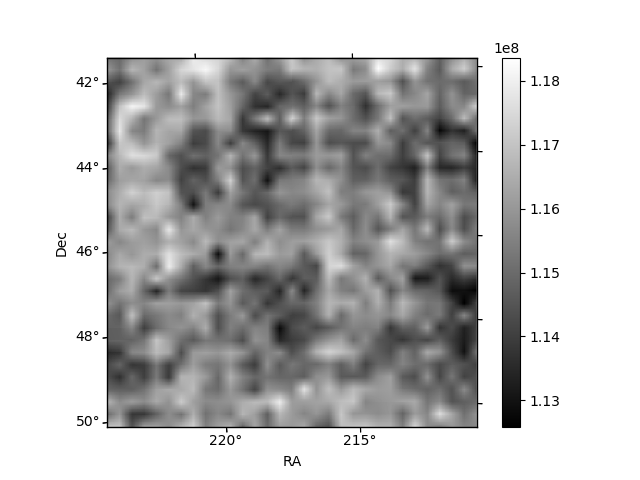
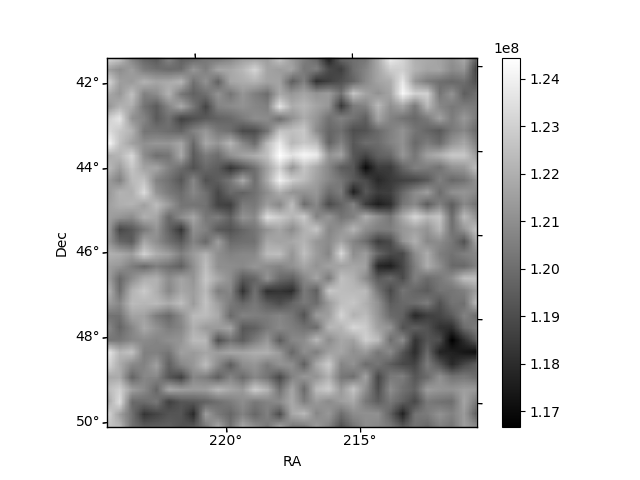
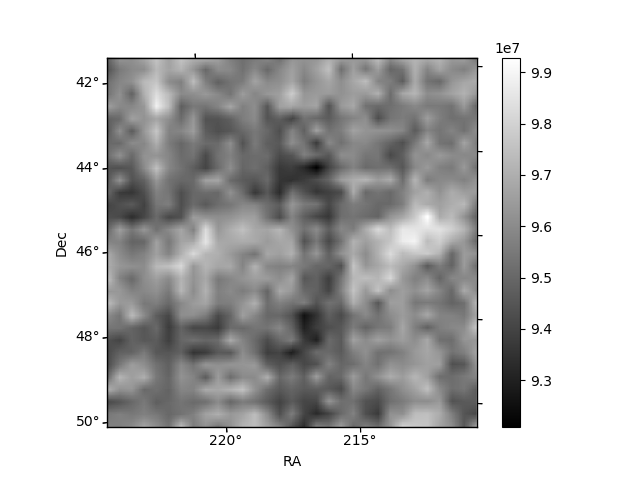
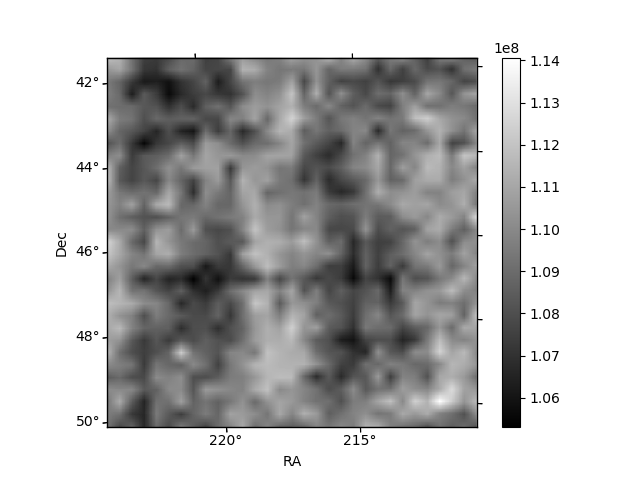
Histogram calculated using DETX and DETY for each event in the final _common_clean file
| Quadrant A | 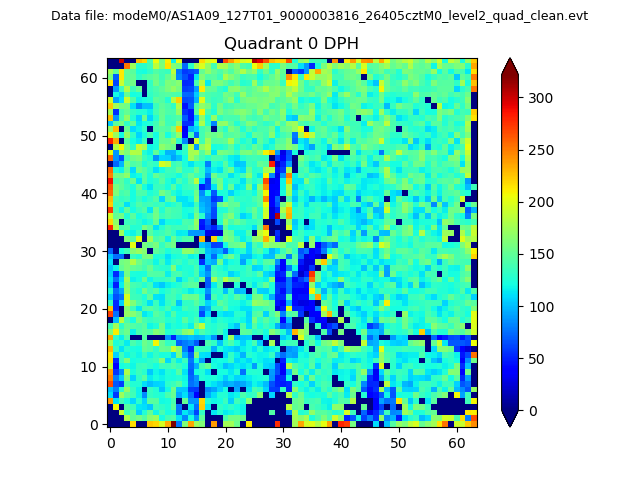 |
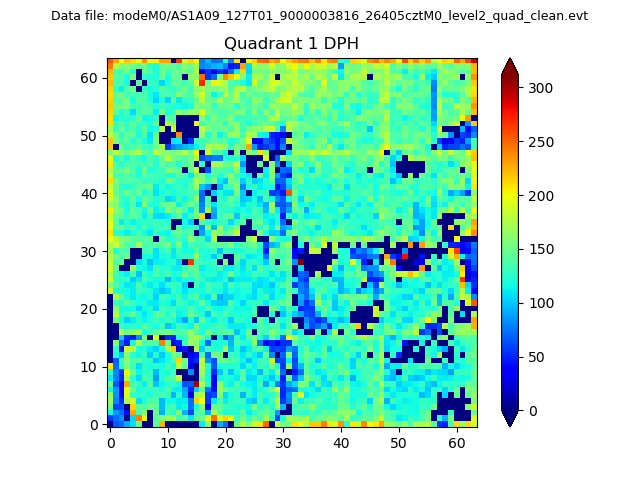 |
Quadrant B |
|---|---|---|---|
| Quadrant D | 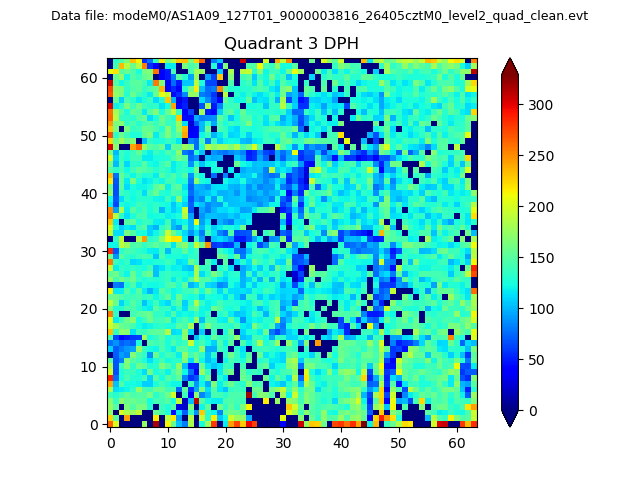 |
 |
Quadrant C |
| Plot type | Count rate plots | Images |
|---|---|---|
| Comparison with Poisson distribution Blue bars denote a histogram of data divided into 1 sec bins. Red curve is a Poisson curve with rate = median count rate of data. |
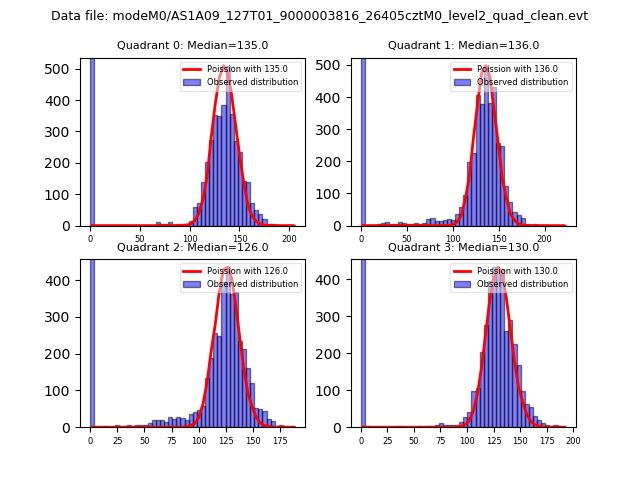 |
 |
| Quadrant-wise count rates Data is divided into 100 sec bins |
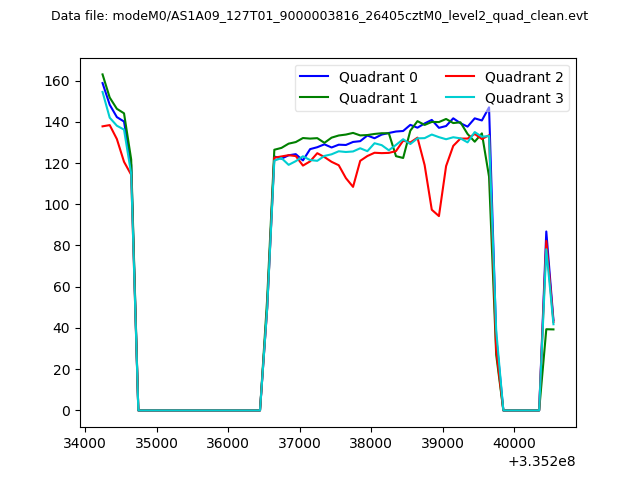 |
|
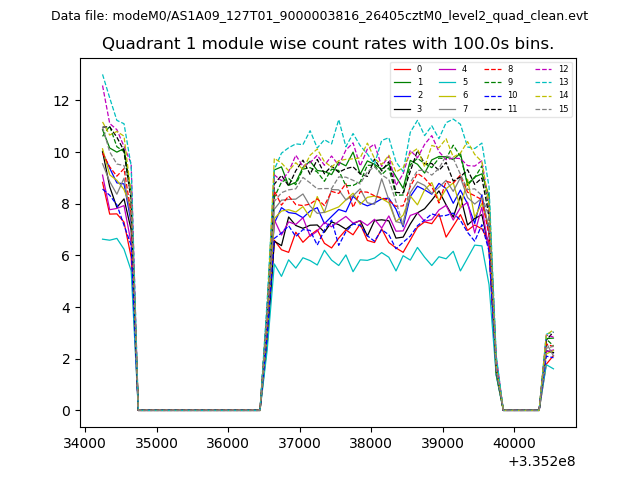
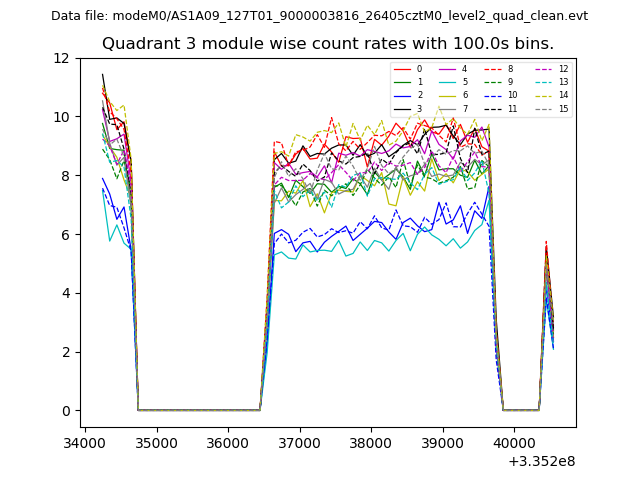
| Module-wise count rates for Quadrant A Data is divided into 100 sec bins |
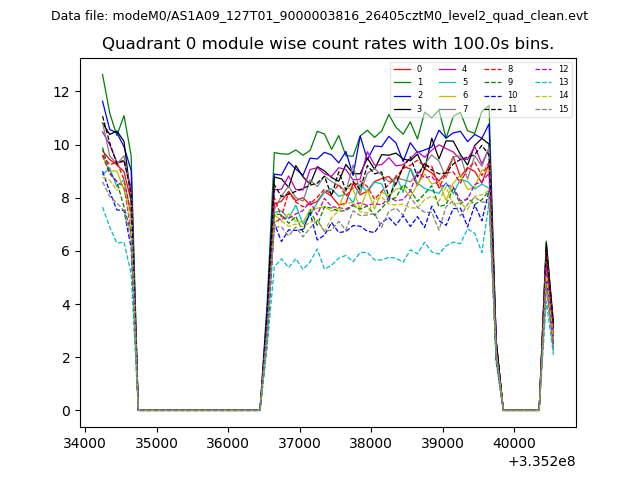 |
 |
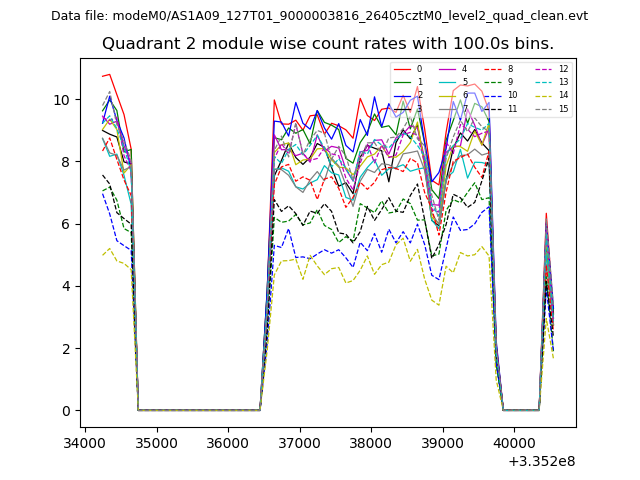
| Module-wise count rates for Quadrant B Data is divided into 100 sec bins |
 |
 |
| Module-wise count rates for Quadrant C Data is divided into 100 sec bins |
 |
 |
| Module-wise count rates for Quadrant D Data is divided into 100 sec bins |
 |
 |
| Parameter | Plot |
|---|---|
| CZT HV Monitor | 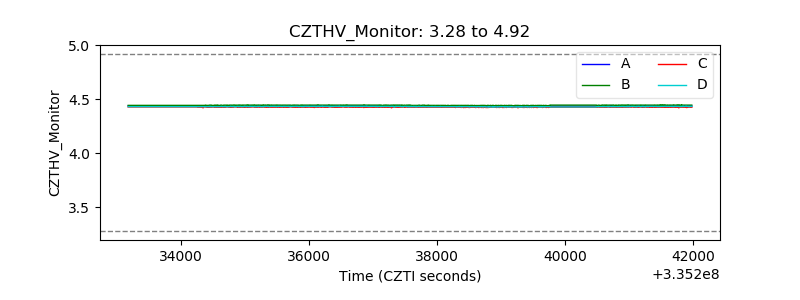 |
| D_VDD | 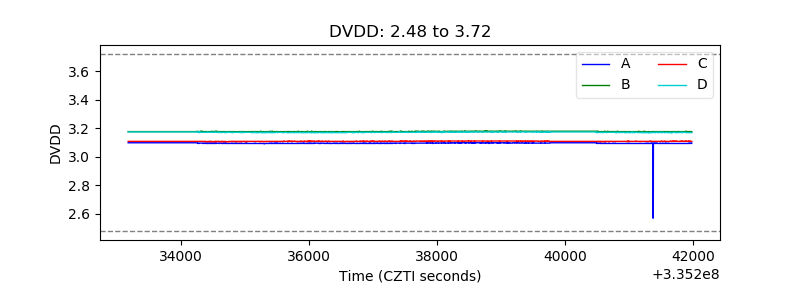 |
| Temperature 1 | 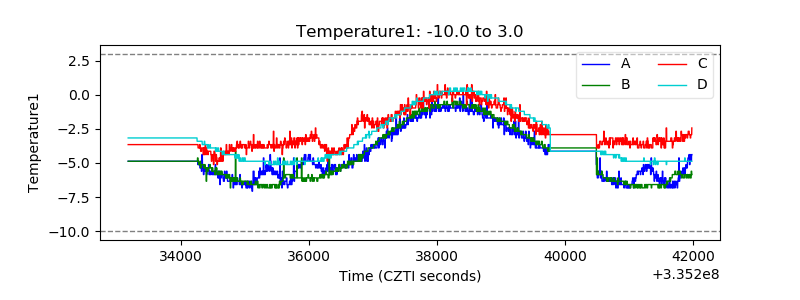 |
| Veto HV Monitor | 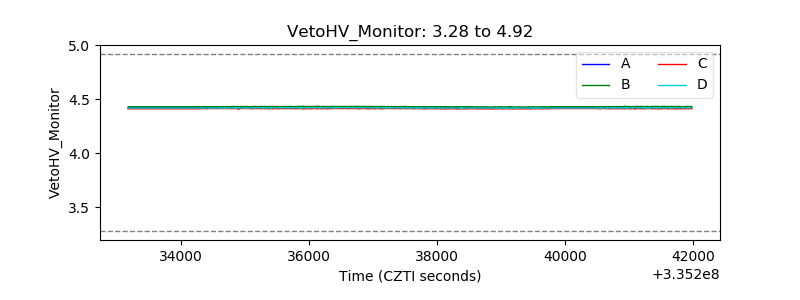 |
| Veto LLD | 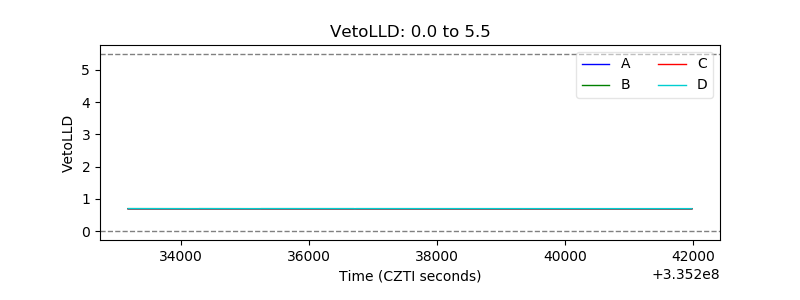 |
| Alpha Counter | 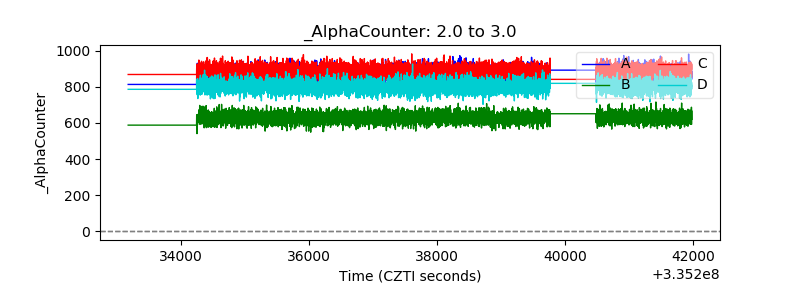 |
| _CPM_Rate | 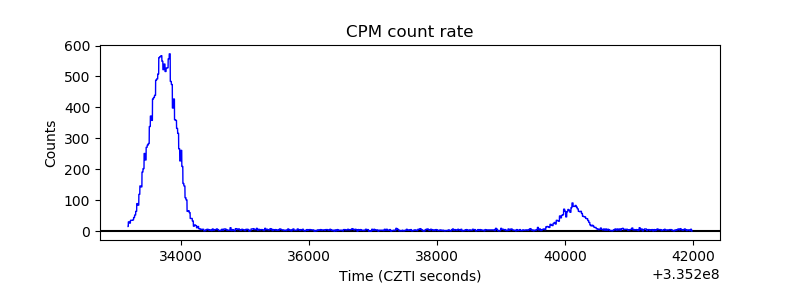 |
| CZT Counter | 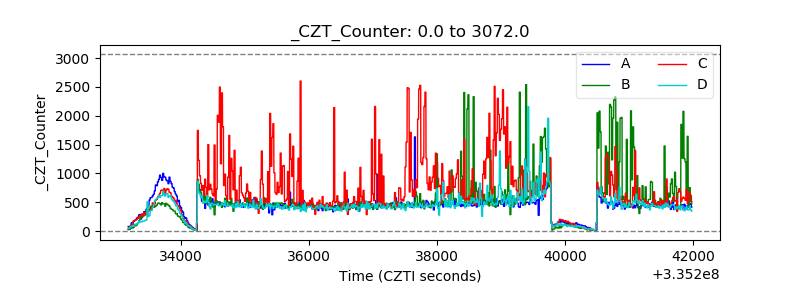 |
| +2.5 Volts monitor | 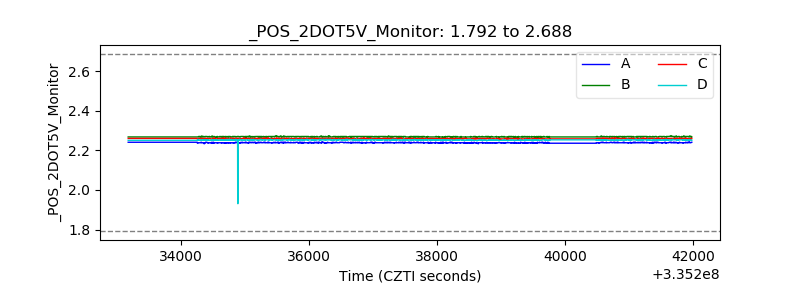 |
| +5 Volts monitor | 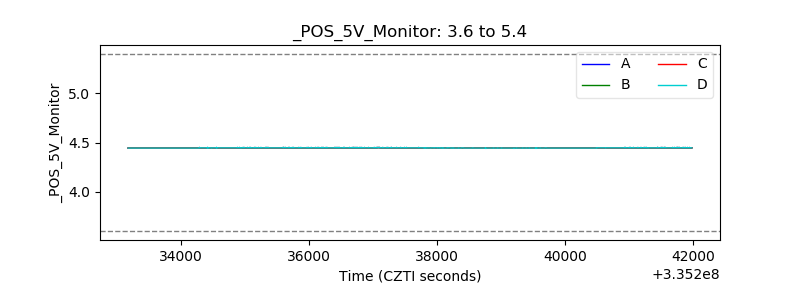 |
| _ROLL_ROT | 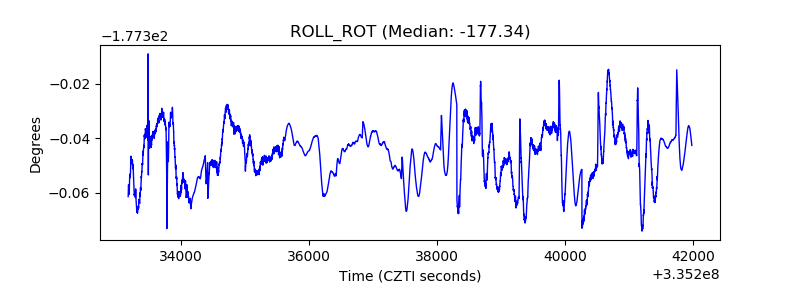 |
| _Roll_DEC | 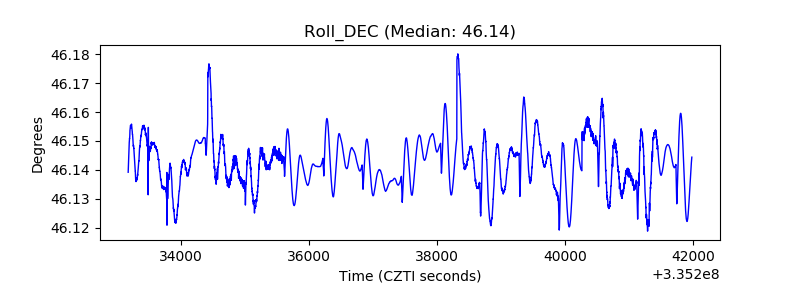 |
| _Roll_RA | 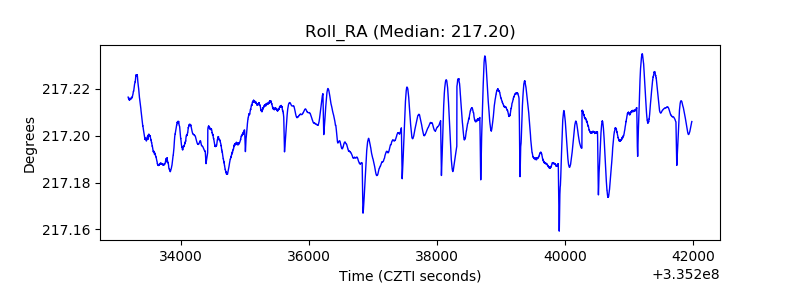 |
| Veto Counter | 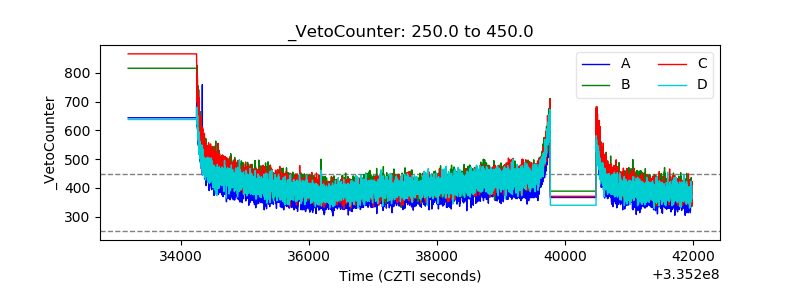 |