| Param | Original file | Final file |
|---|---|---|
| Filename | modeM0/AS1A09_127T01_9000003816_26406cztM0_level2.evt | modeM0/AS1A09_127T01_9000003816_26406cztM0_level2_quad_clean.evt |
| Size (bytes) | 657,748,800 | 80,959,680 |
| Size | 627.3 MB | 77.2 MB |
| Events in quadrant A | 3,396,486 | 512,336 |
| Events in quadrant B | 5,752,326 | 493,691 |
| Events in quadrant C | 5,868,382 | 465,558 |
| Events in quadrant D | 4,408,162 | 471,029 |
| Mode M0 | |||
|---|---|---|---|
| Quadrant | BADHDUFLAG | Total packets | Discarded packets |
| A | 0 | 14935 | 0 |
| B | 0 | 21999 | 0 |
| C | 0 | 22286 | 0 |
| D | 0 | 18230 | 0 |
| Mode M9 | |||
|---|---|---|---|
| Quadrant | BADHDUFLAG | Total packets | Discarded packets |
| A | 0 | 3 | 0 |
| B | 0 | 3 | 0 |
| C | 0 | 3 | 0 |
| D | 0 | 3 | 0 |
| Quadrant | Total seconds | Saturated seconds | Saturation percentage |
|---|---|---|---|
| A | 7301 | 103 | 1.410766% |
| B | 7302 | 792 | 10.846343% |
| C | 7302 | 762 | 10.435497% |
| D | 7302 | 406 | 5.560121% |
Noise dominated data is calculated using 1-second bins in cleaned event files. If a bin has >2000 counts, and if more than 50% of those come from <1% of pixels, then it is considered to be noise-dominated and hence unusable.
| Quadrant | # 1 sec bins | Bins with >0 counts | Bins with >2000 counts | High rate bins dominated by noise | Noise dominated (total time) | Noise dominated (detector-on time) | Marked lightcurve |
|---|---|---|---|---|---|---|---|
| A | 7576 | 7302 | 2 | 2 | 0.03% | 0.03% |  |
| B | 7577 | 7303 | 401 | 401 | 5.29% | 5.49% |  |
| C | 7577 | 7303 | 325 | 325 | 4.29% | 4.45% |  |
| D | 7577 | 7303 | 291 | 291 | 3.84% | 3.98% |  |
Top three noisy pixels from each quadrant. If the there are fewer than three noisy pixels in the level2.evt file, extra rows are filled as -1
| Pixel properties | Quadrant properties | ||||||
|---|---|---|---|---|---|---|---|
| Quadrant | DetID | PixID | Counts | Sigma | Mean | Median | Sigma |
| A | 5 | 203 | 12599 | 66.9 | 874 | 854 | 175.6 |
| A | 13 | 254 | 12039 | 63.71 | 874 | 854 | 175.6 |
| A | 0 | 13 | 11282 | 59.4 | 874 | 854 | 175.6 |
| B | 0 | 189 | 1794731 | 11109.02 | 842 | 820 | 161.5 |
| B | 5 | 172 | 528012 | 3264.7 | 842 | 820 | 161.5 |
| B | 0 | 230 | 60202 | 367.73 | 842 | 820 | 161.5 |
| C | 3 | 233 | 1761053 | 9133.53 | 821 | 825 | 192.7 |
| C | 4 | 254 | 505333 | 2617.81 | 821 | 825 | 192.7 |
| C | 2 | 16 | 247558 | 1280.26 | 821 | 825 | 192.7 |
| D | 12 | 233 | 1130119 | 5730.55 | 831 | 809 | 197.1 |
| D | 1 | 52 | 61457 | 307.75 | 831 | 809 | 197.1 |
| D | 2 | 234 | 34803 | 172.5 | 831 | 809 | 197.1 |
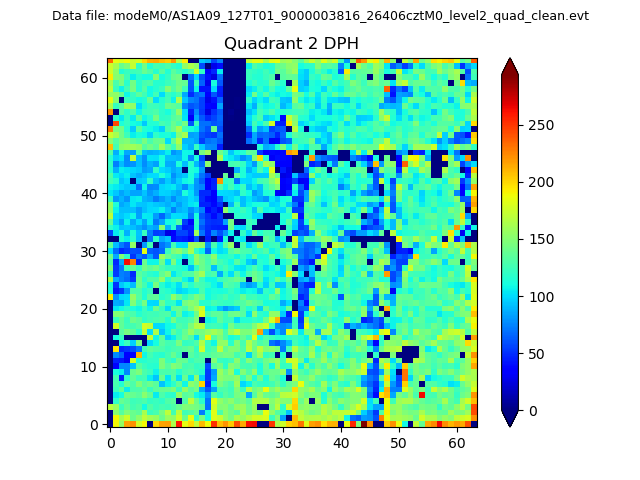
Histogram calculated using DETX and DETY for each event in the final _common_clean file
| Quadrant A | 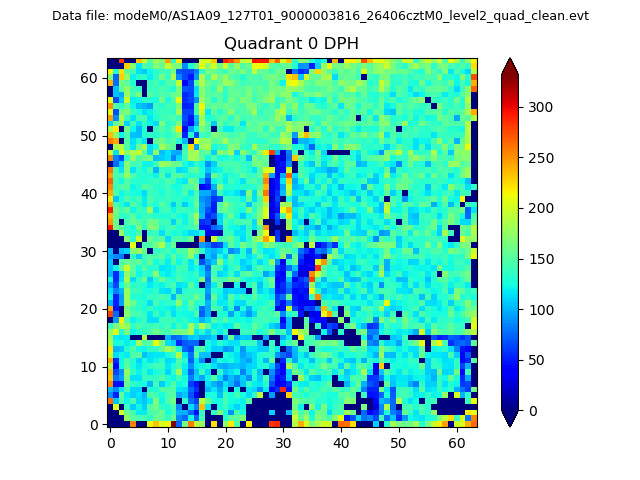 |
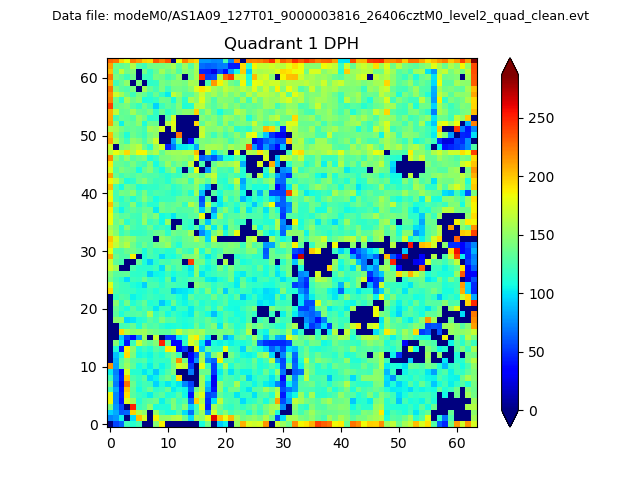 |
Quadrant B |
|---|---|---|---|
| Quadrant D | 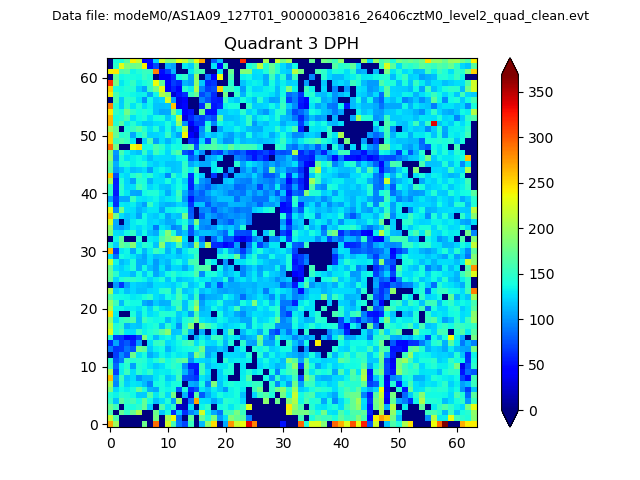 |
 |
Quadrant C |
| Plot type | Count rate plots | Images |
|---|---|---|
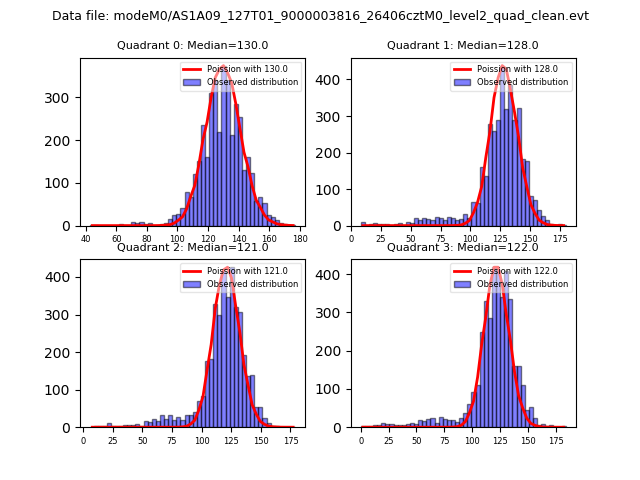
| Comparison with Poisson distribution Blue bars denote a histogram of data divided into 1 sec bins. Red curve is a Poisson curve with rate = median count rate of data. |
 |
 |
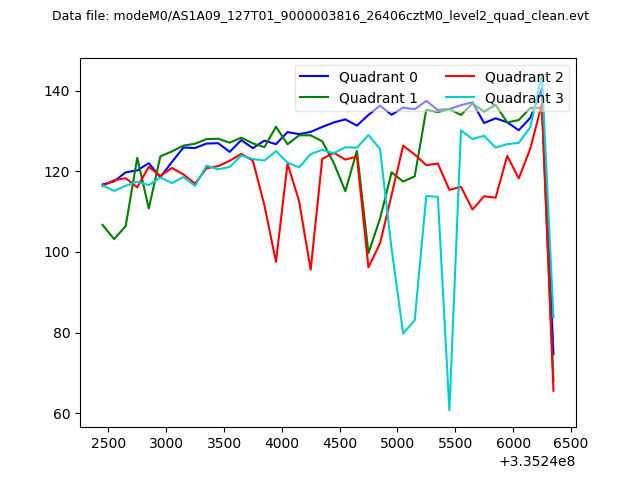
| Quadrant-wise count rates Data is divided into 100 sec bins |
 |
|
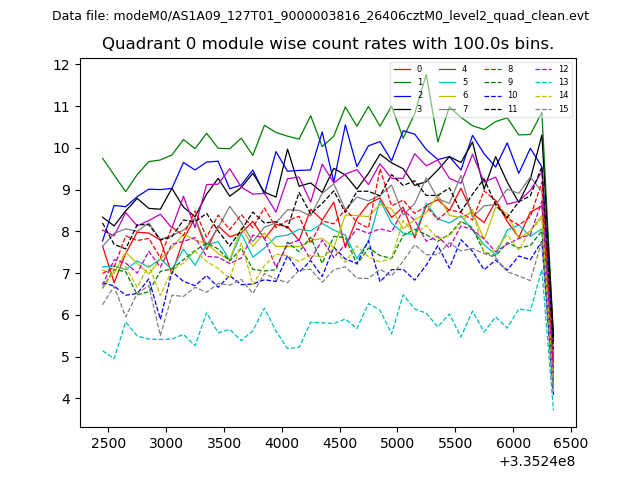
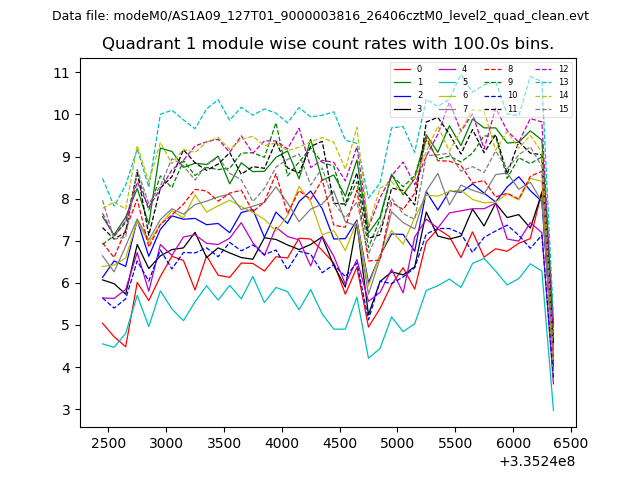
| Module-wise count rates for Quadrant A Data is divided into 100 sec bins |
 |
 |
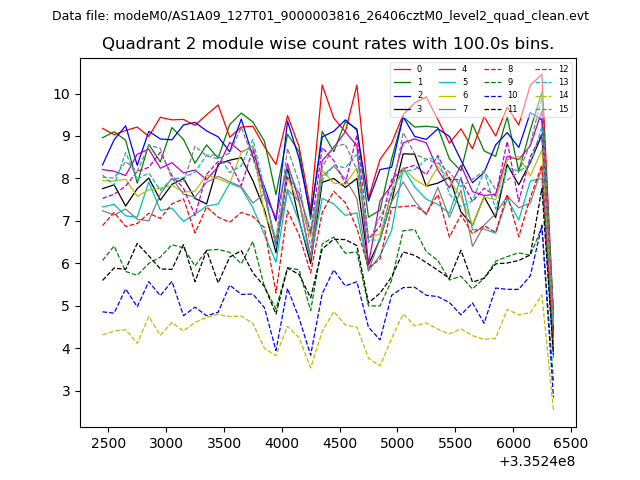
| Module-wise count rates for Quadrant B Data is divided into 100 sec bins |
 |
 |
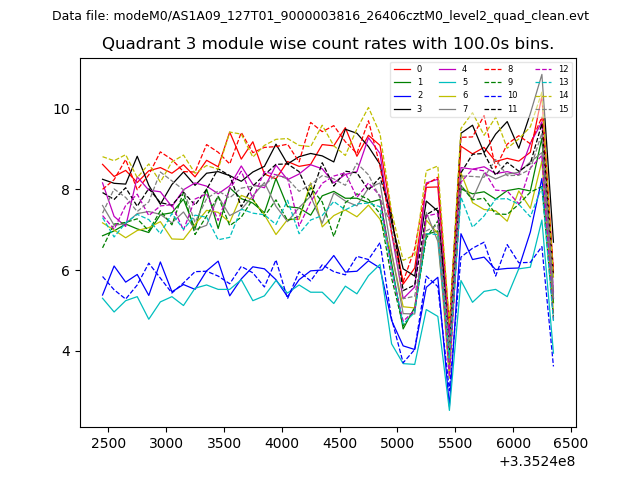
| Module-wise count rates for Quadrant C Data is divided into 100 sec bins |
 |
 |
| Module-wise count rates for Quadrant D Data is divided into 100 sec bins |
 |
 |
| Parameter | Plot |
|---|---|
| CZT HV Monitor | 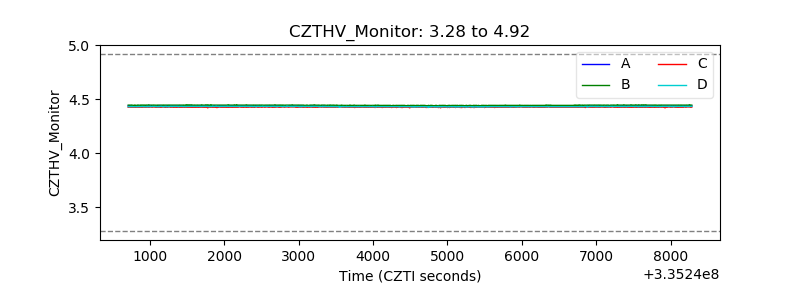 |
| D_VDD | 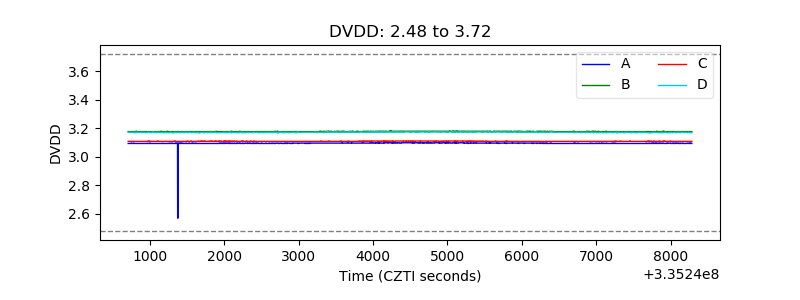 |
| Temperature 1 | 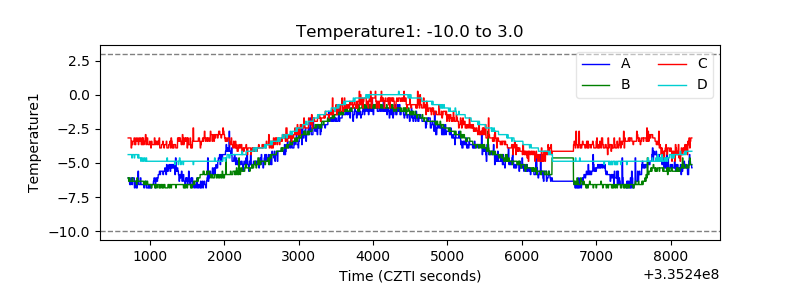 |
| Veto HV Monitor | 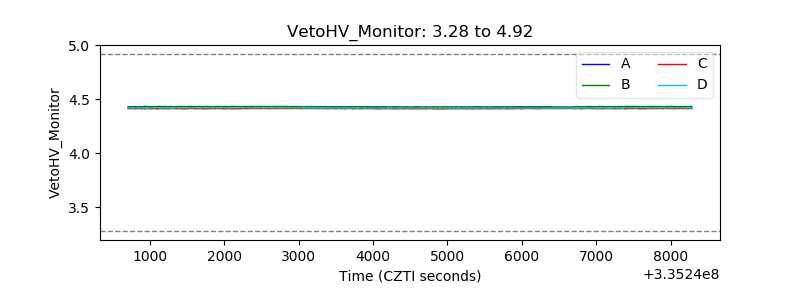 |
| Veto LLD | 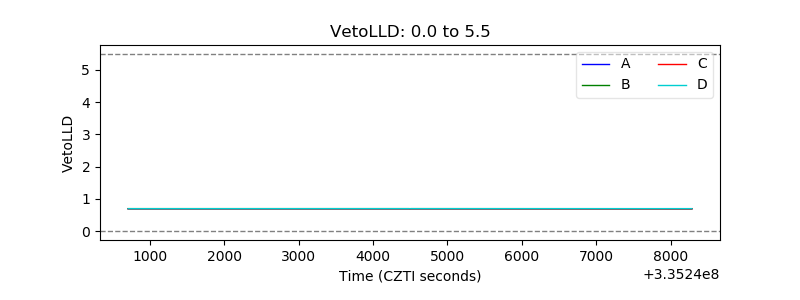 |
| Alpha Counter | 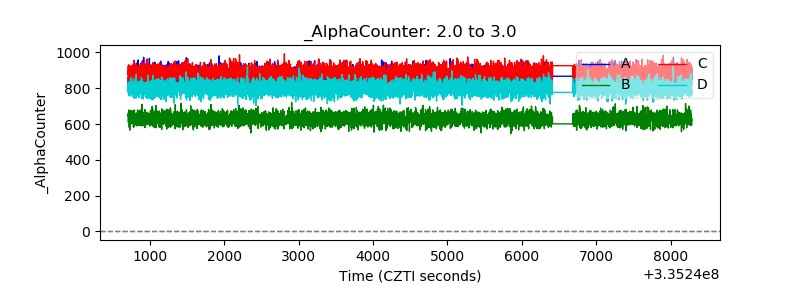 |
| _CPM_Rate | 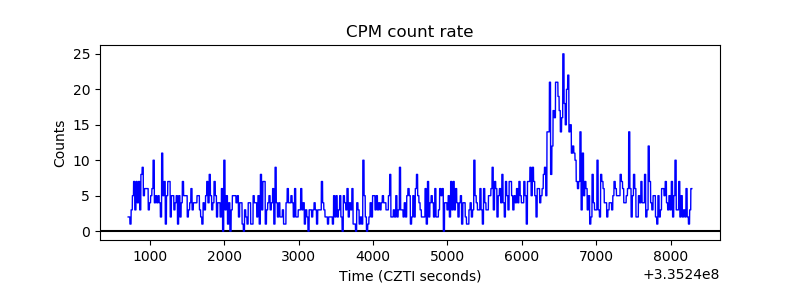 |
| CZT Counter | 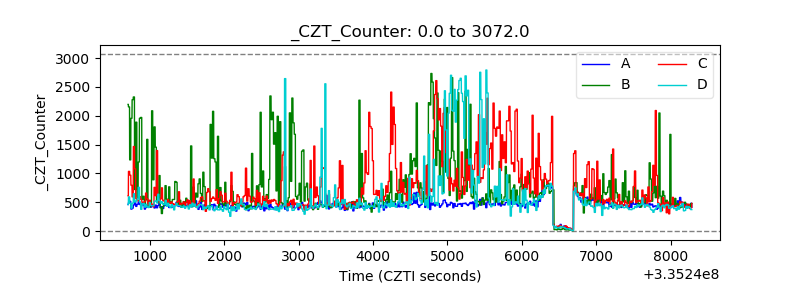 |
| +2.5 Volts monitor |  |
| +5 Volts monitor |  |
| _ROLL_ROT | 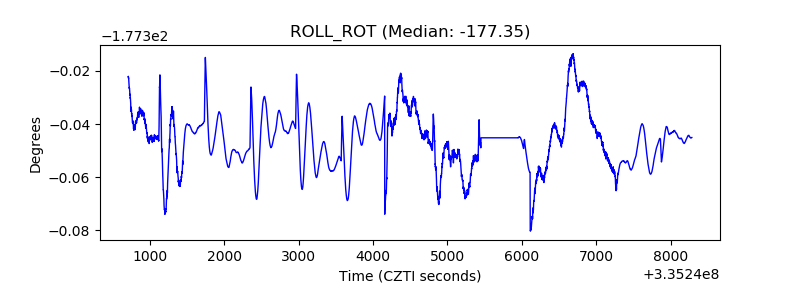 |
| _Roll_DEC | 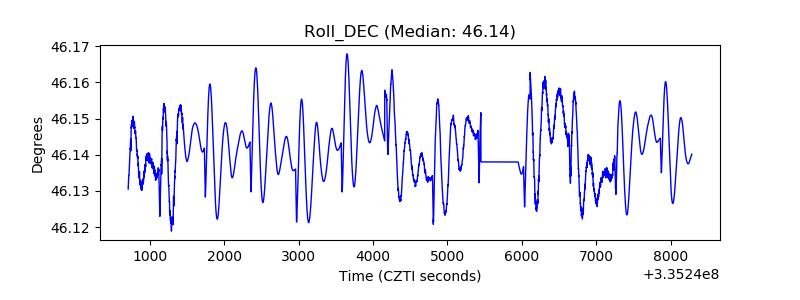 |
| _Roll_RA | 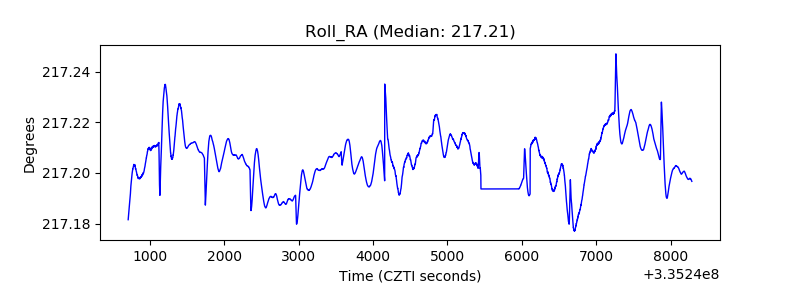 |
| Veto Counter | 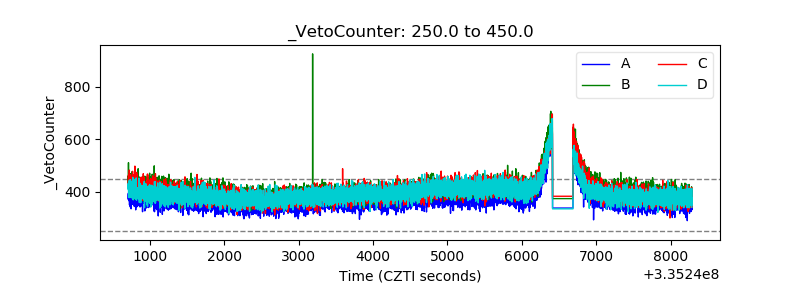 |