| Param | Original file | Final file |
|---|---|---|
| Filename | modeM0/AS1A09_127T01_9000003816_26407cztM0_level2.evt | modeM0/AS1A09_127T01_9000003816_26407cztM0_level2_quad_clean.evt |
| Size (bytes) | 639,005,760 | 97,928,640 |
| Size | 609.4 MB | 93.4 MB |
| Events in quadrant A | 3,961,595 | 611,534 |
| Events in quadrant B | 4,920,097 | 614,615 |
| Events in quadrant C | 5,301,021 | 588,839 |
| Events in quadrant D | 4,620,288 | 587,158 |
| Mode M0 | |||
|---|---|---|---|
| Quadrant | BADHDUFLAG | Total packets | Discarded packets |
| A | 0 | 17164 | 0 |
| B | 0 | 19919 | 0 |
| C | 0 | 21068 | 0 |
| D | 0 | 19359 | 0 |
| Mode M9 | |||
|---|---|---|---|
| Quadrant | BADHDUFLAG | Total packets | Discarded packets |
| A | 0 | 6 | 0 |
| B | 0 | 6 | 0 |
| C | 0 | 6 | 0 |
| D | 0 | 6 | 0 |
| Quadrant | Total seconds | Saturated seconds | Saturation percentage |
|---|---|---|---|
| A | 8111 | 221 | 2.724695% |
| B | 8112 | 439 | 5.411736% |
| C | 8111 | 503 | 6.201455% |
| D | 8111 | 300 | 3.698681% |
Noise dominated data is calculated using 1-second bins in cleaned event files. If a bin has >2000 counts, and if more than 50% of those come from <1% of pixels, then it is considered to be noise-dominated and hence unusable.
| Quadrant | # 1 sec bins | Bins with >0 counts | Bins with >2000 counts | High rate bins dominated by noise | Noise dominated (total time) | Noise dominated (detector-on time) | Marked lightcurve |
|---|---|---|---|---|---|---|---|
| A | 8616 | 8113 | 7 | 7 | 0.08% | 0.09% | 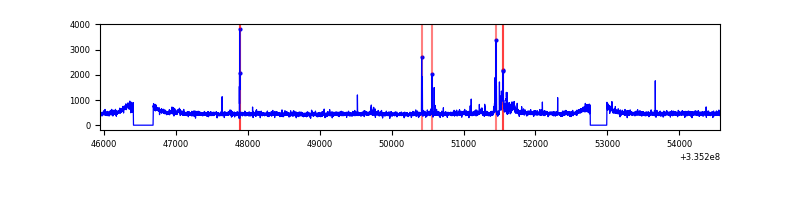 |
| B | 8617 | 8114 | 96 | 96 | 1.11% | 1.18% | 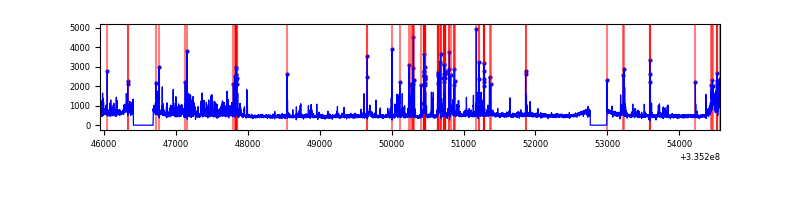 |
| C | 8616 | 8113 | 114 | 114 | 1.32% | 1.41% | 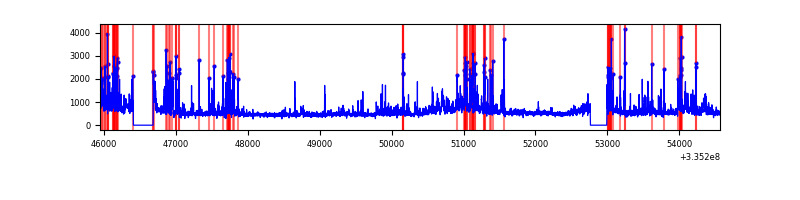 |
| D | 8616 | 8113 | 126 | 126 | 1.46% | 1.55% | 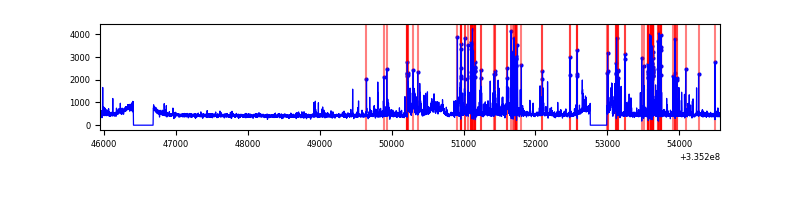 |
Top three noisy pixels from each quadrant. If the there are fewer than three noisy pixels in the level2.evt file, extra rows are filled as -1
| Pixel properties | Quadrant properties | ||||||
|---|---|---|---|---|---|---|---|
| Quadrant | DetID | PixID | Counts | Sigma | Mean | Median | Sigma |
| A | 0 | 13 | 158855 | 790.39 | 983 | 959 | 199.8 |
| A | 13 | 254 | 13794 | 64.25 | 983 | 959 | 199.8 |
| A | 5 | 203 | 12699 | 58.77 | 983 | 959 | 199.8 |
| B | 0 | 189 | 657444 | 3500.83 | 974 | 946 | 187.5 |
| B | 5 | 172 | 338128 | 1798.05 | 974 | 946 | 187.5 |
| B | 0 | 230 | 35452 | 184.01 | 974 | 946 | 187.5 |
| C | 3 | 233 | 781582 | 3516.7 | 939 | 941 | 222.0 |
| C | 4 | 254 | 382567 | 1719.18 | 939 | 941 | 222.0 |
| C | 2 | 16 | 301497 | 1353.97 | 939 | 941 | 222.0 |
| D | 1 | 52 | 868292 | 3868.11 | 949 | 926 | 224.2 |
| D | 12 | 233 | 51434 | 225.25 | 949 | 926 | 224.2 |
| D | 2 | 234 | 43004 | 187.65 | 949 | 926 | 224.2 |
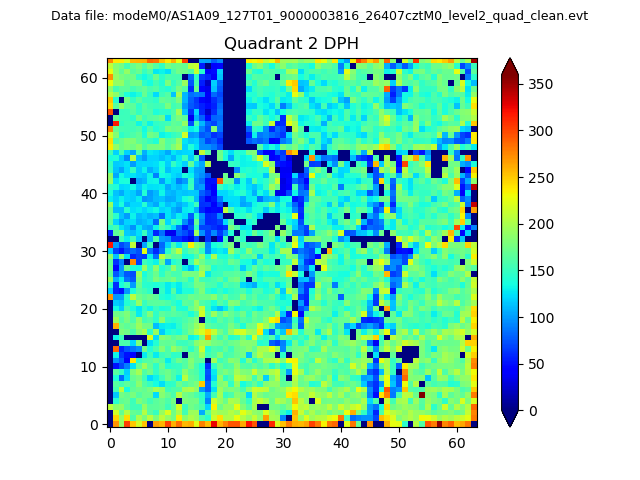
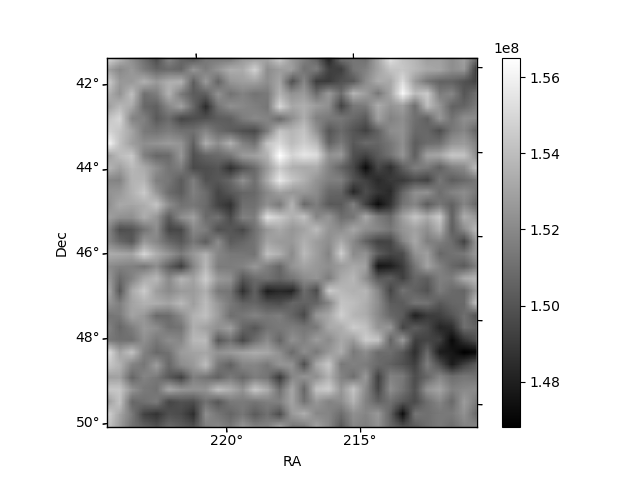
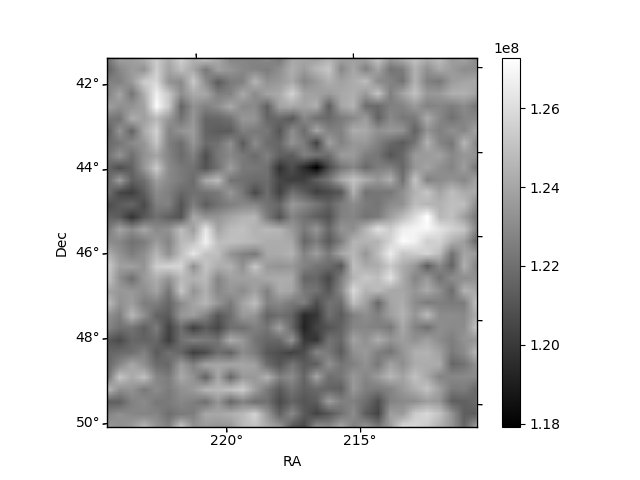
Histogram calculated using DETX and DETY for each event in the final _common_clean file
| Quadrant A | 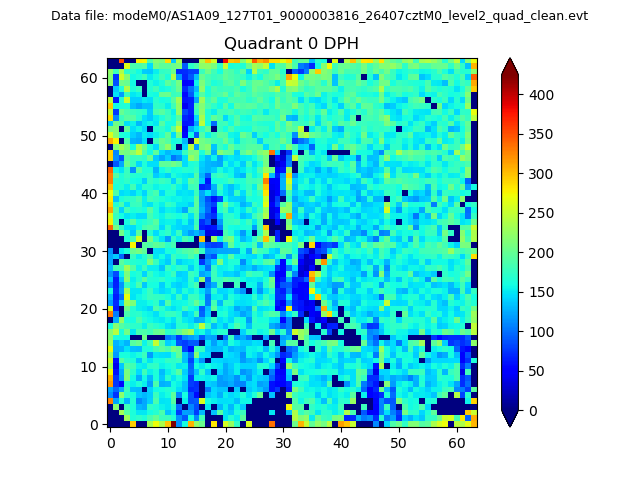 |
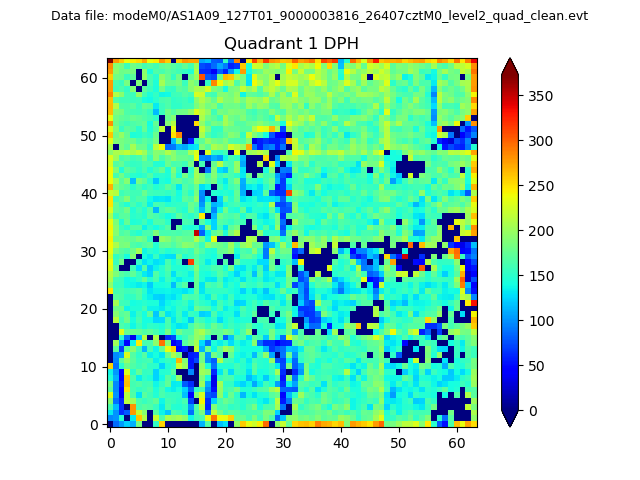 |
Quadrant B |
|---|---|---|---|
| Quadrant D | 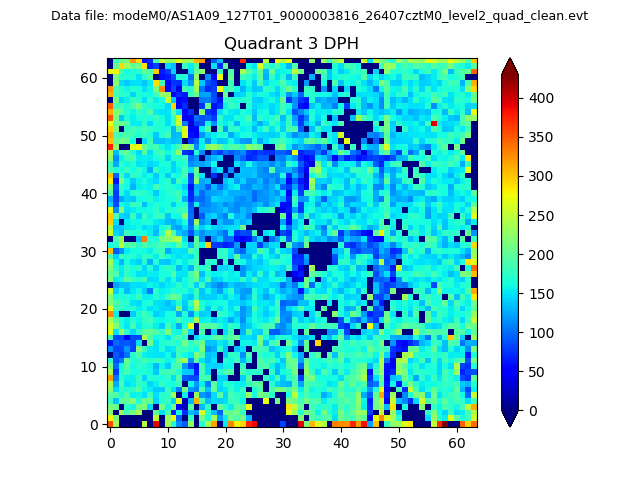 |
 |
Quadrant C |
| Plot type | Count rate plots | Images |
|---|---|---|
| Comparison with Poisson distribution Blue bars denote a histogram of data divided into 1 sec bins. Red curve is a Poisson curve with rate = median count rate of data. |
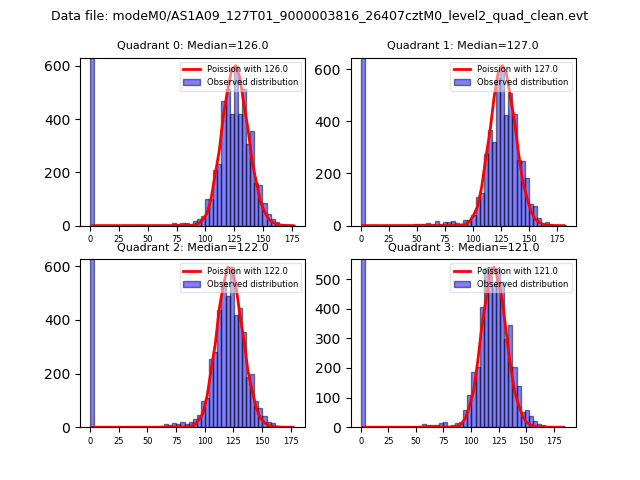 |
 |
| Quadrant-wise count rates Data is divided into 100 sec bins |
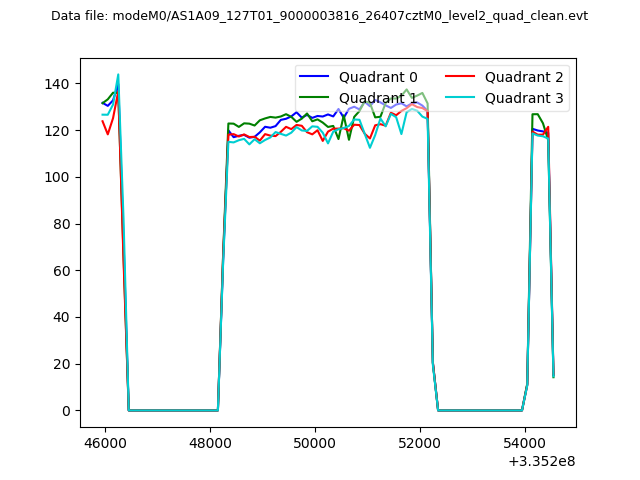 |
|
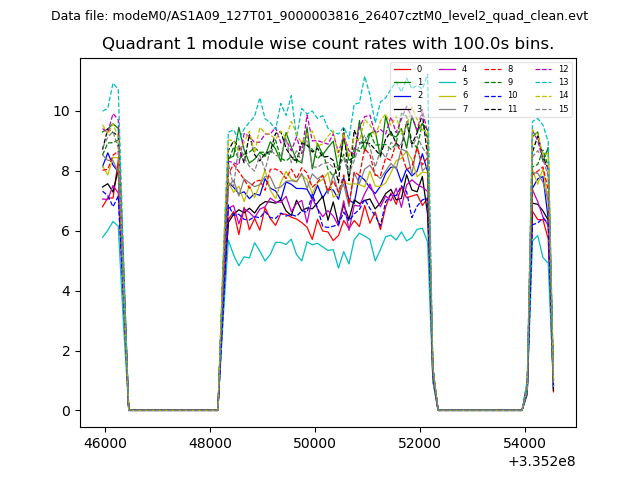
| Module-wise count rates for Quadrant A Data is divided into 100 sec bins |
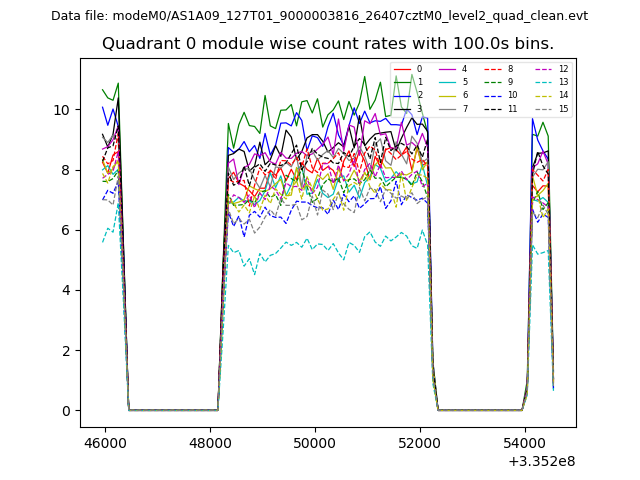 |
 |
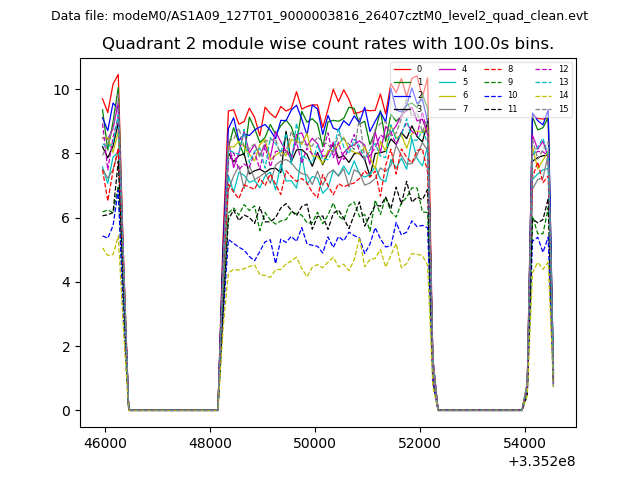
| Module-wise count rates for Quadrant B Data is divided into 100 sec bins |
 |
 |
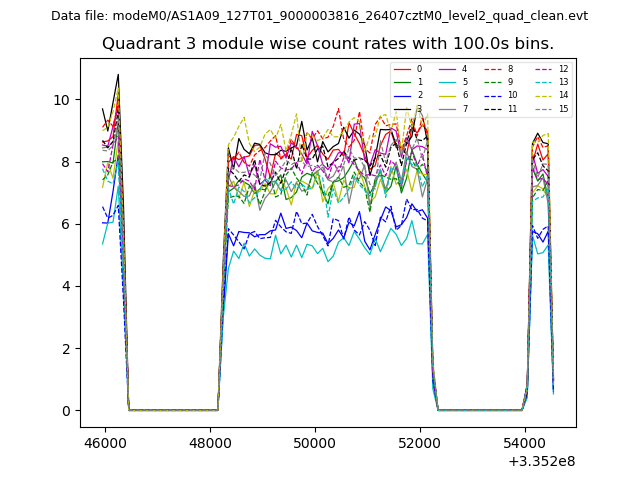
| Module-wise count rates for Quadrant C Data is divided into 100 sec bins |
 |
 |
| Module-wise count rates for Quadrant D Data is divided into 100 sec bins |
 |
 |
| Parameter | Plot |
|---|---|
| CZT HV Monitor | 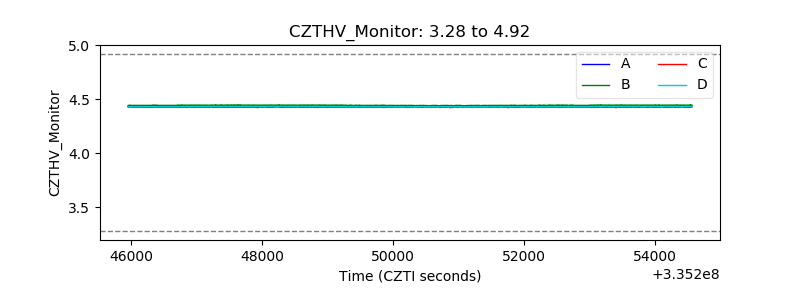 |
| D_VDD | 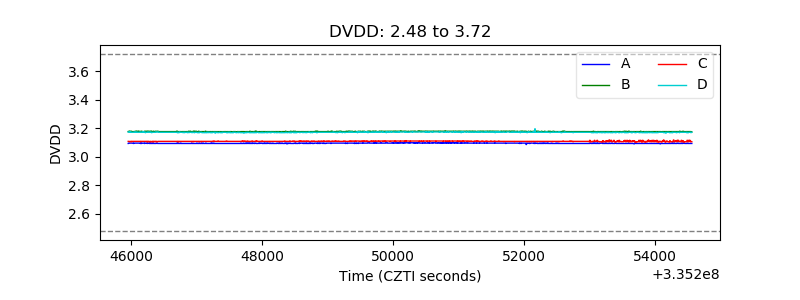 |
| Temperature 1 | 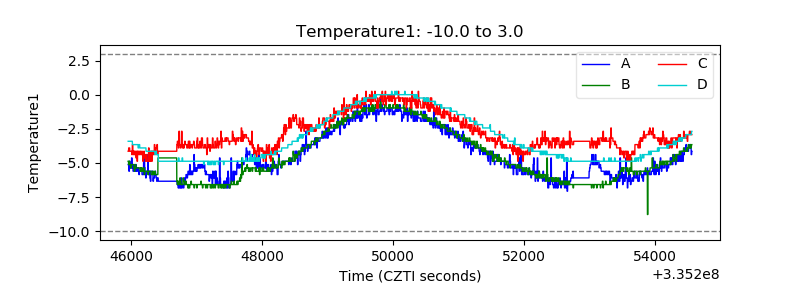 |
| Veto HV Monitor | 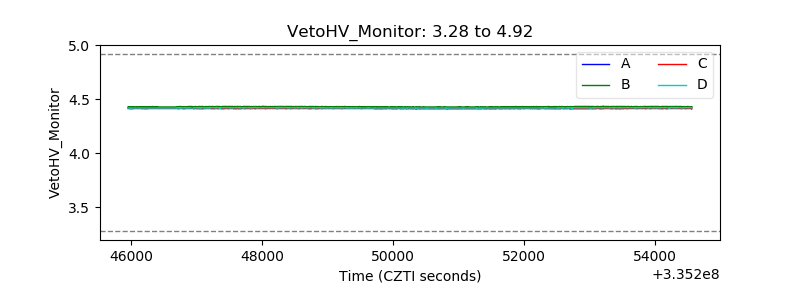 |
| Veto LLD | 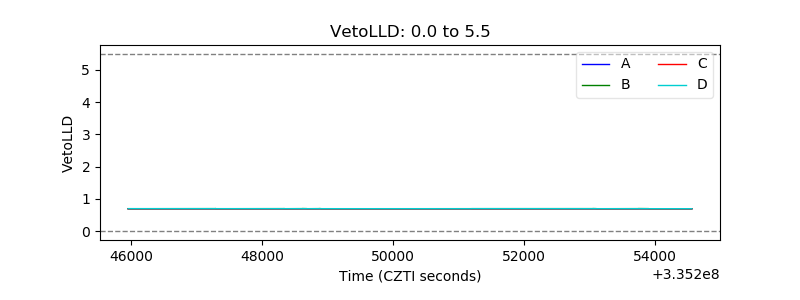 |
| Alpha Counter | 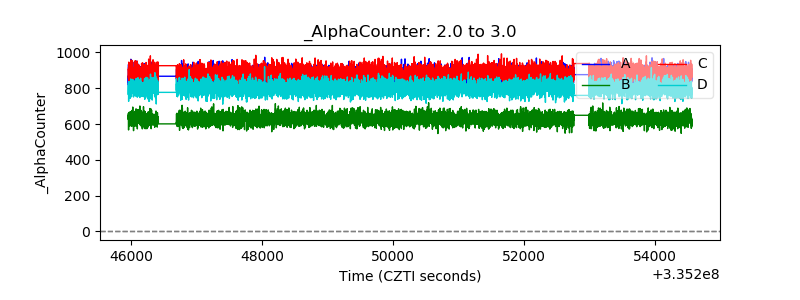 |
| _CPM_Rate | 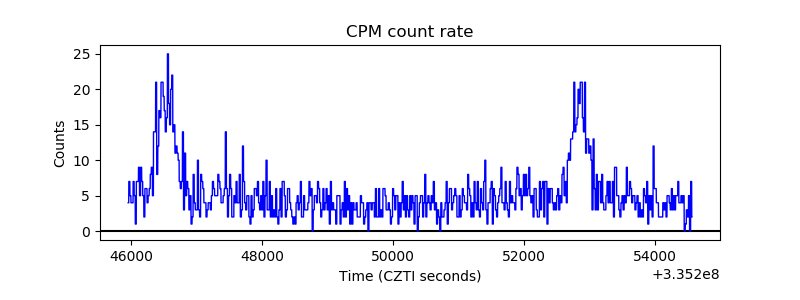 |
| CZT Counter |  |
| +2.5 Volts monitor | 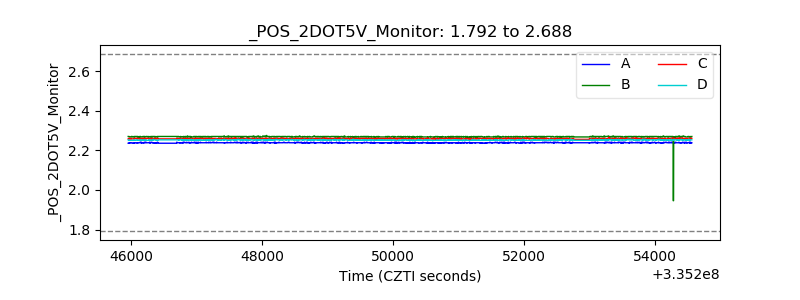 |
| +5 Volts monitor |  |
| _ROLL_ROT | 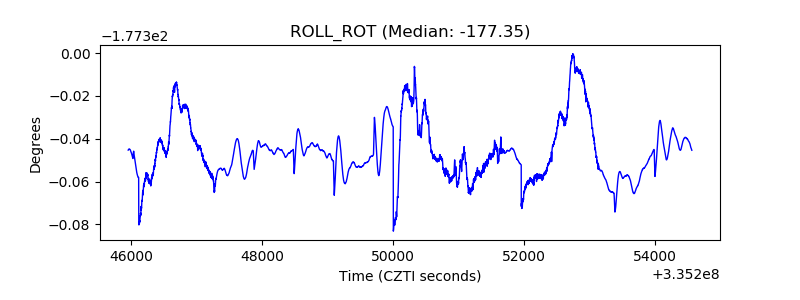 |
| _Roll_DEC | 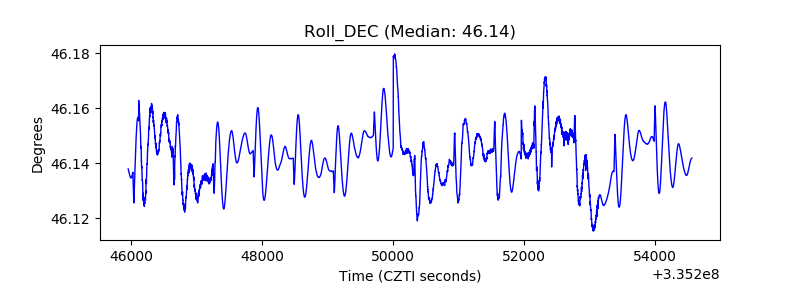 |
| _Roll_RA | 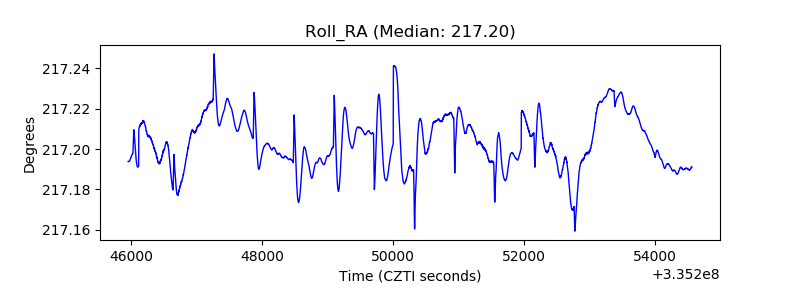 |
| Veto Counter | 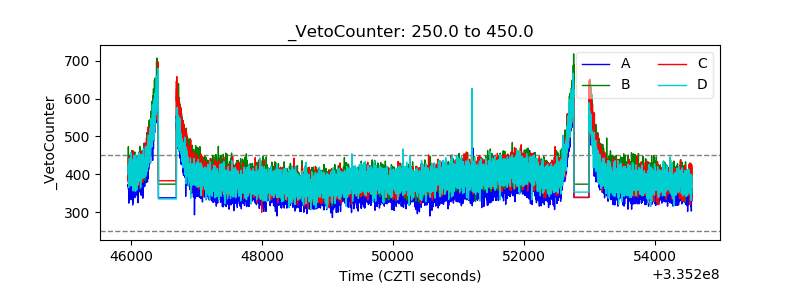 |