| Param | Original file | Final file |
|---|---|---|
| Filename | modeM0/AS1A09_127T01_9000003816_26408cztM0_level2.evt | modeM0/AS1A09_127T01_9000003816_26408cztM0_level2_quad_clean.evt |
| Size (bytes) | 338,541,120 | 61,228,800 |
| Size | 322.9 MB | 58.4 MB |
| Events in quadrant A | 1,919,250 | 397,566 |
| Events in quadrant B | 2,672,010 | 394,334 |
| Events in quadrant C | 2,648,447 | 382,243 |
| Events in quadrant D | 2,721,572 | 378,478 |
| Mode M0 | |||
|---|---|---|---|
| Quadrant | BADHDUFLAG | Total packets | Discarded packets |
| A | 0 | 8617 | 0 |
| B | 0 | 10744 | 0 |
| C | 0 | 10637 | 0 |
| D | 0 | 10991 | 0 |
| Quadrant | Total seconds | Saturated seconds | Saturation percentage |
|---|---|---|---|
| A | 4283 | 5 | 0.116741% |
| B | 4283 | 162 | 3.782396% |
| C | 4284 | 62 | 1.447246% |
| D | 4284 | 134 | 3.127918% |
Noise dominated data is calculated using 1-second bins in cleaned event files. If a bin has >2000 counts, and if more than 50% of those come from <1% of pixels, then it is considered to be noise-dominated and hence unusable.
| Quadrant | # 1 sec bins | Bins with >0 counts | Bins with >2000 counts | High rate bins dominated by noise | Noise dominated (total time) | Noise dominated (detector-on time) | Marked lightcurve |
|---|---|---|---|---|---|---|---|
| A | 4283 | 4283 | 0 | 0 | 0.00% | 0.00% | 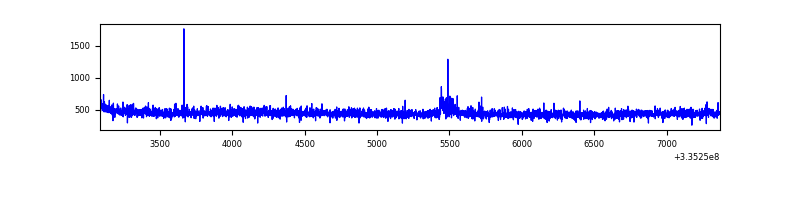 |
| B | 4283 | 4283 | 106 | 106 | 2.47% | 2.47% | 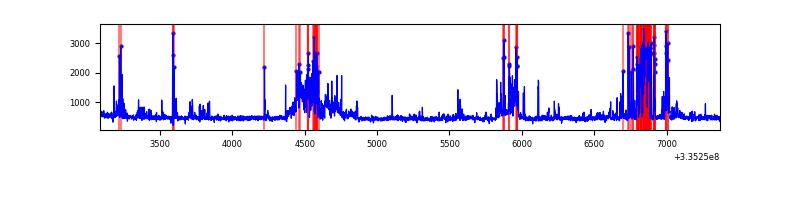 |
| C | 4284 | 4284 | 18 | 18 | 0.42% | 0.42% | 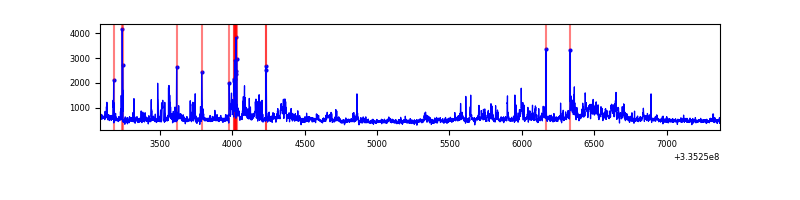 |
| D | 4284 | 4284 | 97 | 97 | 2.26% | 2.26% | 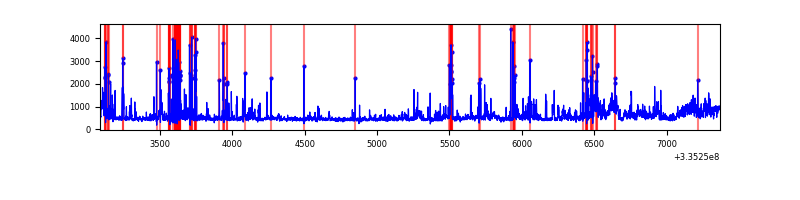 |
Top three noisy pixels from each quadrant. If the there are fewer than three noisy pixels in the level2.evt file, extra rows are filled as -1
| Pixel properties | Quadrant properties | ||||||
|---|---|---|---|---|---|---|---|
| Quadrant | DetID | PixID | Counts | Sigma | Mean | Median | Sigma |
| A | 0 | 13 | 15545 | 149.4 | 493 | 481 | 100.8 |
| A | 13 | 254 | 7458 | 69.2 | 493 | 481 | 100.8 |
| A | 3 | 137 | 4569 | 40.54 | 493 | 481 | 100.8 |
| B | 5 | 172 | 391250 | 4183.94 | 482 | 469 | 93.4 |
| B | 0 | 189 | 326764 | 3493.51 | 482 | 469 | 93.4 |
| B | 0 | 244 | 23789 | 249.67 | 482 | 469 | 93.4 |
| C | 3 | 233 | 600565 | 5442.48 | 468 | 471 | 110.3 |
| C | 2 | 16 | 96211 | 868.3 | 468 | 471 | 110.3 |
| C | 14 | 238 | 76006 | 685.06 | 468 | 471 | 110.3 |
| D | 1 | 52 | 786797 | 6924.19 | 472 | 458 | 113.6 |
| D | 12 | 233 | 65316 | 571.11 | 472 | 458 | 113.6 |
| D | 15 | 145 | 31645 | 274.62 | 472 | 458 | 113.6 |
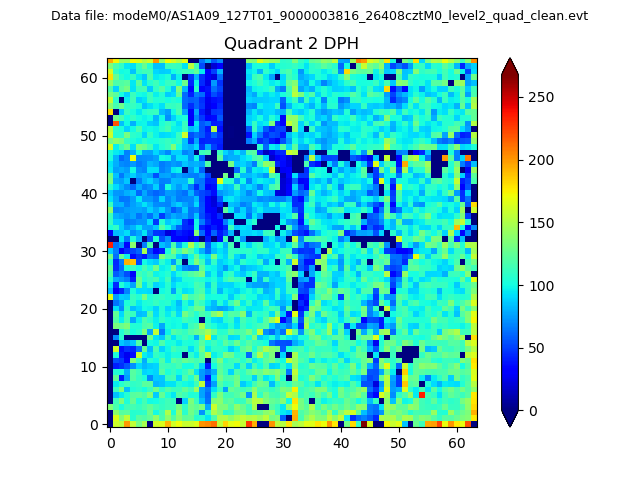
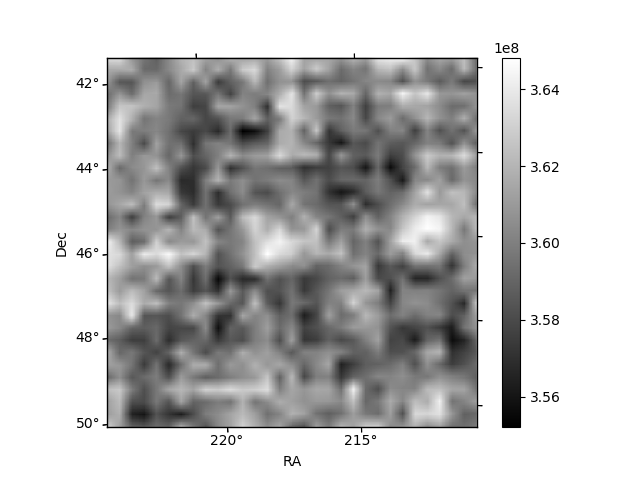
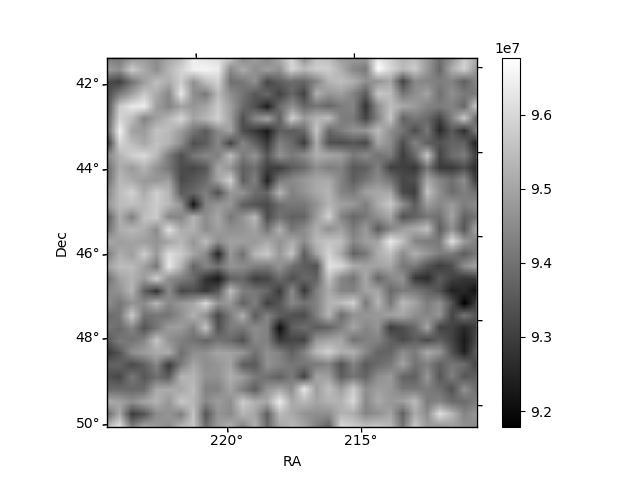
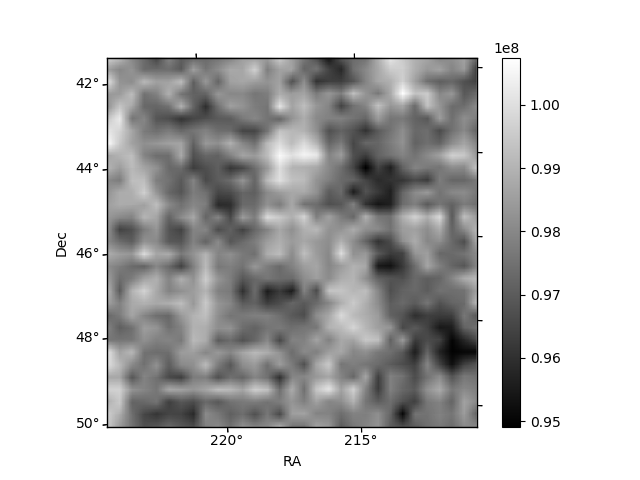
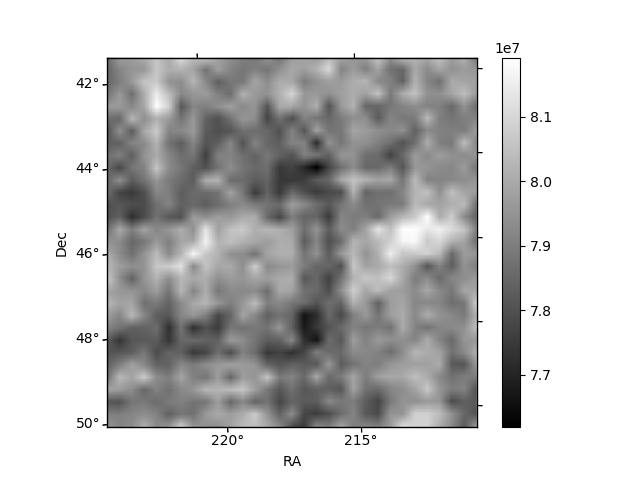
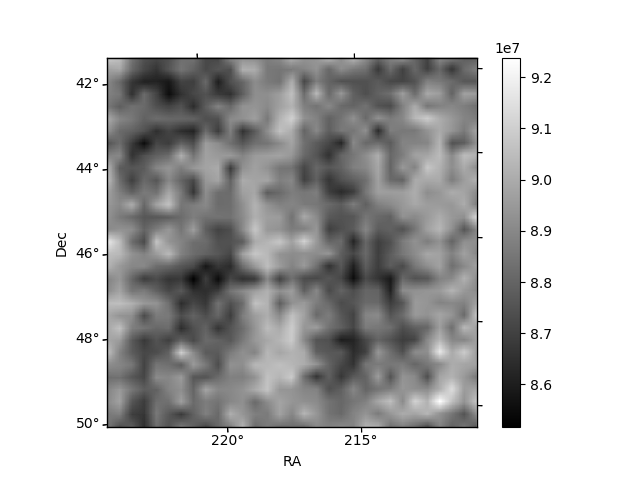
Histogram calculated using DETX and DETY for each event in the final _common_clean file
| Quadrant A | 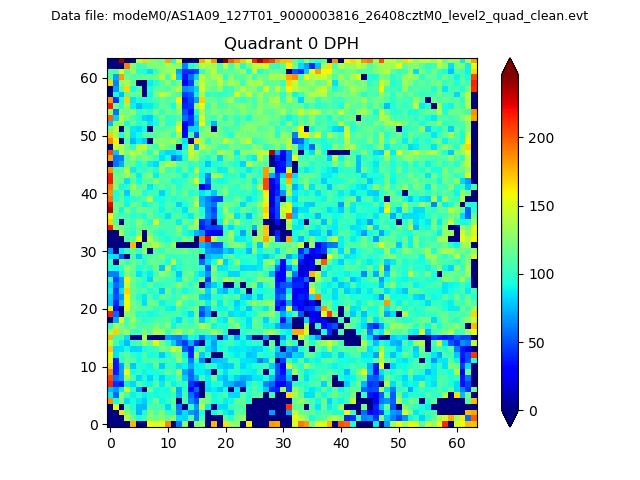 |
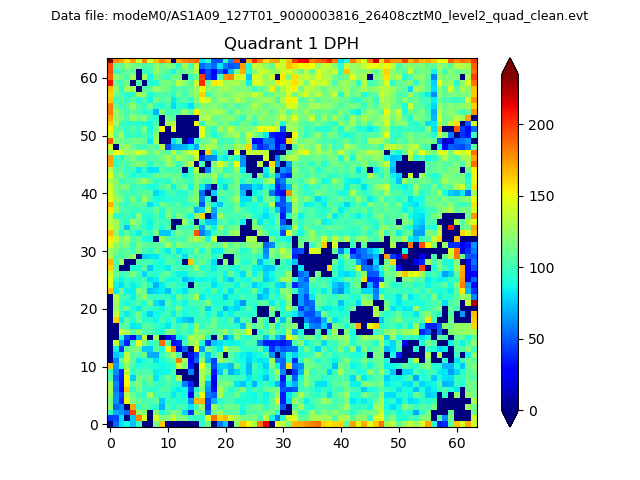 |
Quadrant B |
|---|---|---|---|
| Quadrant D | 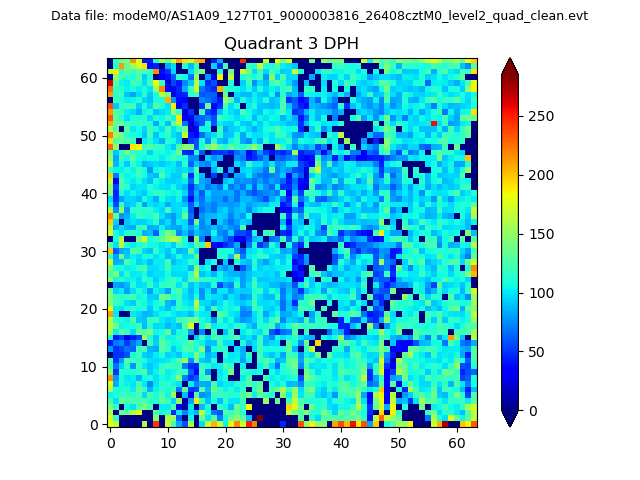 |
 |
Quadrant C |
| Plot type | Count rate plots | Images |
|---|---|---|
| Comparison with Poisson distribution Blue bars denote a histogram of data divided into 1 sec bins. Red curve is a Poisson curve with rate = median count rate of data. |
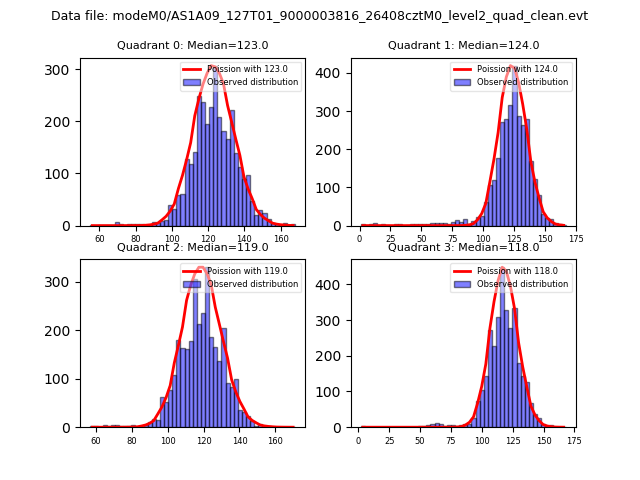 |
 |
| Quadrant-wise count rates Data is divided into 100 sec bins |
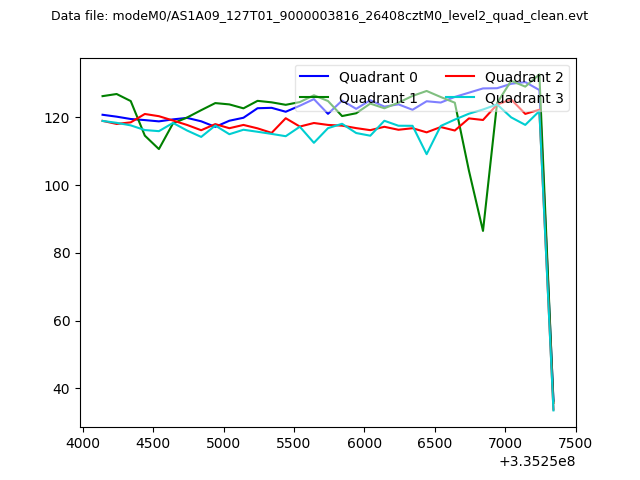 |
|
| Module-wise count rates for Quadrant A Data is divided into 100 sec bins |
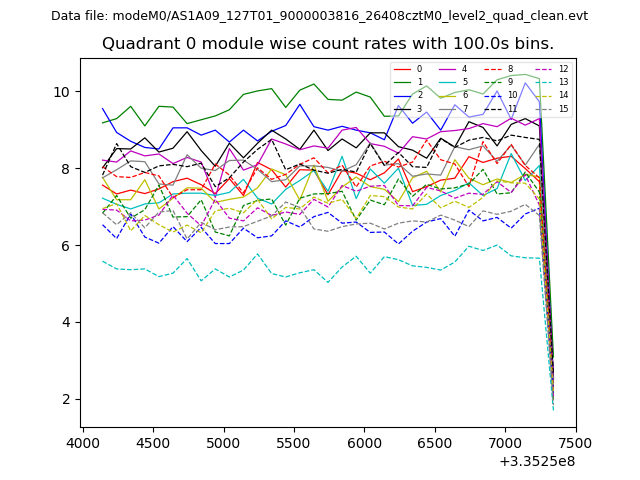 |
 |
| Module-wise count rates for Quadrant B Data is divided into 100 sec bins |
 |
 |
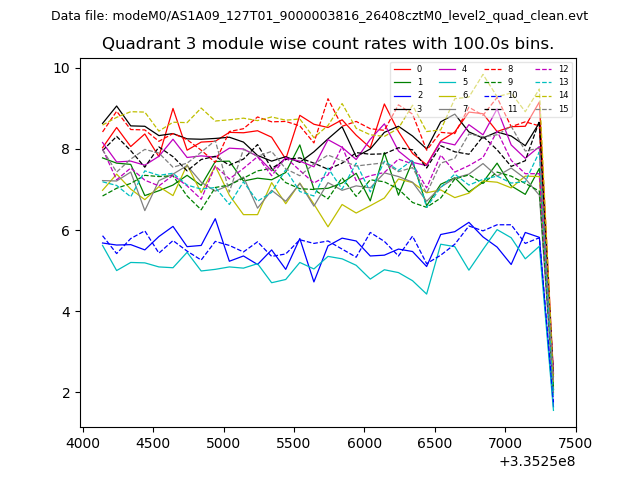
| Module-wise count rates for Quadrant C Data is divided into 100 sec bins |
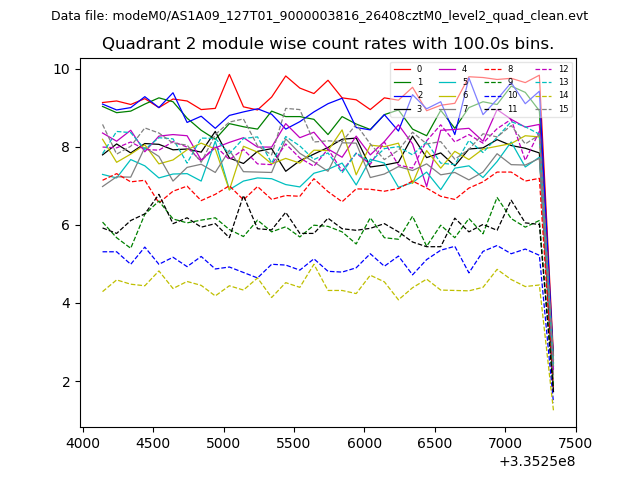 |
 |
| Module-wise count rates for Quadrant D Data is divided into 100 sec bins |
 |
 |
| Parameter | Plot |
|---|---|
| CZT HV Monitor | 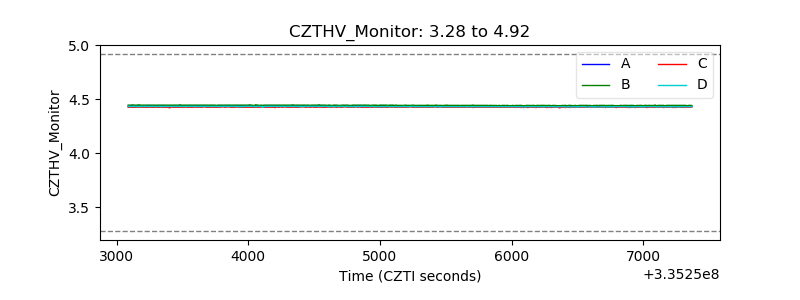 |
| D_VDD | 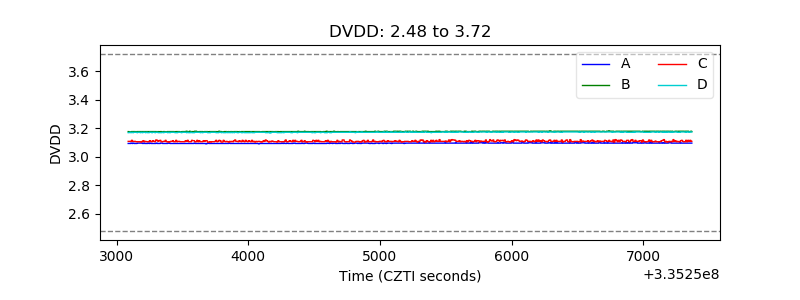 |
| Temperature 1 | 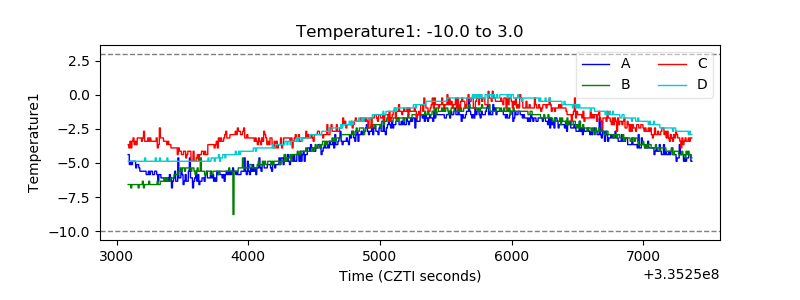 |
| Veto HV Monitor | 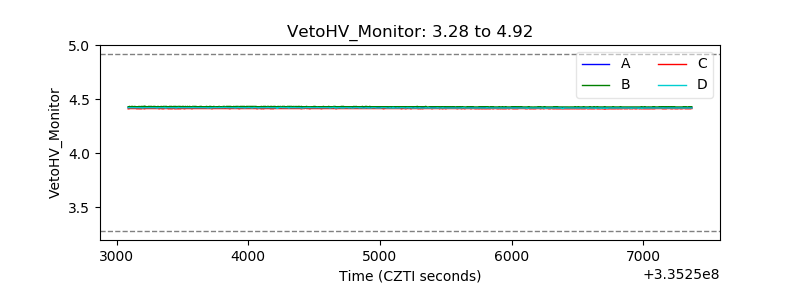 |
| Veto LLD | 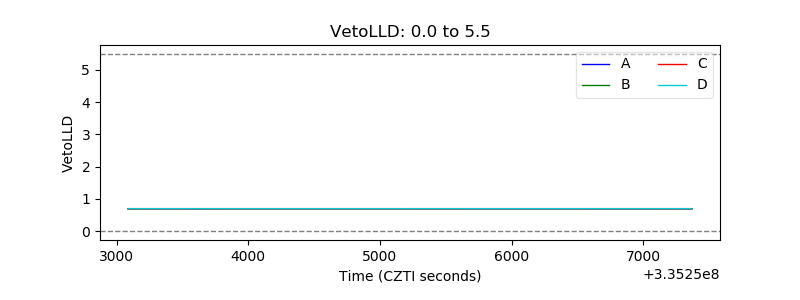 |
| Alpha Counter | 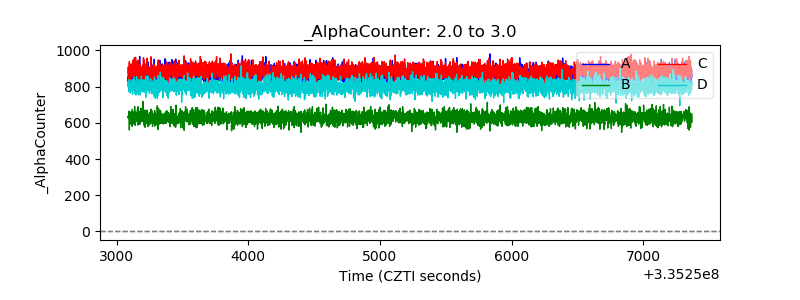 |
| _CPM_Rate | 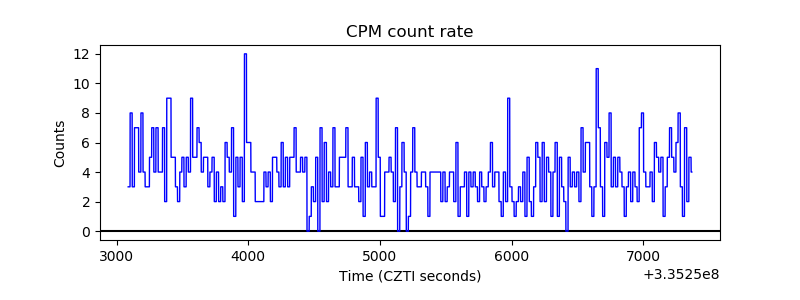 |
| CZT Counter | 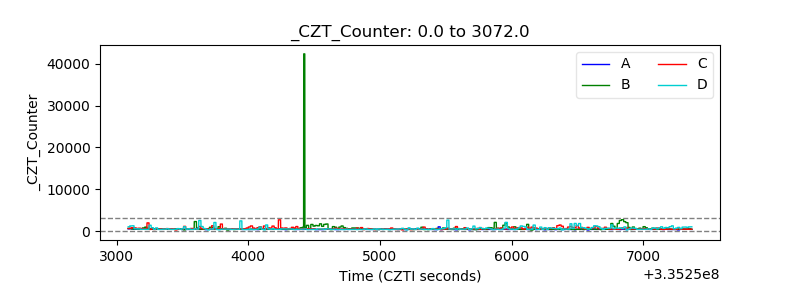 |
| +2.5 Volts monitor |  |
| +5 Volts monitor | 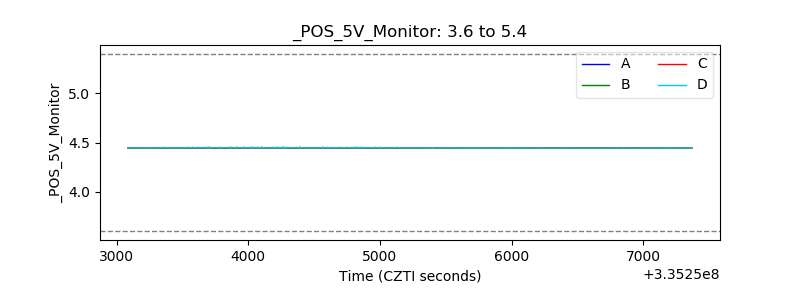 |
| _ROLL_ROT | 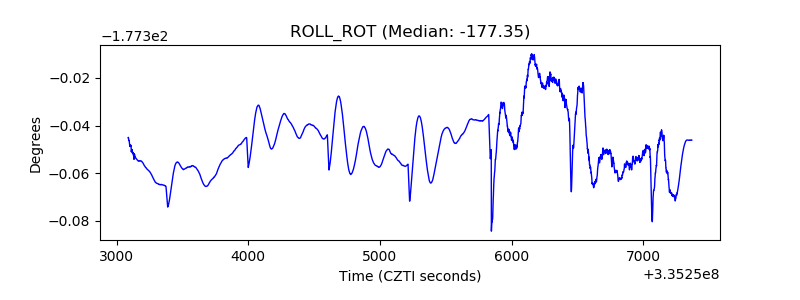 |
| _Roll_DEC | 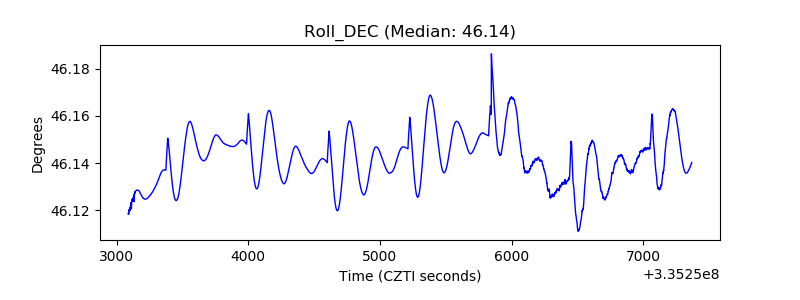 |
| _Roll_RA | 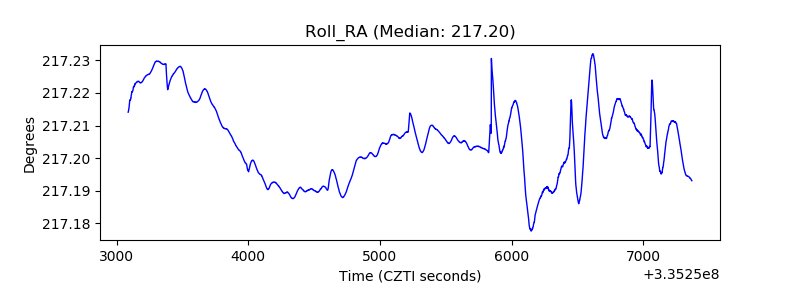 |
| Veto Counter | 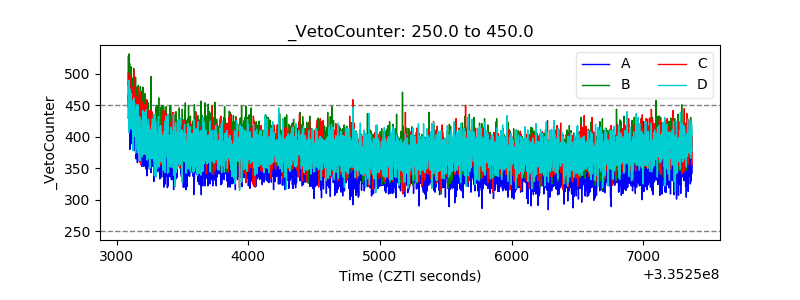 |