| Param | Original file | Final file |
|---|---|---|
| Filename | modeM0/AS1A09_127T02_9000003818cztM0_level2.fits | modeM0/AS1A09_127T02_9000003818cztM0_level2_quad_clean.evt |
| Size (bytes) | 386,210,880 | 269,133,120 |
| Size | 368.3 MB | 256.7 MB |
| Events in quadrant A | 2,404,416 | 1,479,797 |
| Events in quadrant B | 2,282,368 | 1,413,848 |
| Events in quadrant C | 2,322,922 | 1,336,420 |
| Events in quadrant D | 1,999,314 | 1,232,300 |
| Mode M9 | |||
|---|---|---|---|
| Quadrant | BADHDUFLAG | Total packets | Discarded packets |
| A | 0 | 76 | 0 |
| B | 0 | 76 | 0 |
| C | 0 | 76 | 0 |
| D | 0 | 76 | 0 |
| Mode M0 | |||
|---|---|---|---|
| Quadrant | BADHDUFLAG | Total packets | Discarded packets |
| A | 0 | 81631 | 0 |
| B | 0 | 90069 | 0 |
| C | 0 | 97309 | 0 |
| D | 0 | 114858 | 0 |
| Mode SS | |||
|---|---|---|---|
| Quadrant | BADHDUFLAG | Total packets | Discarded packets |
| A | 0 | 798 | 0 |
| B | 0 | 798 | 0 |
| C | 0 | 798 | 0 |
| D | 0 | 798 | 0 |
| Quadrant | Total seconds | Saturated seconds | Saturation percentage |
|---|---|---|---|
| A | 39116 | 398 | 1.017486% |
| B | 39116 | 1172 | 2.996216% |
| C | 39116 | 1755 | 4.486655% |
| D | 39116 | 2553 | 6.526741% |
Noise dominated data is calculated using 1-second bins in cleaned event files. If a bin has >2000 counts, and if more than 50% of those come from <1% of pixels, then it is considered to be noise-dominated and hence unusable.
| Quadrant | # 1 sec bins | Bins with >0 counts | Bins with >2000 counts | High rate bins dominated by noise | Noise dominated (total time) | Noise dominated (detector-on time) | Marked lightcurve |
|---|---|---|---|---|---|---|---|
| A | 46761 | 39115 | 0 | 0 | 0.00% | 0.00% |  |
| B | 46761 | 39035 | 0 | 0 | 0.00% | 0.00% |  |
| C | 46761 | 39082 | 0 | 0 | 0.00% | 0.00% |  |
| D | 46761 | 39089 | 0 | 0 | 0.00% | 0.00% |  |
Top three noisy pixels from each quadrant. If the there are fewer than three noisy pixels in the level2.evt file, extra rows are filled as -1
| Pixel properties | Quadrant properties | ||||||
|---|---|---|---|---|---|---|---|
| Quadrant | DetID | PixID | Counts | Sigma | Mean | Median | Sigma |
| A | 7 | 110 | 2076 | 9.7 | 627 | 592 | 153.0 |
| A | 0 | 29 | 2057 | 9.58 | 627 | 592 | 153.0 |
| A | 9 | 19 | 1828 | 8.08 | 627 | 592 | 153.0 |
| B | 2 | 9 | 1808 | 10.44 | 605 | 582 | 117.4 |
| B | 14 | 254 | 1499 | 7.81 | 605 | 582 | 117.4 |
| B | 5 | 128 | 1489 | 7.73 | 605 | 582 | 117.4 |
| C | 1 | 81 | 1877 | 8.35 | 612 | 576 | 155.8 |
| C | 1 | 80 | 1822 | 7.99 | 612 | 576 | 155.8 |
| C | 12 | 241 | 1650 | 6.89 | 612 | 576 | 155.8 |
| D | 15 | 46 | 1425 | 5.92 | 571 | 519 | 153.1 |
| D | 10 | 189 | 1424 | 5.91 | 571 | 519 | 153.1 |
| D | 7 | 3 | 1421 | 5.89 | 571 | 519 | 153.1 |
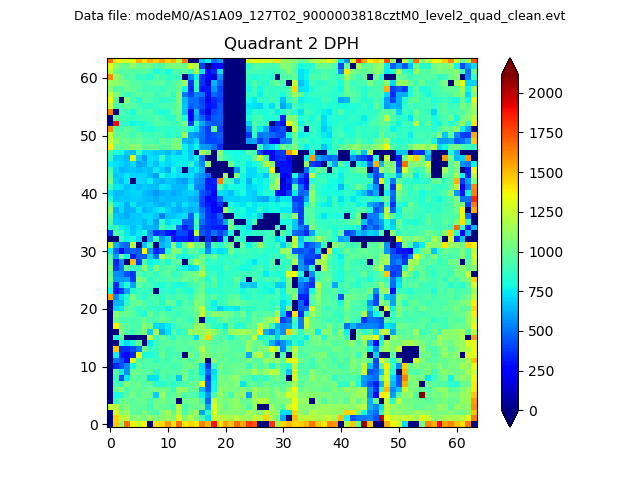
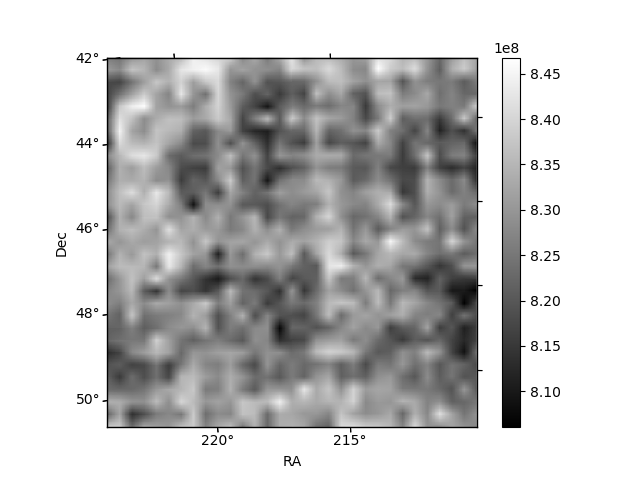
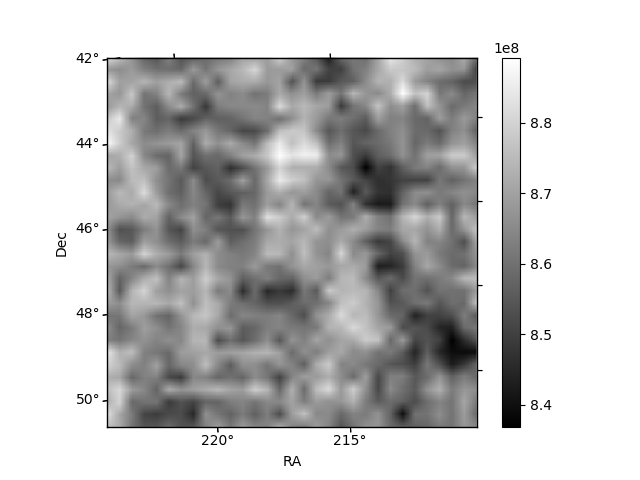
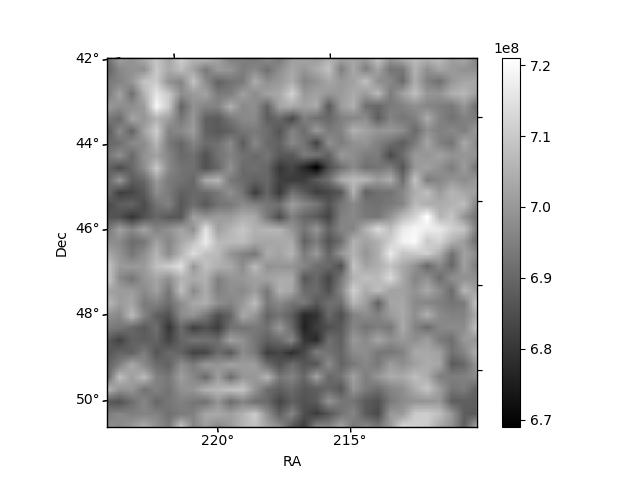
Histogram calculated using DETX and DETY for each event in the final _common_clean file
| Quadrant A | 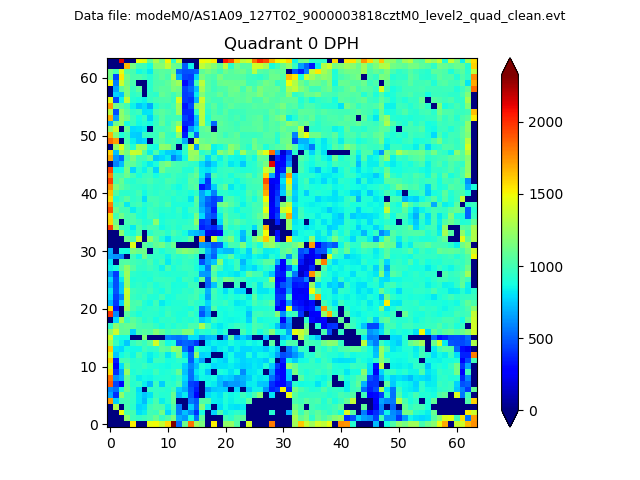 |
 |
Quadrant B |
|---|---|---|---|
| Quadrant D |  |
 |
Quadrant C |
| Plot type | Count rate plots | Images |
|---|---|---|
| Comparison with Poisson distribution Blue bars denote a histogram of data divided into 1 sec bins. Red curve is a Poisson curve with rate = median count rate of data. |
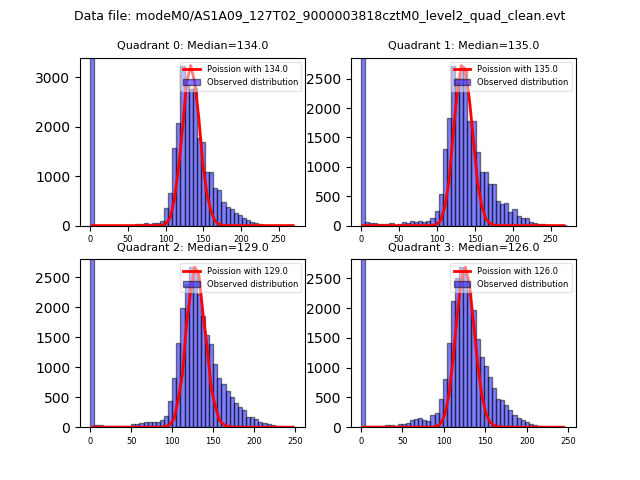 |
 |
| Quadrant-wise count rates Data is divided into 100 sec bins |
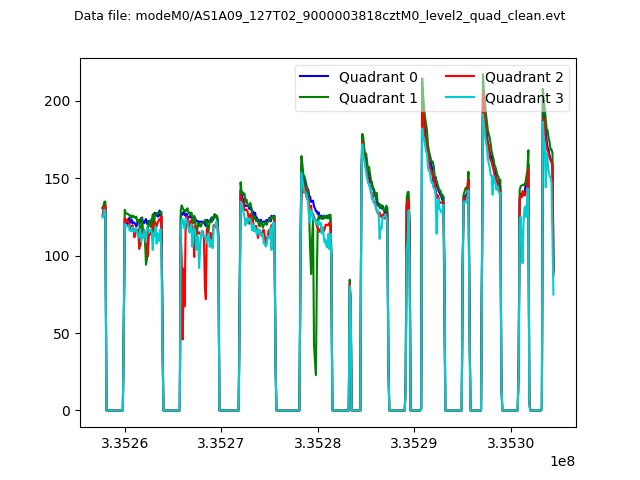 |
|
| Module-wise count rates for Quadrant A Data is divided into 100 sec bins |
 |
 |
| Module-wise count rates for Quadrant B Data is divided into 100 sec bins |
 |
 |
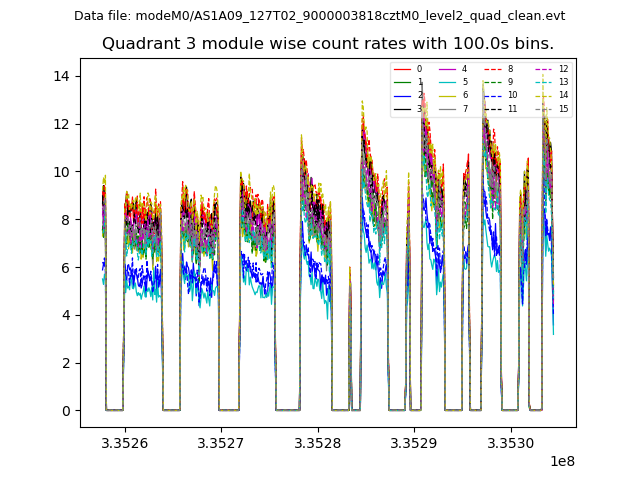
| Module-wise count rates for Quadrant C Data is divided into 100 sec bins |
 |
 |
| Module-wise count rates for Quadrant D Data is divided into 100 sec bins |
 |
 |
| Parameter | Plot |
|---|---|
| CZT HV Monitor |  |
| D_VDD | 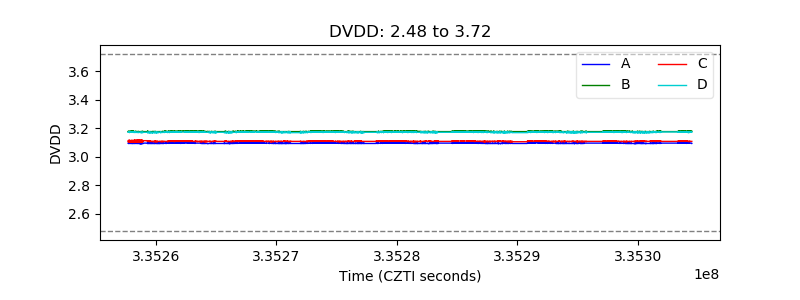 |
| Temperature 1 |  |
| Veto HV Monitor |  |
| Veto LLD | 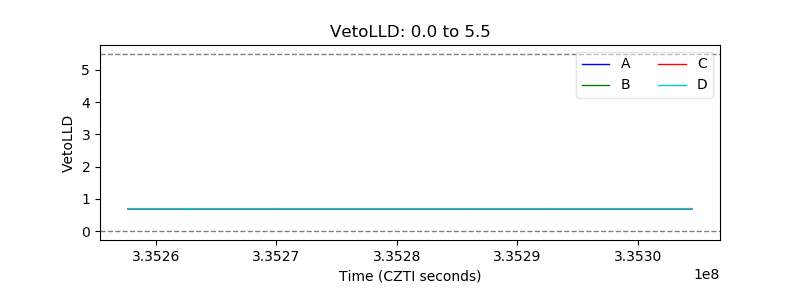 |
| Alpha Counter |  |
| _CPM_Rate | 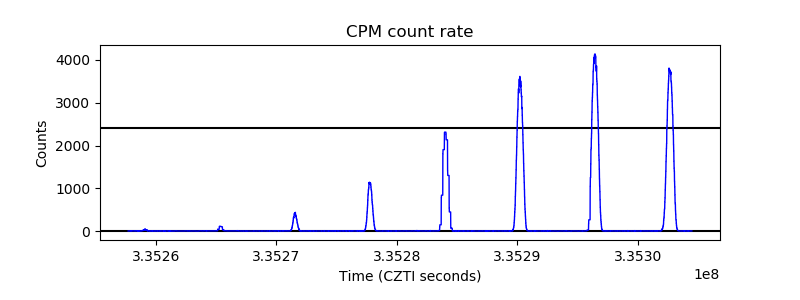 |
| CZT Counter | 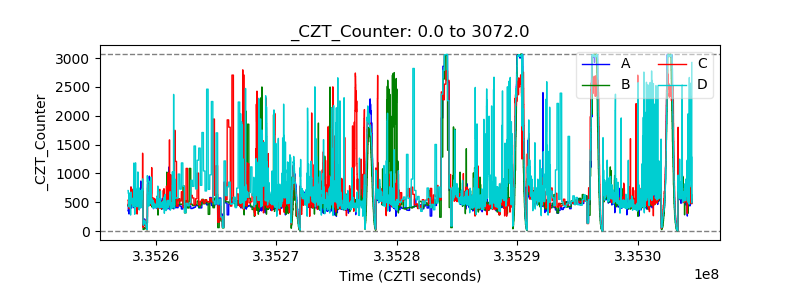 |
| +2.5 Volts monitor |  |
| +5 Volts monitor |  |
| _ROLL_ROT | 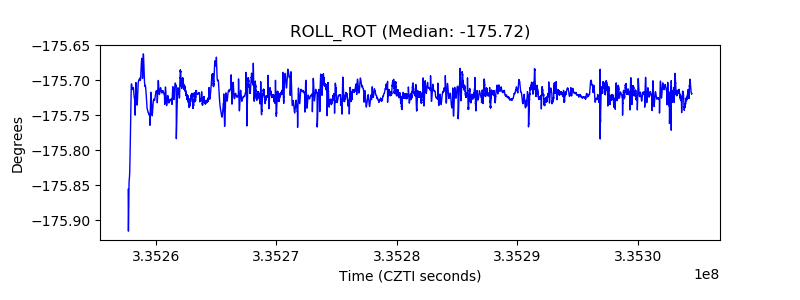 |
| _Roll_DEC |  |
| _Roll_RA |  |
| Veto Counter |  |