| Param | Original file | Final file |
|---|---|---|
| Filename | modeM0/AS1A09_127T02_9000003818_26410cztM0_level2.evt | modeM0/AS1A09_127T02_9000003818_26410cztM0_level2_quad_clean.evt |
| Size (bytes) | 704,390,400 | 126,253,440 |
| Size | 671.8 MB | 120.4 MB |
| Events in quadrant A | 3,738,751 | 848,824 |
| Events in quadrant B | 4,618,805 | 843,612 |
| Events in quadrant C | 5,995,555 | 776,608 |
| Events in quadrant D | 6,427,738 | 788,062 |
| Mode M9 | |||
|---|---|---|---|
| Quadrant | BADHDUFLAG | Total packets | Discarded packets |
| A | 0 | 6 | 0 |
| B | 0 | 6 | 0 |
| C | 0 | 6 | 0 |
| D | 0 | 6 | 0 |
| Mode M0 | |||
|---|---|---|---|
| Quadrant | BADHDUFLAG | Total packets | Discarded packets |
| A | 0 | 16593 | 0 |
| B | 0 | 18918 | 0 |
| C | 0 | 22947 | 0 |
| D | 0 | 24619 | 0 |
| Quadrant | Total seconds | Saturated seconds | Saturation percentage |
|---|---|---|---|
| A | 8152 | 63 | 0.772816% |
| B | 8152 | 276 | 3.385672% |
| C | 8152 | 713 | 8.746320% |
| D | 8152 | 694 | 8.513248% |
Noise dominated data is calculated using 1-second bins in cleaned event files. If a bin has >2000 counts, and if more than 50% of those come from <1% of pixels, then it is considered to be noise-dominated and hence unusable.
| Quadrant | # 1 sec bins | Bins with >0 counts | Bins with >2000 counts | High rate bins dominated by noise | Noise dominated (total time) | Noise dominated (detector-on time) | Marked lightcurve |
|---|---|---|---|---|---|---|---|
| A | 8727 | 8153 | 1 | 1 | 0.01% | 0.01% | 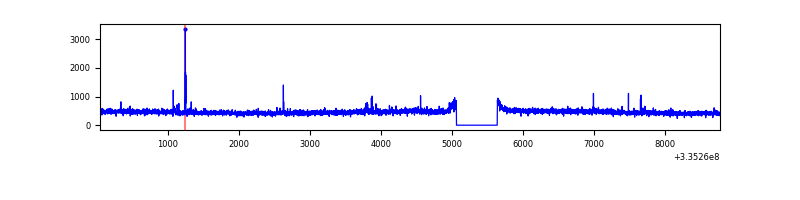 |
| B | 8727 | 8153 | 171 | 171 | 1.96% | 2.10% | 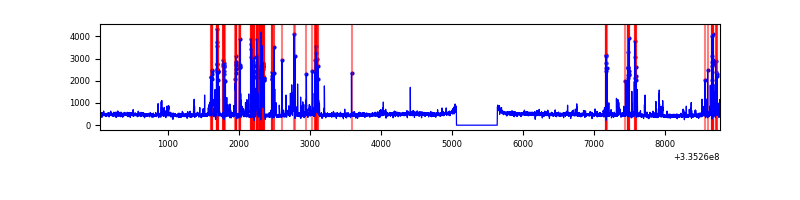 |
| C | 8727 | 8153 | 439 | 439 | 5.03% | 5.38% | 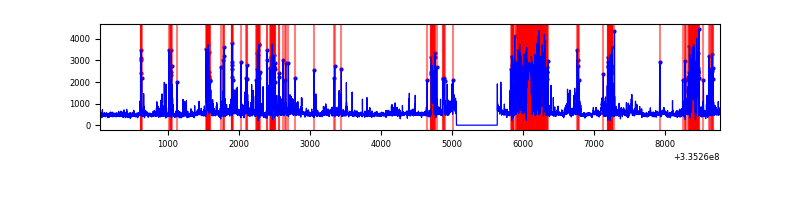 |
| D | 8727 | 8153 | 414 | 414 | 4.74% | 5.08% | 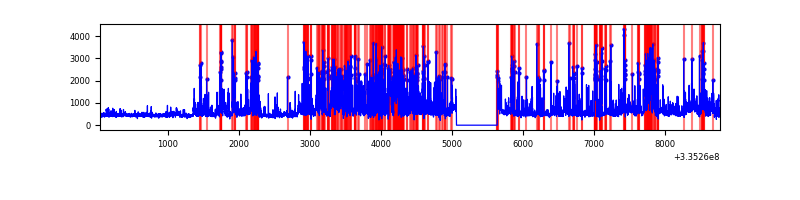 |
Top three noisy pixels from each quadrant. If the there are fewer than three noisy pixels in the level2.evt file, extra rows are filled as -1
| Pixel properties | Quadrant properties | ||||||
|---|---|---|---|---|---|---|---|
| Quadrant | DetID | PixID | Counts | Sigma | Mean | Median | Sigma |
| A | 0 | 13 | 46398 | 235.16 | 956 | 935 | 193.3 |
| A | 13 | 254 | 13732 | 66.19 | 956 | 935 | 193.3 |
| A | 3 | 137 | 8708 | 40.21 | 956 | 935 | 193.3 |
| B | 5 | 172 | 738131 | 4127.81 | 937 | 912 | 178.6 |
| B | 12 | 16 | 66362 | 366.47 | 937 | 912 | 178.6 |
| B | 0 | 244 | 58081 | 320.1 | 937 | 912 | 178.6 |
| C | 2 | 16 | 1748946 | 8454.77 | 880 | 884 | 206.8 |
| C | 3 | 233 | 631076 | 3048.02 | 880 | 884 | 206.8 |
| C | 14 | 238 | 139313 | 669.53 | 880 | 884 | 206.8 |
| D | 1 | 52 | 2644601 | 12310.59 | 901 | 877 | 214.8 |
| D | 7 | 80 | 140011 | 647.88 | 901 | 877 | 214.8 |
| D | 12 | 233 | 124680 | 576.49 | 901 | 877 | 214.8 |
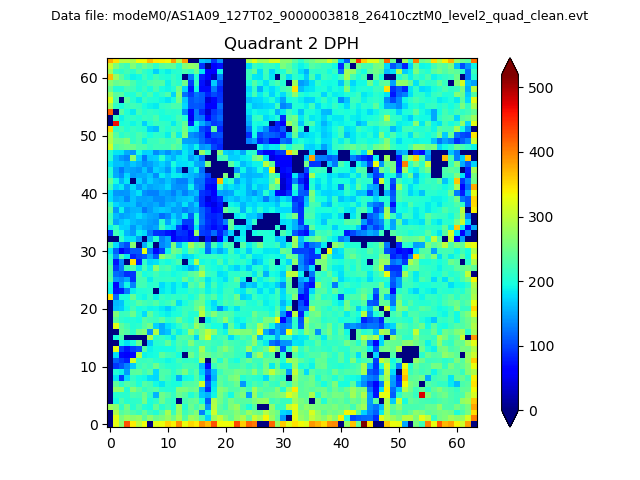
Histogram calculated using DETX and DETY for each event in the final _common_clean file
| Quadrant A | 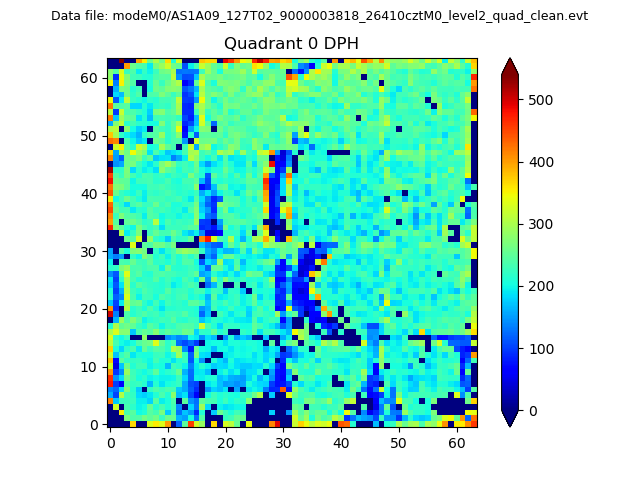 |
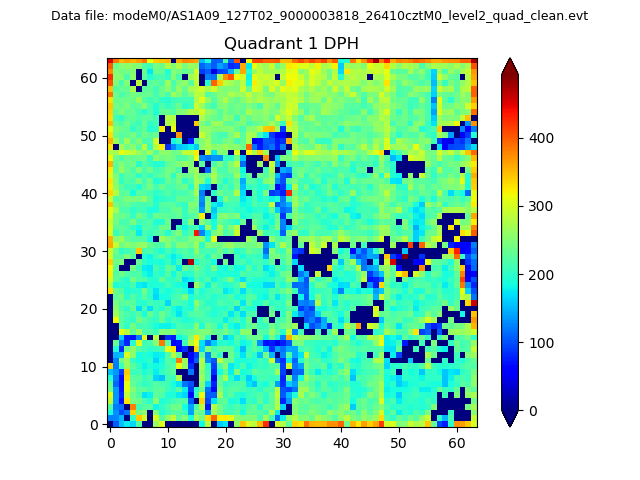 |
Quadrant B |
|---|---|---|---|
| Quadrant D | 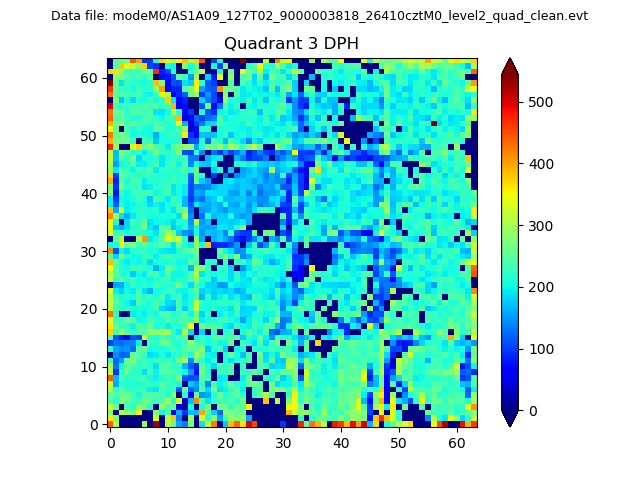 |
 |
Quadrant C |
| Plot type | Count rate plots | Images |
|---|---|---|
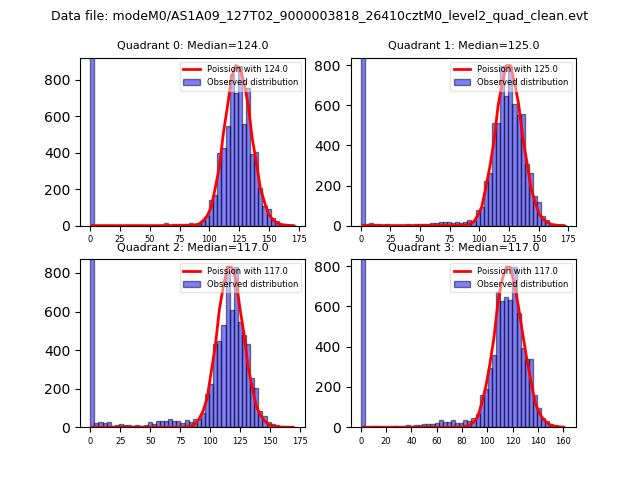
| Comparison with Poisson distribution Blue bars denote a histogram of data divided into 1 sec bins. Red curve is a Poisson curve with rate = median count rate of data. |
 |
 |
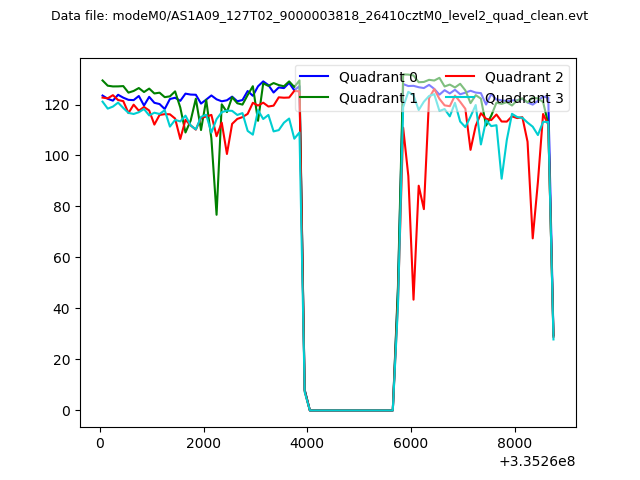
| Quadrant-wise count rates Data is divided into 100 sec bins |
 |
|
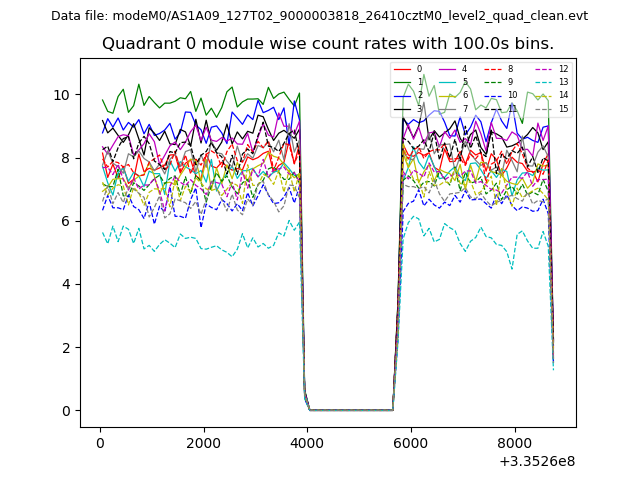
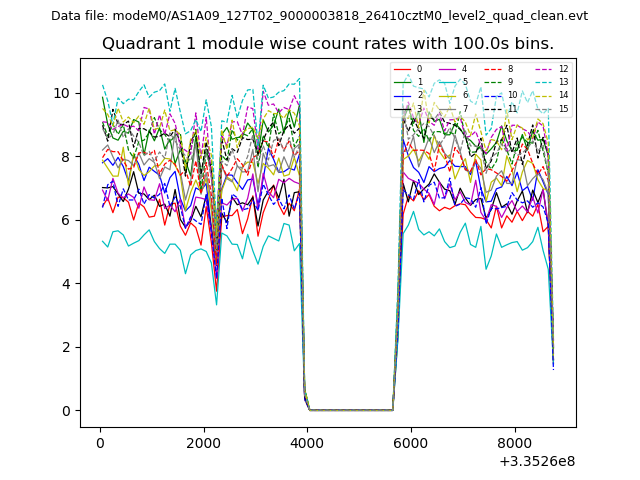
| Module-wise count rates for Quadrant A Data is divided into 100 sec bins |
 |
 |
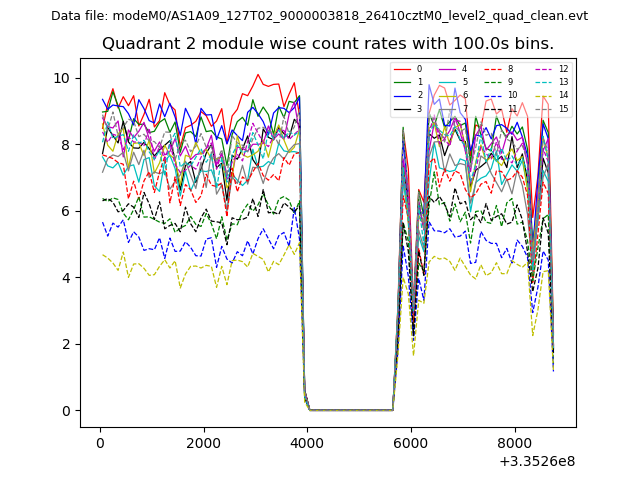
| Module-wise count rates for Quadrant B Data is divided into 100 sec bins |
 |
 |
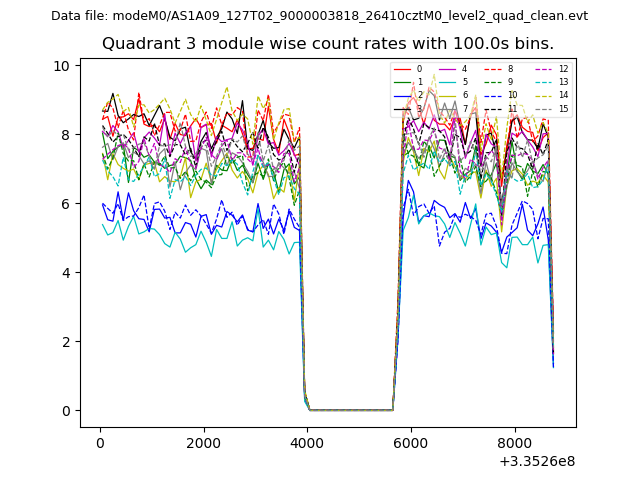
| Module-wise count rates for Quadrant C Data is divided into 100 sec bins |
 |
 |
| Module-wise count rates for Quadrant D Data is divided into 100 sec bins |
 |
 |
| Parameter | Plot |
|---|---|
| CZT HV Monitor | 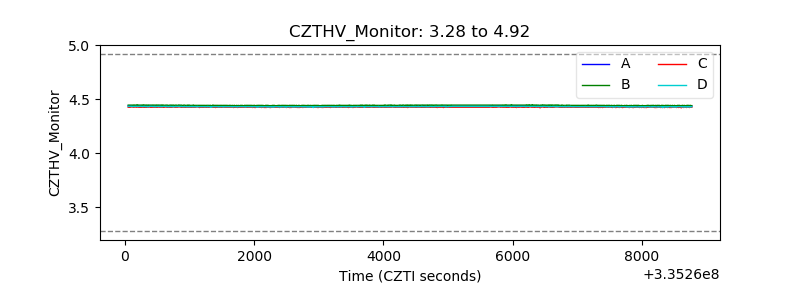 |
| D_VDD | 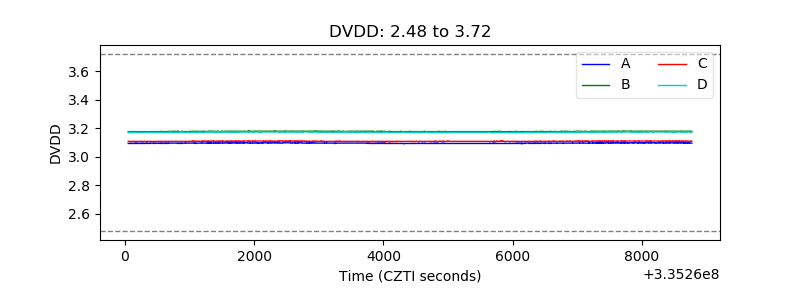 |
| Temperature 1 | 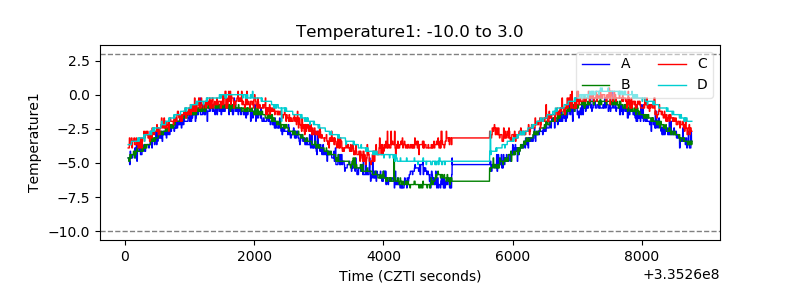 |
| Veto HV Monitor | 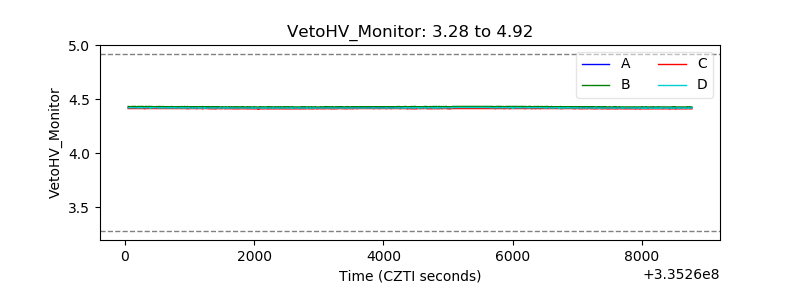 |
| Veto LLD | 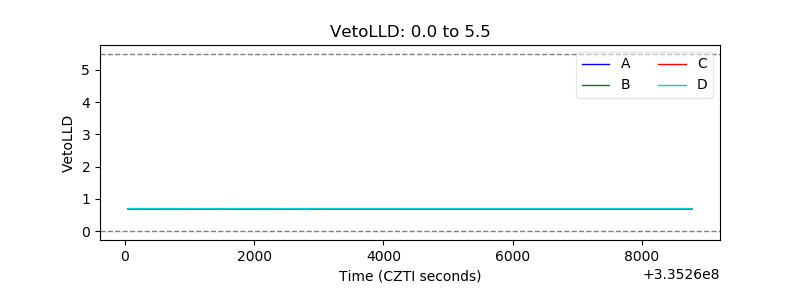 |
| Alpha Counter | 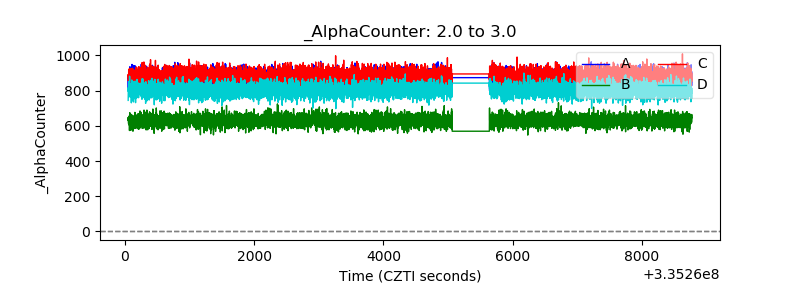 |
| _CPM_Rate | 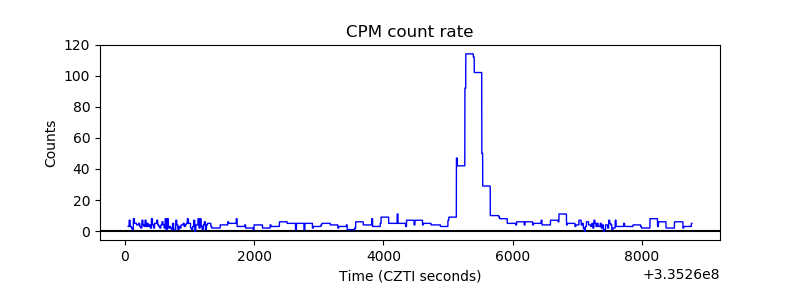 |
| CZT Counter | 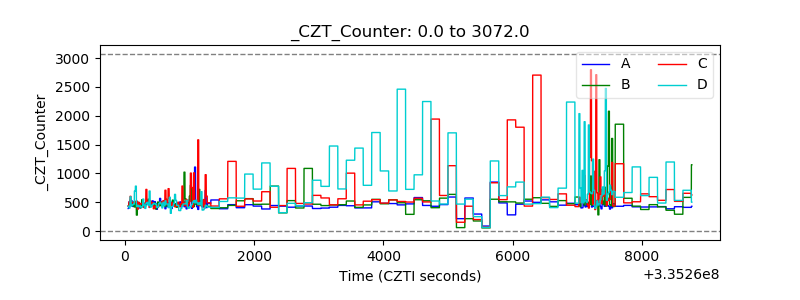 |
| +2.5 Volts monitor |  |
| +5 Volts monitor |  |
| _ROLL_ROT | 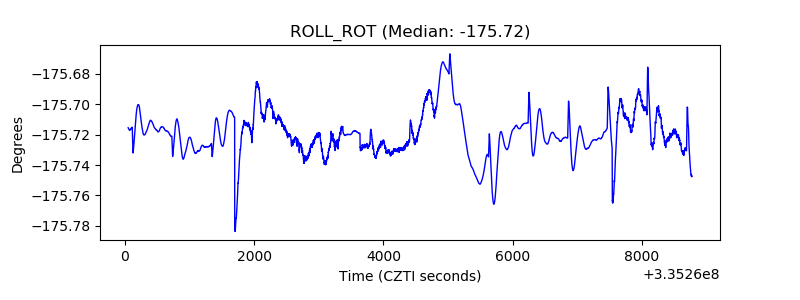 |
| _Roll_DEC | 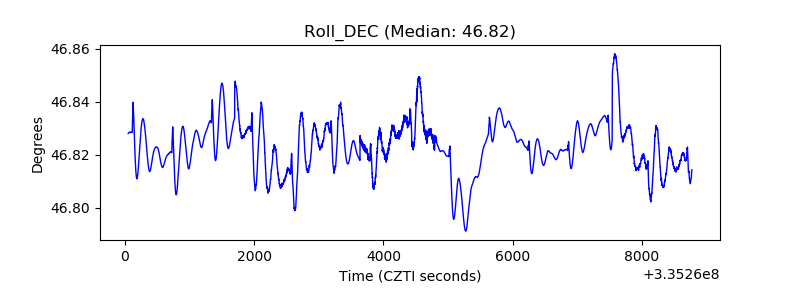 |
| _Roll_RA | 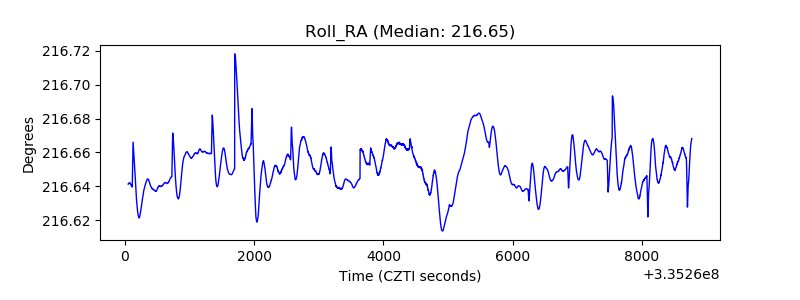 |
| Veto Counter | 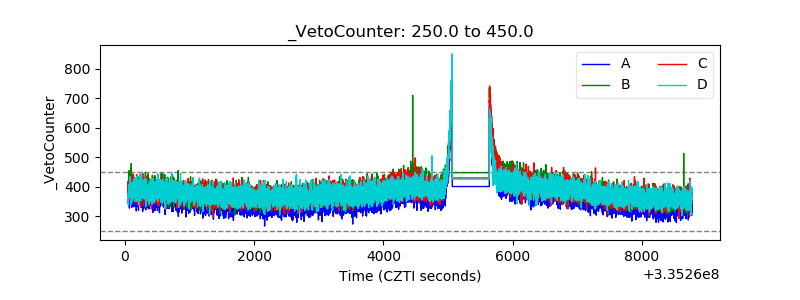 |