| Param | Original file | Final file |
|---|---|---|
| Filename | modeM0/AS1A09_127T02_9000003818_26411cztM0_level2.evt | modeM0/AS1A09_127T02_9000003818_26411cztM0_level2_quad_clean.evt |
| Size (bytes) | 783,515,520 | 126,440,640 |
| Size | 747.2 MB | 120.6 MB |
| Events in quadrant A | 4,414,915 | 828,791 |
| Events in quadrant B | 5,785,701 | 796,497 |
| Events in quadrant C | 6,273,493 | 783,251 |
| Events in quadrant D | 6,619,568 | 769,351 |
| Mode M9 | |||
|---|---|---|---|
| Quadrant | BADHDUFLAG | Total packets | Discarded packets |
| A | 0 | 16 | 0 |
| B | 0 | 16 | 0 |
| C | 0 | 16 | 0 |
| D | 0 | 16 | 0 |
| Mode M0 | |||
|---|---|---|---|
| Quadrant | BADHDUFLAG | Total packets | Discarded packets |
| A | 0 | 19309 | 0 |
| B | 0 | 23160 | 0 |
| C | 0 | 24557 | 0 |
| D | 0 | 26160 | 0 |
| Quadrant | Total seconds | Saturated seconds | Saturation percentage |
|---|---|---|---|
| A | 9381 | 96 | 1.023345% |
| B | 9382 | 491 | 5.233426% |
| C | 9382 | 545 | 5.808996% |
| D | 9382 | 409 | 4.359412% |
Noise dominated data is calculated using 1-second bins in cleaned event files. If a bin has >2000 counts, and if more than 50% of those come from <1% of pixels, then it is considered to be noise-dominated and hence unusable.
| Quadrant | # 1 sec bins | Bins with >0 counts | Bins with >2000 counts | High rate bins dominated by noise | Noise dominated (total time) | Noise dominated (detector-on time) | Marked lightcurve |
|---|---|---|---|---|---|---|---|
| A | 11086 | 9383 | 1 | 1 | 0.01% | 0.01% |  |
| B | 11086 | 9383 | 327 | 327 | 2.95% | 3.49% |  |
| C | 11087 | 9383 | 231 | 231 | 2.08% | 2.46% |  |
| D | 11087 | 9384 | 242 | 242 | 2.18% | 2.58% |  |
Top three noisy pixels from each quadrant. If the there are fewer than three noisy pixels in the level2.evt file, extra rows are filled as -1
| Pixel properties | Quadrant properties | ||||||
|---|---|---|---|---|---|---|---|
| Quadrant | DetID | PixID | Counts | Sigma | Mean | Median | Sigma |
| A | 13 | 254 | 16890 | 68.95 | 1140 | 1113 | 228.8 |
| A | 0 | 13 | 14509 | 58.54 | 1140 | 1113 | 228.8 |
| A | 3 | 137 | 10338 | 40.31 | 1140 | 1113 | 228.8 |
| B | 5 | 172 | 1022353 | 4856.78 | 1106 | 1080 | 210.3 |
| B | 0 | 244 | 242126 | 1146.32 | 1106 | 1080 | 210.3 |
| B | 0 | 190 | 41282 | 191.19 | 1106 | 1080 | 210.3 |
| C | 3 | 233 | 1182993 | 4703.2 | 1075 | 1081 | 251.3 |
| C | 2 | 16 | 624502 | 2480.79 | 1075 | 1081 | 251.3 |
| C | 14 | 238 | 170319 | 673.45 | 1075 | 1081 | 251.3 |
| D | 1 | 52 | 2013955 | 7768.72 | 1093 | 1067 | 259.1 |
| D | 12 | 233 | 310605 | 1194.66 | 1093 | 1067 | 259.1 |
| D | 2 | 234 | 48772 | 184.12 | 1093 | 1067 | 259.1 |
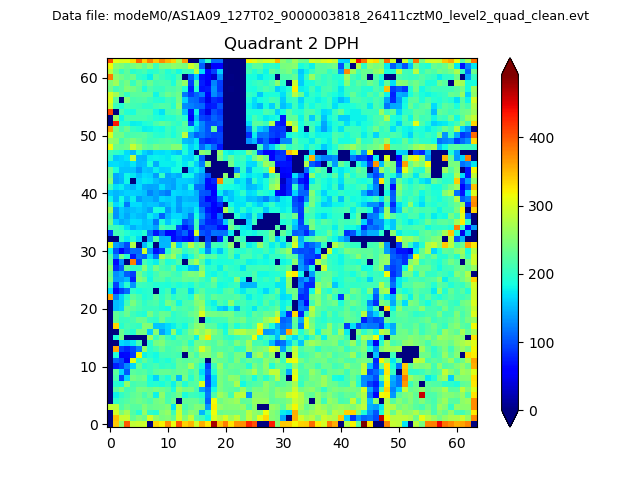
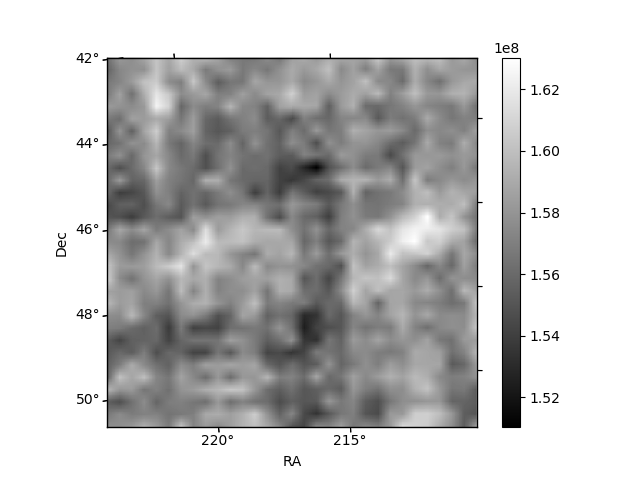
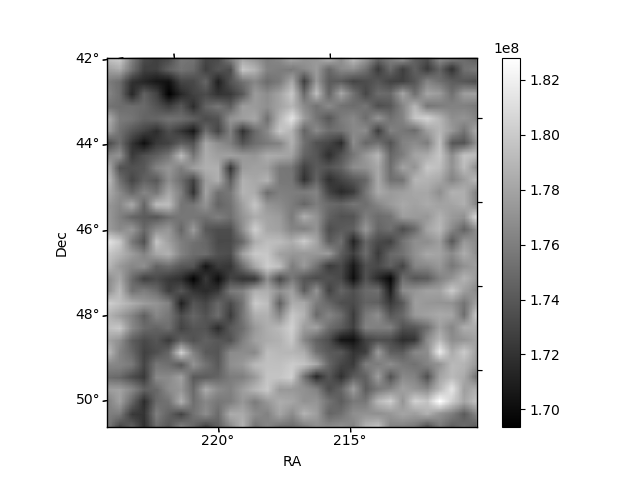
Histogram calculated using DETX and DETY for each event in the final _common_clean file
| Quadrant A | 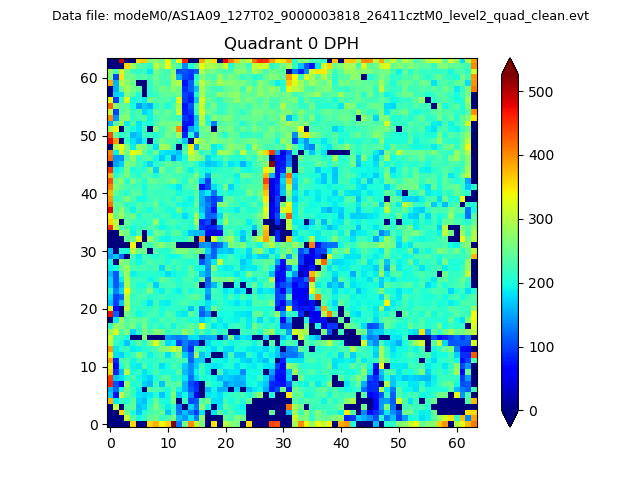 |
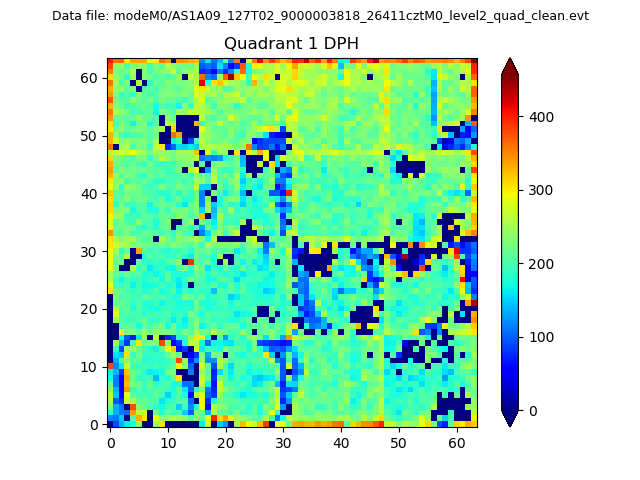 |
Quadrant B |
|---|---|---|---|
| Quadrant D | 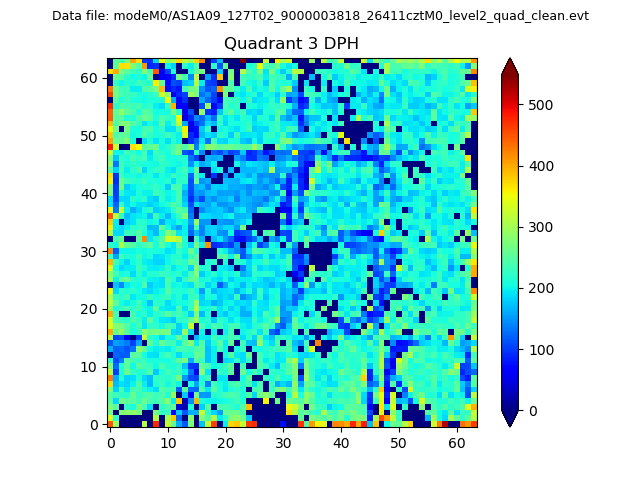 |
 |
Quadrant C |
| Plot type | Count rate plots | Images |
|---|---|---|
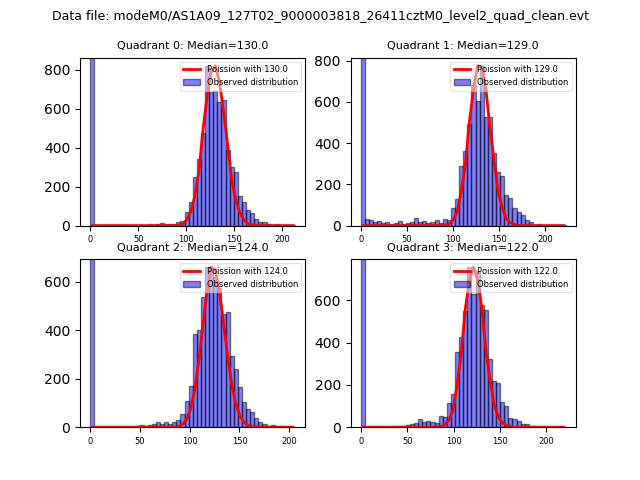
| Comparison with Poisson distribution Blue bars denote a histogram of data divided into 1 sec bins. Red curve is a Poisson curve with rate = median count rate of data. |
 |
 |
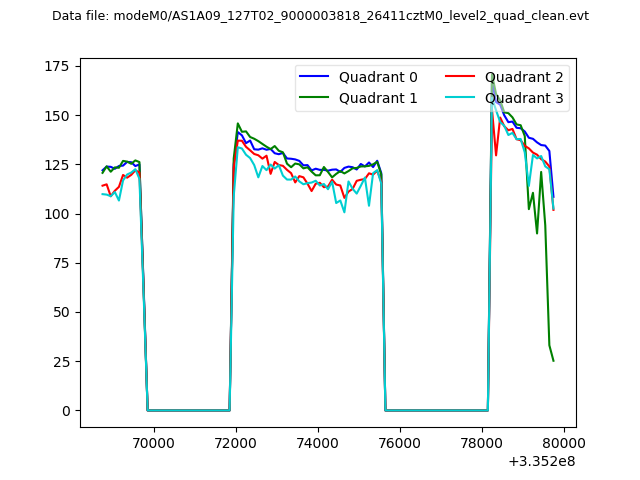
| Quadrant-wise count rates Data is divided into 100 sec bins |
 |
|
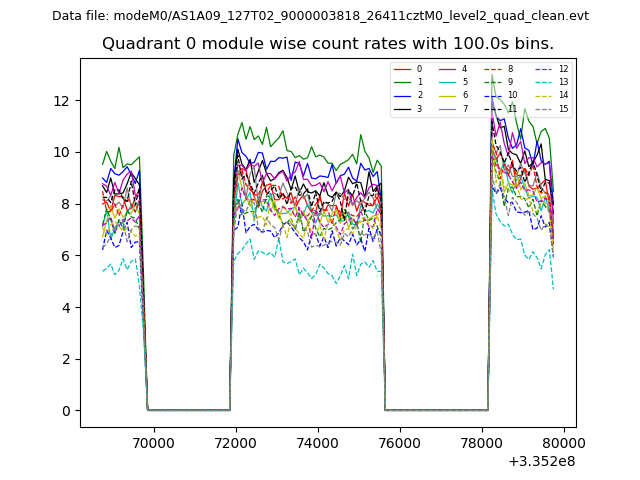
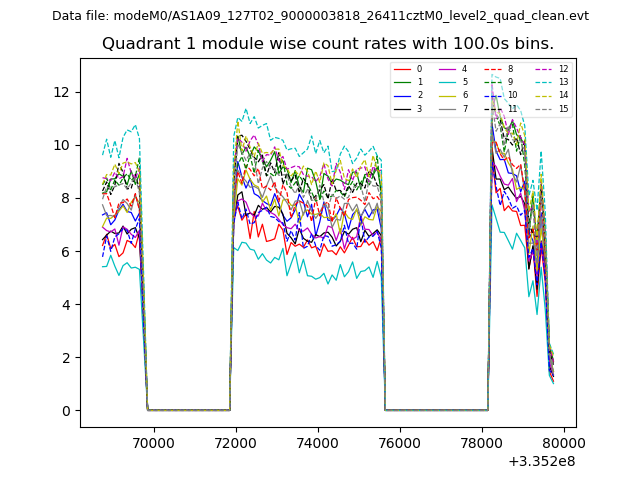
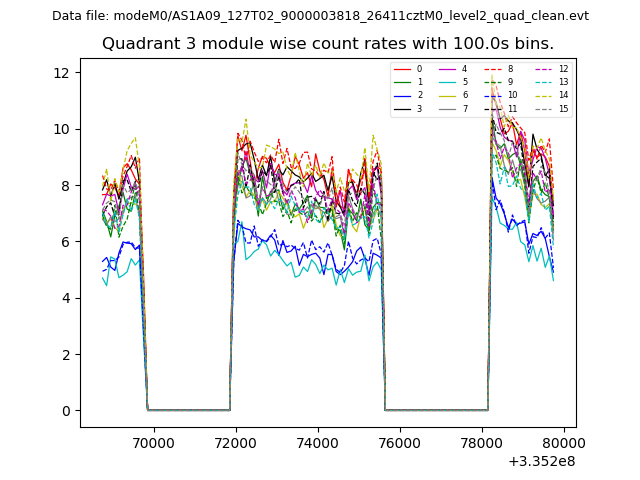
| Module-wise count rates for Quadrant A Data is divided into 100 sec bins |
 |
 |
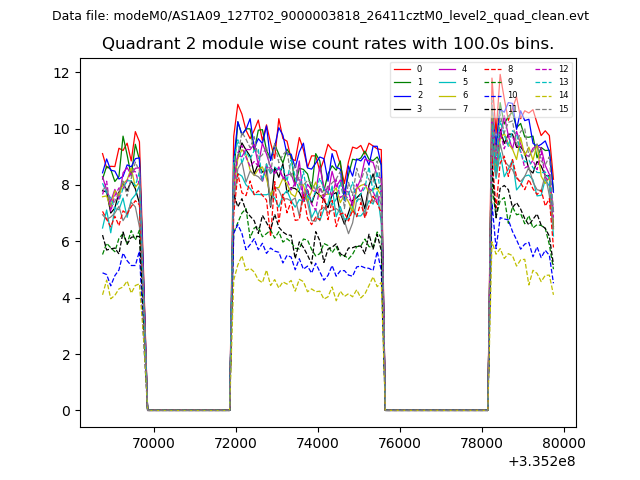
| Module-wise count rates for Quadrant B Data is divided into 100 sec bins |
 |
 |
| Module-wise count rates for Quadrant C Data is divided into 100 sec bins |
 |
 |
| Module-wise count rates for Quadrant D Data is divided into 100 sec bins |
 |
 |
| Parameter | Plot |
|---|---|
| CZT HV Monitor | 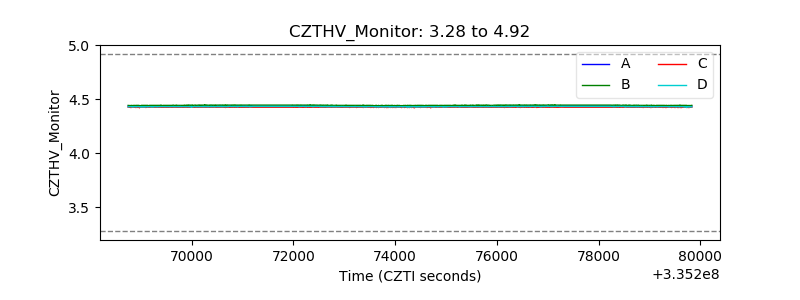 |
| D_VDD | 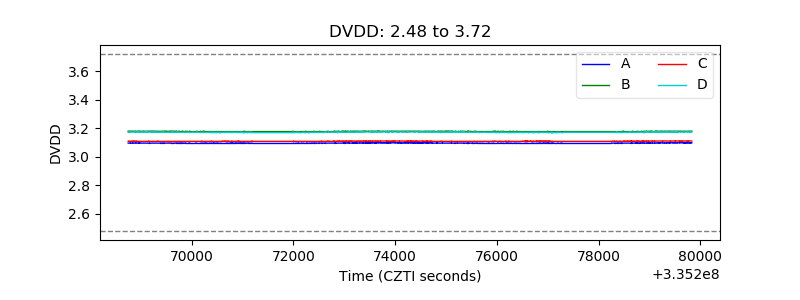 |
| Temperature 1 | 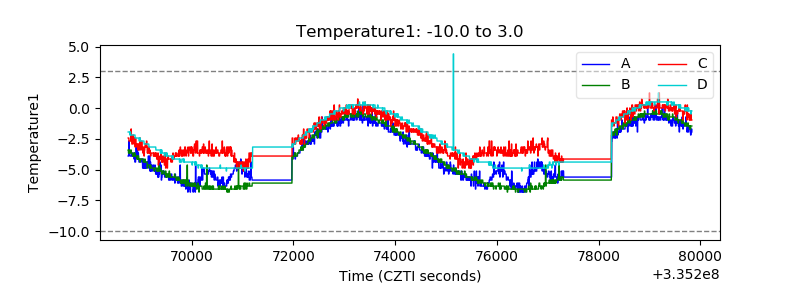 |
| Veto HV Monitor | 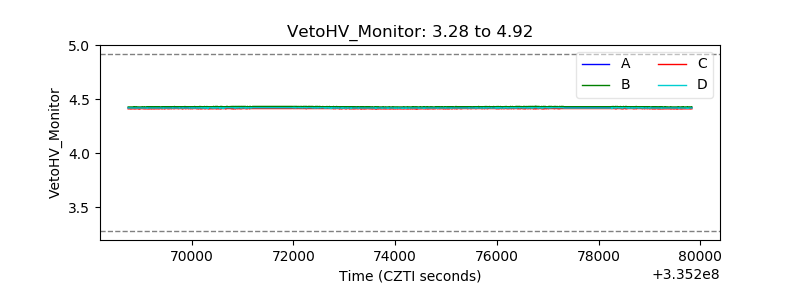 |
| Veto LLD | 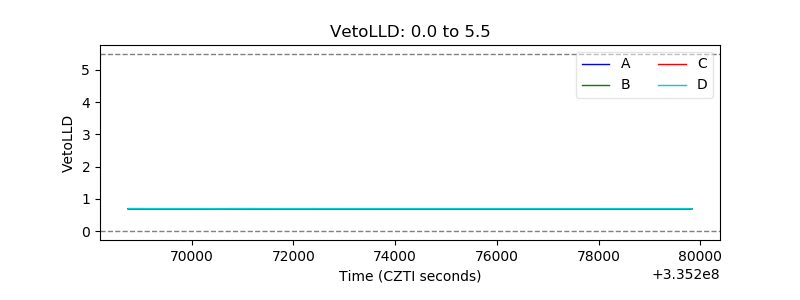 |
| Alpha Counter | 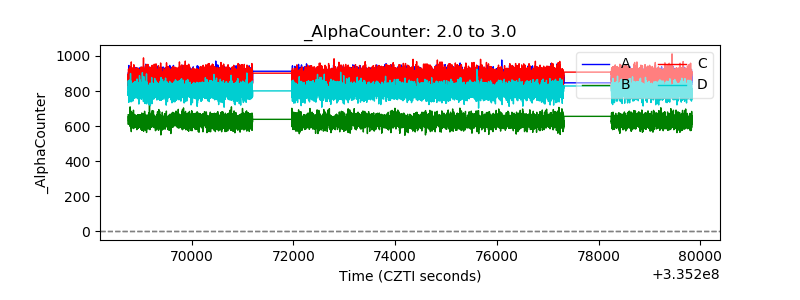 |
| _CPM_Rate |  |
| CZT Counter | 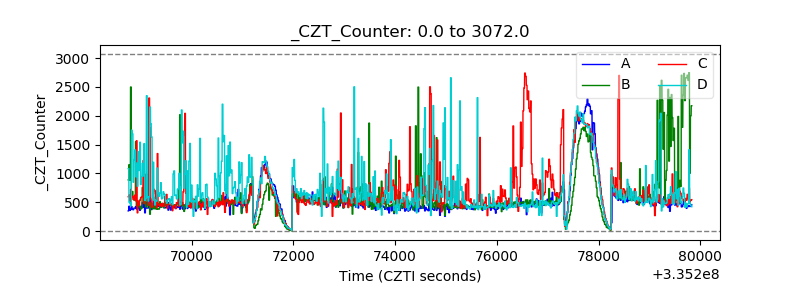 |
| +2.5 Volts monitor | 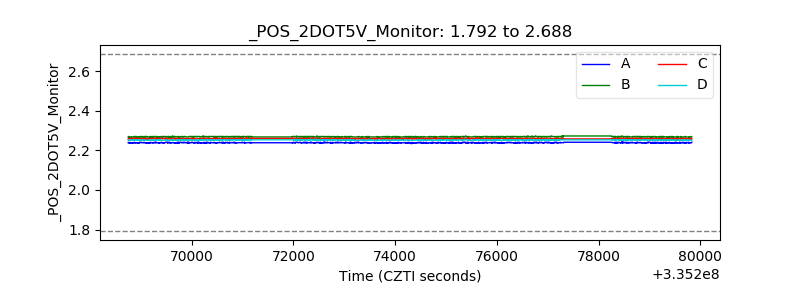 |
| +5 Volts monitor | 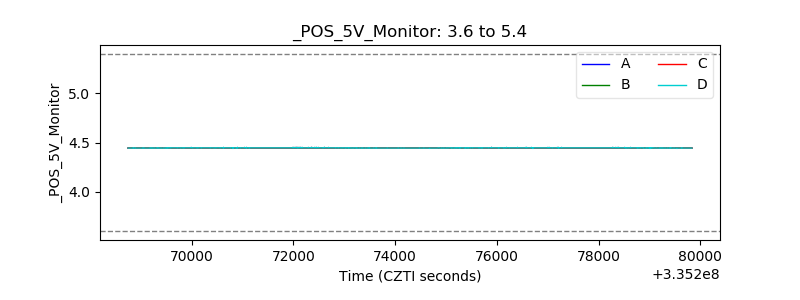 |
| _ROLL_ROT | 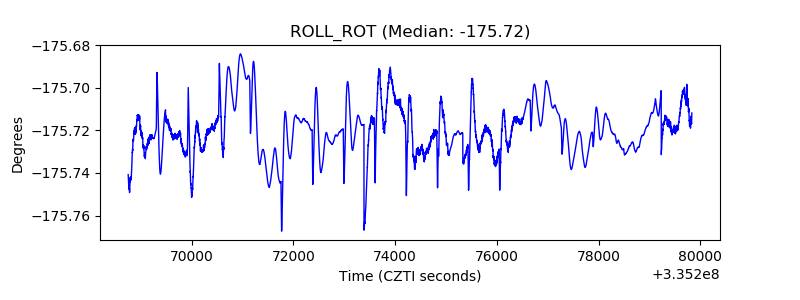 |
| _Roll_DEC | 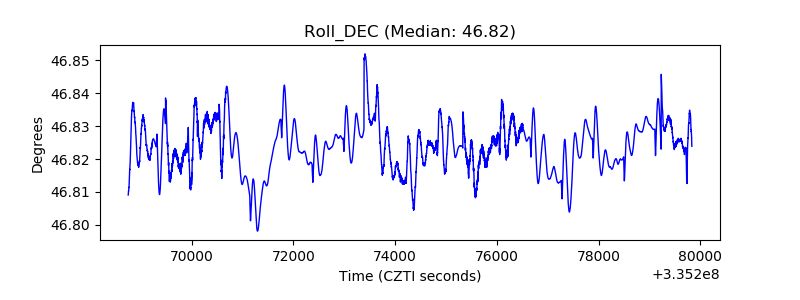 |
| _Roll_RA | 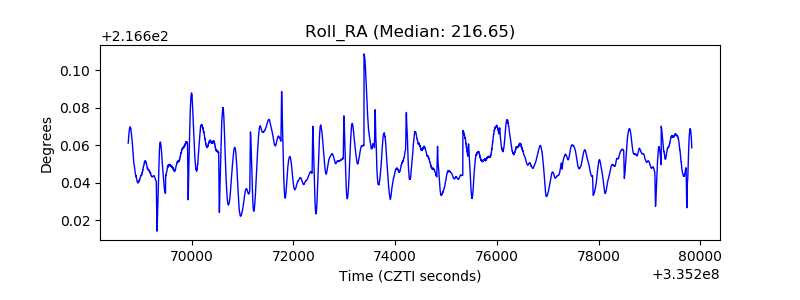 |
| Veto Counter | 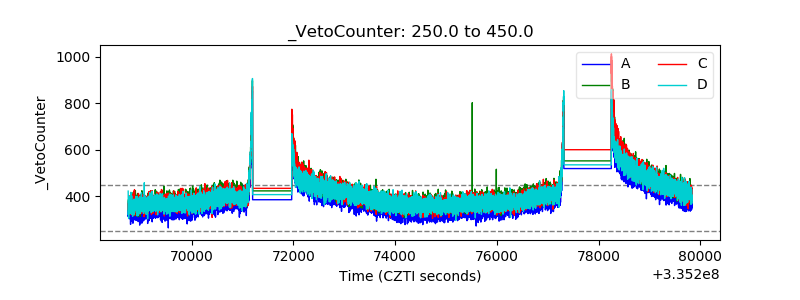 |