| Param | Original file | Final file |
|---|---|---|
| Filename | modeM0/AS1A09_127T02_9000003818_26412cztM0_level2.evt | modeM0/AS1A09_127T02_9000003818_26412cztM0_level2_quad_clean.evt |
| Size (bytes) | 477,714,240 | 81,976,320 |
| Size | 455.6 MB | 78.2 MB |
| Events in quadrant A | 2,734,367 | 545,578 |
| Events in quadrant B | 4,121,027 | 502,133 |
| Events in quadrant C | 3,406,588 | 520,156 |
| Events in quadrant D | 3,813,461 | 510,399 |
| Mode M9 | |||
|---|---|---|---|
| Quadrant | BADHDUFLAG | Total packets | Discarded packets |
| A | 0 | 11 | 0 |
| B | 0 | 11 | 0 |
| C | 0 | 11 | 0 |
| D | 0 | 11 | 0 |
| Mode M0 | |||
|---|---|---|---|
| Quadrant | BADHDUFLAG | Total packets | Discarded packets |
| A | 0 | 12025 | 0 |
| B | 0 | 16103 | 0 |
| C | 0 | 13881 | 0 |
| D | 0 | 15237 | 0 |
| Quadrant | Total seconds | Saturated seconds | Saturation percentage |
|---|---|---|---|
| A | 5773 | 49 | 0.848779% |
| B | 5774 | 580 | 10.045029% |
| C | 5774 | 102 | 1.766540% |
| D | 5774 | 231 | 4.000693% |
Noise dominated data is calculated using 1-second bins in cleaned event files. If a bin has >2000 counts, and if more than 50% of those come from <1% of pixels, then it is considered to be noise-dominated and hence unusable.
| Quadrant | # 1 sec bins | Bins with >0 counts | Bins with >2000 counts | High rate bins dominated by noise | Noise dominated (total time) | Noise dominated (detector-on time) | Marked lightcurve |
|---|---|---|---|---|---|---|---|
| A | 6848 | 5774 | 0 | 0 | 0.00% | 0.00% |  |
| B | 6849 | 5775 | 428 | 428 | 6.25% | 7.41% |  |
| C | 6849 | 5775 | 11 | 11 | 0.16% | 0.19% |  |
| D | 6849 | 5775 | 180 | 180 | 2.63% | 3.12% |  |
Top three noisy pixels from each quadrant. If the there are fewer than three noisy pixels in the level2.evt file, extra rows are filled as -1
| Pixel properties | Quadrant properties | ||||||
|---|---|---|---|---|---|---|---|
| Quadrant | DetID | PixID | Counts | Sigma | Mean | Median | Sigma |
| A | 13 | 254 | 10794 | 72.31 | 705 | 689 | 139.7 |
| A | 0 | 31 | 7823 | 51.05 | 705 | 689 | 139.7 |
| A | 0 | 226 | 6158 | 39.14 | 705 | 689 | 139.7 |
| B | 5 | 172 | 1299932 | 10230.01 | 666 | 649 | 127.0 |
| B | 0 | 244 | 153514 | 1203.6 | 666 | 649 | 127.0 |
| B | 15 | 32 | 23536 | 180.2 | 666 | 649 | 127.0 |
| C | 3 | 233 | 461087 | 2876.13 | 679 | 683 | 160.1 |
| C | 2 | 16 | 176545 | 1098.61 | 679 | 683 | 160.1 |
| C | 14 | 238 | 107691 | 668.48 | 679 | 683 | 160.1 |
| D | 1 | 52 | 730289 | 4498.19 | 683 | 667 | 162.2 |
| D | 7 | 80 | 217145 | 1334.61 | 683 | 667 | 162.2 |
| D | 12 | 233 | 112426 | 689.0 | 683 | 667 | 162.2 |
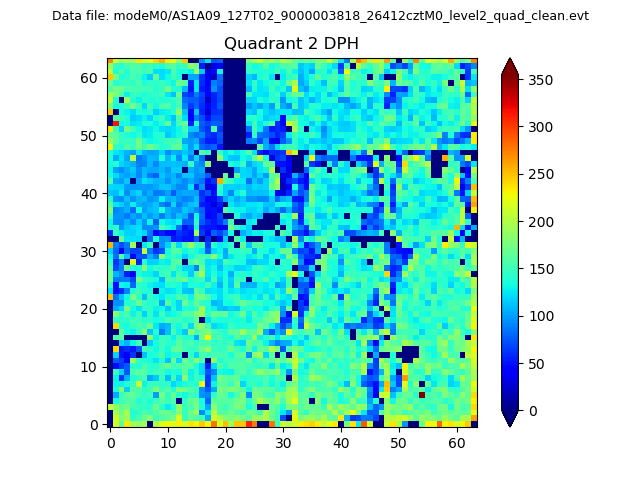
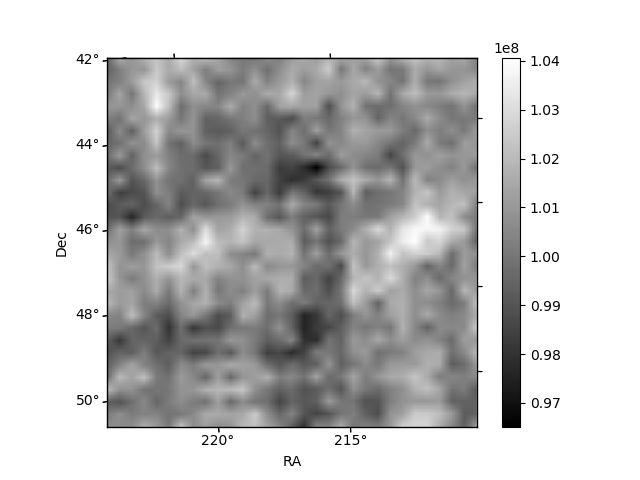
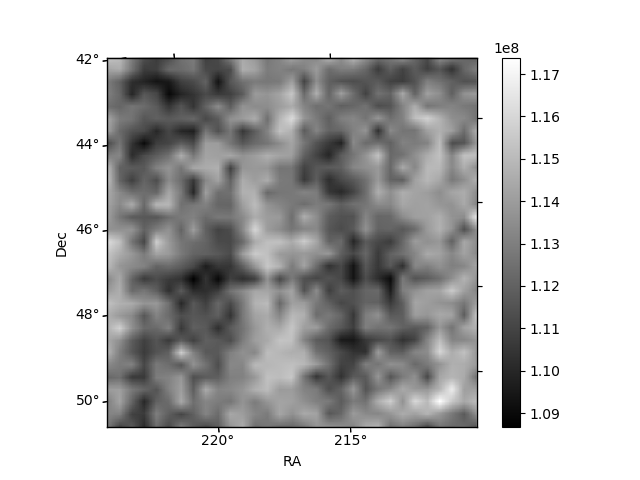
Histogram calculated using DETX and DETY for each event in the final _common_clean file
| Quadrant A | 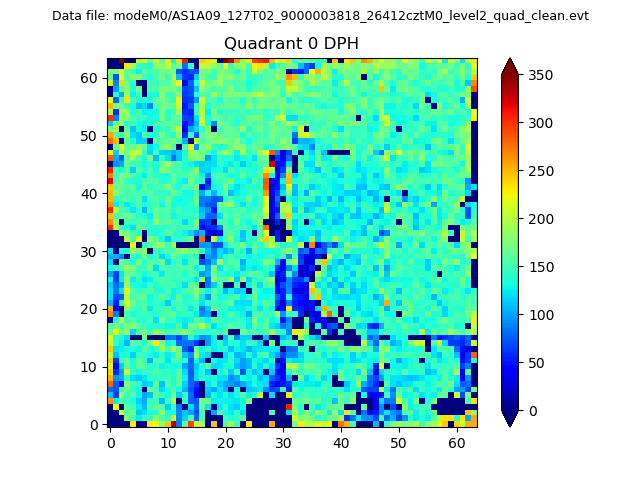 |
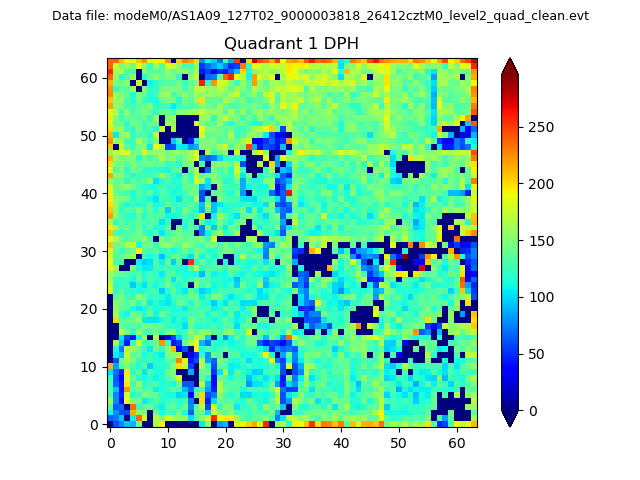 |
Quadrant B |
|---|---|---|---|
| Quadrant D | 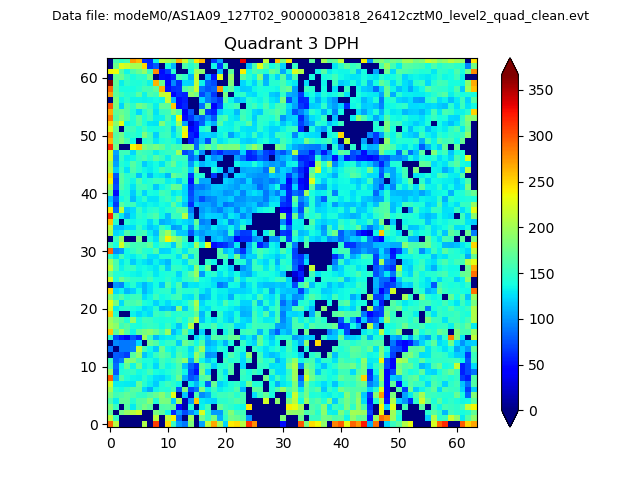 |
 |
Quadrant C |
| Plot type | Count rate plots | Images |
|---|---|---|
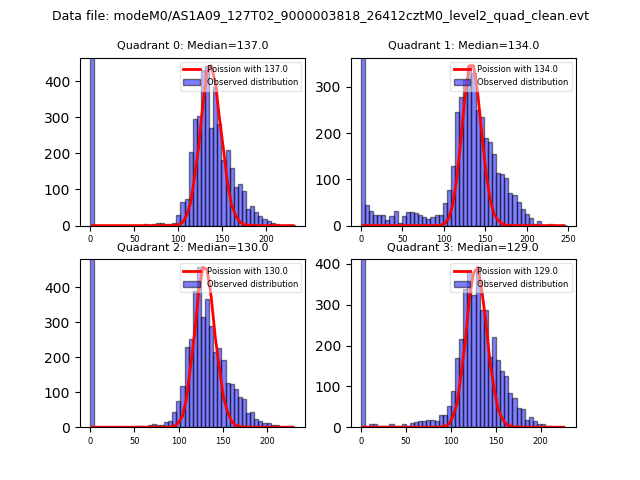
| Comparison with Poisson distribution Blue bars denote a histogram of data divided into 1 sec bins. Red curve is a Poisson curve with rate = median count rate of data. |
 |
 |
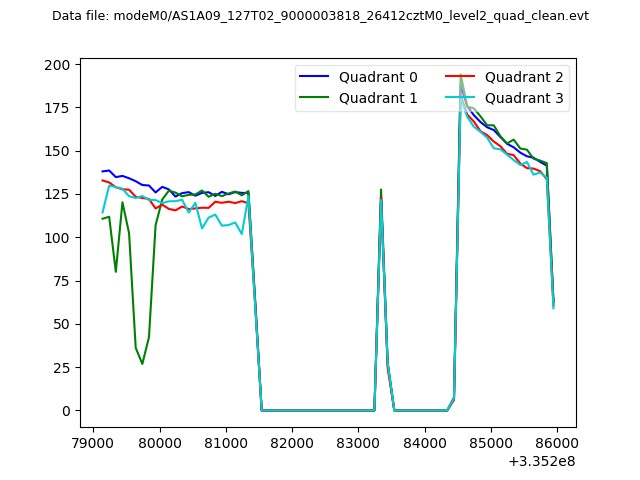
| Quadrant-wise count rates Data is divided into 100 sec bins |
 |
|
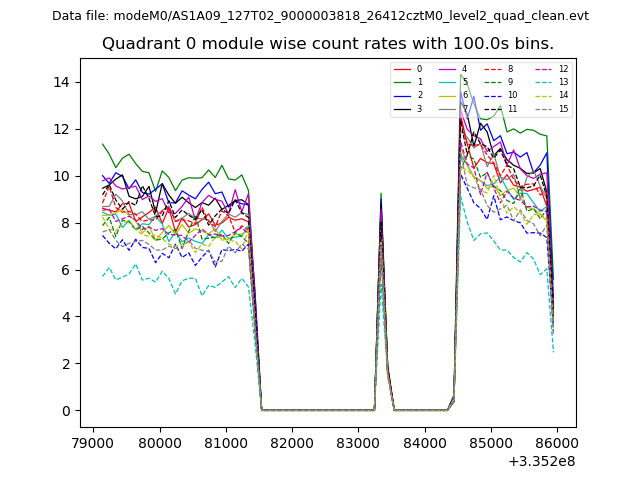
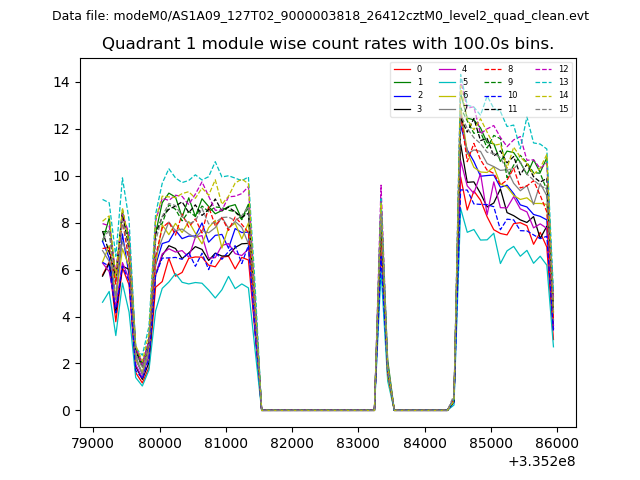
| Module-wise count rates for Quadrant A Data is divided into 100 sec bins |
 |
 |
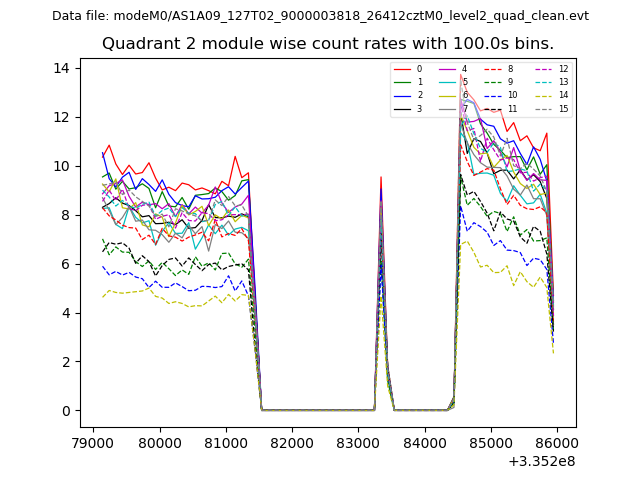
| Module-wise count rates for Quadrant B Data is divided into 100 sec bins |
 |
 |
| Module-wise count rates for Quadrant C Data is divided into 100 sec bins |
 |
 |
| Module-wise count rates for Quadrant D Data is divided into 100 sec bins |
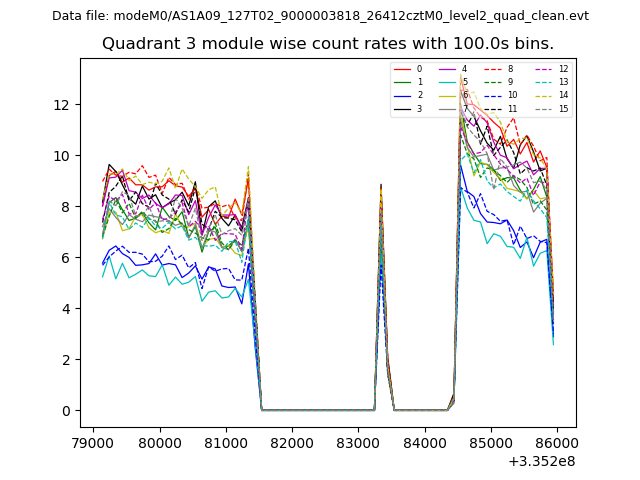 |
 |
| Parameter | Plot |
|---|---|
| CZT HV Monitor | 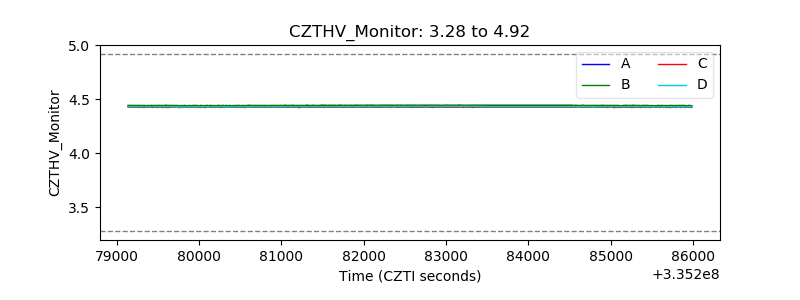 |
| D_VDD | 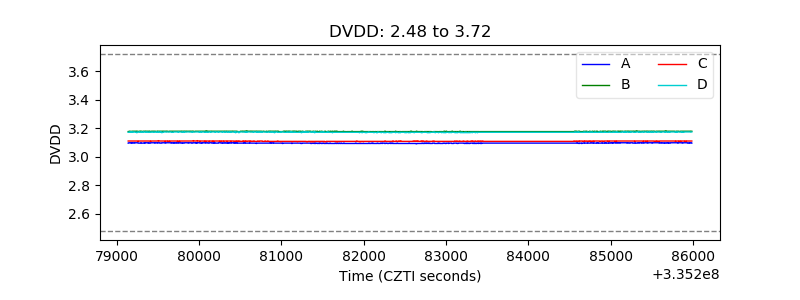 |
| Temperature 1 | 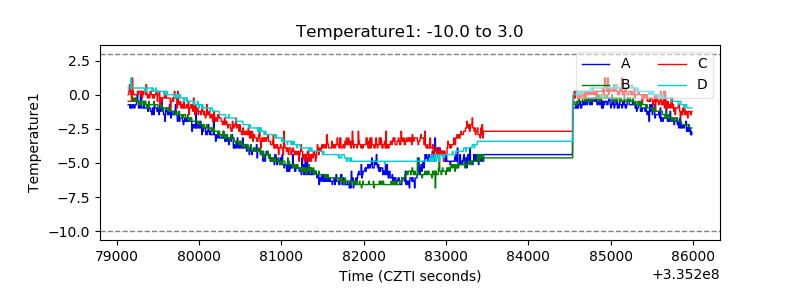 |
| Veto HV Monitor |  |
| Veto LLD | 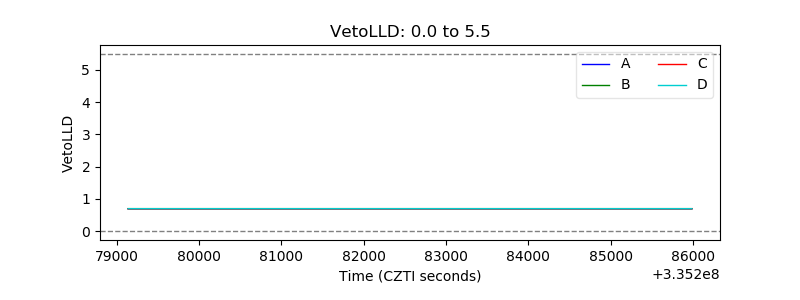 |
| Alpha Counter | 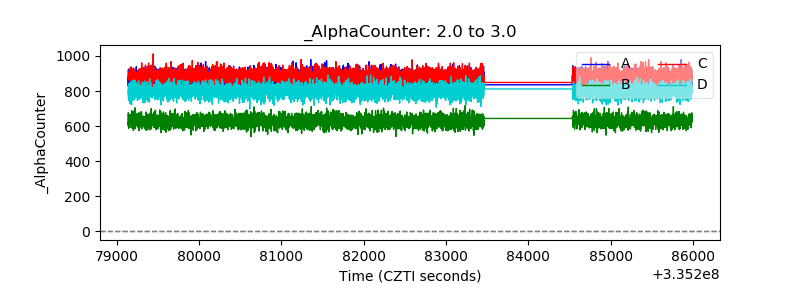 |
| _CPM_Rate |  |
| CZT Counter |  |
| +2.5 Volts monitor | 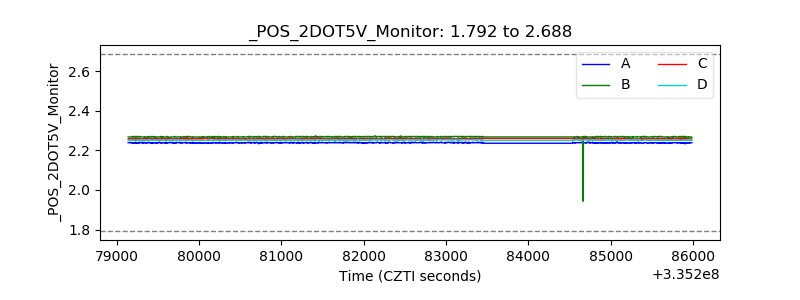 |
| +5 Volts monitor |  |
| _ROLL_ROT | 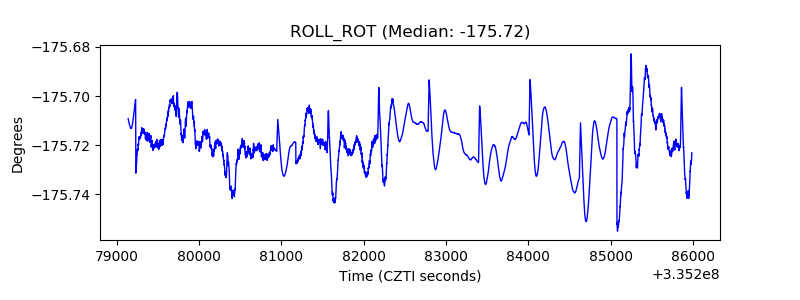 |
| _Roll_DEC | 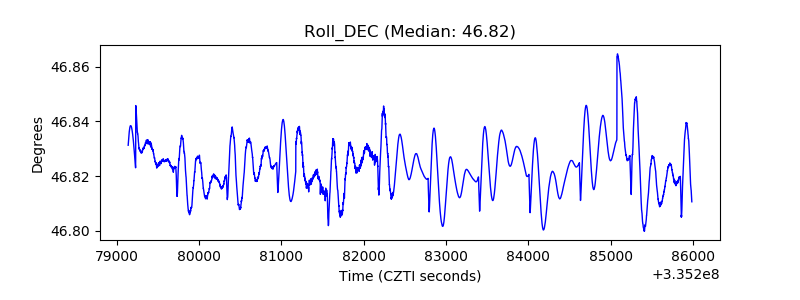 |
| _Roll_RA | 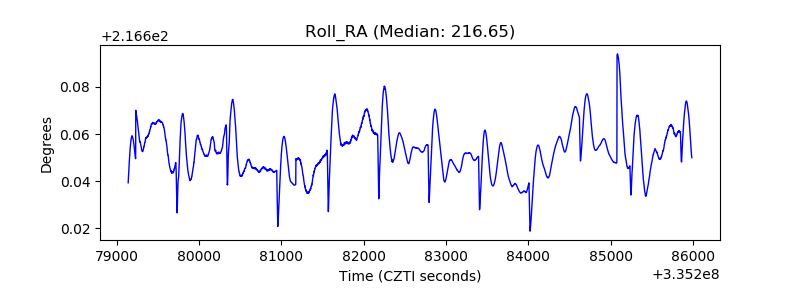 |
| Veto Counter | 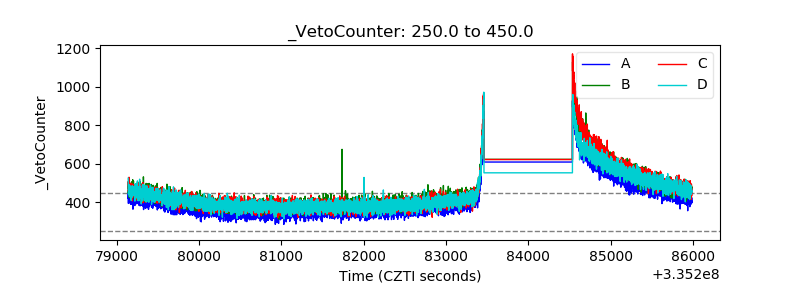 |