| Param | Original file | Final file |
|---|---|---|
| Filename | modeM0/AS1A09_127T02_9000003818_26415cztM0_level2.evt | modeM0/AS1A09_127T02_9000003818_26415cztM0_level2_quad_clean.evt |
| Size (bytes) | 518,063,040 | 105,903,360 |
| Size | 494.1 MB | 101.0 MB |
| Events in quadrant A | 3,256,041 | 701,873 |
| Events in quadrant B | 3,353,494 | 724,702 |
| Events in quadrant C | 3,594,966 | 686,300 |
| Events in quadrant D | 5,063,011 | 659,963 |
| Mode M9 | |||
|---|---|---|---|
| Quadrant | BADHDUFLAG | Total packets | Discarded packets |
| A | 0 | 15 | 0 |
| B | 0 | 16 | 0 |
| C | 0 | 16 | 0 |
| D | 0 | 16 | 0 |
| Mode M0 | |||
|---|---|---|---|
| Quadrant | BADHDUFLAG | Total packets | Discarded packets |
| A | 0 | 13723 | 0 |
| B | 0 | 13932 | 0 |
| C | 0 | 14682 | 0 |
| D | 0 | 19255 | 0 |
| Quadrant | Total seconds | Saturated seconds | Saturation percentage |
|---|---|---|---|
| A | 6228 | 58 | 0.931278% |
| B | 6228 | 57 | 0.915222% |
| C | 6227 | 144 | 2.312510% |
| D | 6227 | 392 | 6.295166% |
Noise dominated data is calculated using 1-second bins in cleaned event files. If a bin has >2000 counts, and if more than 50% of those come from <1% of pixels, then it is considered to be noise-dominated and hence unusable.
| Quadrant | # 1 sec bins | Bins with >0 counts | Bins with >2000 counts | High rate bins dominated by noise | Noise dominated (total time) | Noise dominated (detector-on time) | Marked lightcurve |
|---|---|---|---|---|---|---|---|
| A | 7538 | 6229 | 26 | 26 | 0.34% | 0.42% | 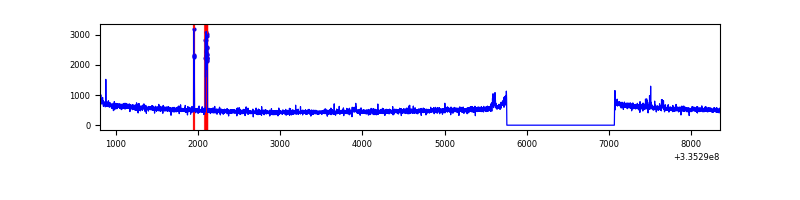 |
| B | 7538 | 6229 | 4 | 4 | 0.05% | 0.06% | 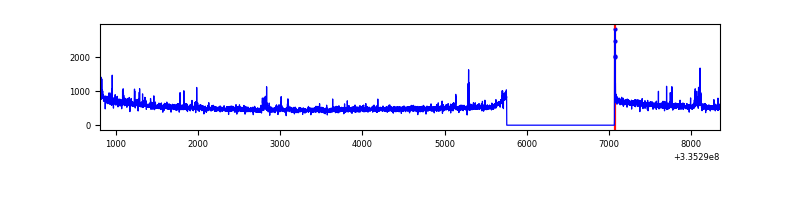 |
| C | 7537 | 6228 | 37 | 37 | 0.49% | 0.59% | 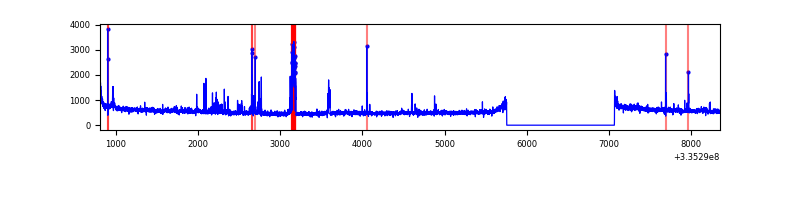 |
| D | 7537 | 6227 | 320 | 320 | 4.25% | 5.14% | 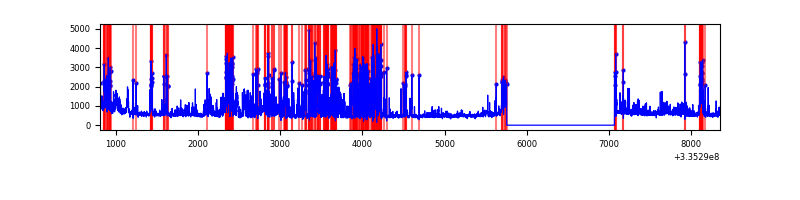 |
Top three noisy pixels from each quadrant. If the there are fewer than three noisy pixels in the level2.evt file, extra rows are filled as -1
| Pixel properties | Quadrant properties | ||||||
|---|---|---|---|---|---|---|---|
| Quadrant | DetID | PixID | Counts | Sigma | Mean | Median | Sigma |
| A | 15 | 192 | 96304 | 588.59 | 818 | 803 | 162.3 |
| A | 13 | 254 | 11606 | 66.58 | 818 | 803 | 162.3 |
| A | 0 | 226 | 7198 | 39.41 | 818 | 803 | 162.3 |
| B | 0 | 244 | 50197 | 326.78 | 826 | 809 | 151.1 |
| B | 0 | 230 | 22070 | 140.68 | 826 | 809 | 151.1 |
| B | 12 | 111 | 16634 | 104.71 | 826 | 809 | 151.1 |
| C | 2 | 16 | 223664 | 1205.31 | 801 | 806 | 184.9 |
| C | 14 | 238 | 128091 | 688.41 | 801 | 806 | 184.9 |
| C | 3 | 233 | 102462 | 549.8 | 801 | 806 | 184.9 |
| D | 1 | 52 | 1490153 | 8080.15 | 787 | 771 | 184.3 |
| D | 12 | 233 | 169474 | 915.24 | 787 | 771 | 184.3 |
| D | 7 | 80 | 162725 | 878.63 | 787 | 771 | 184.3 |
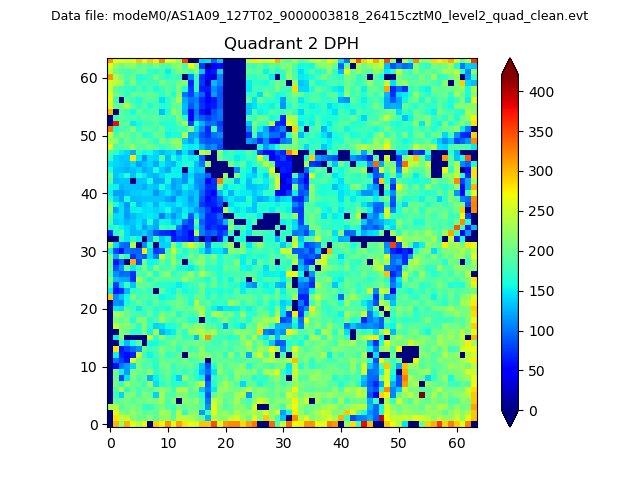
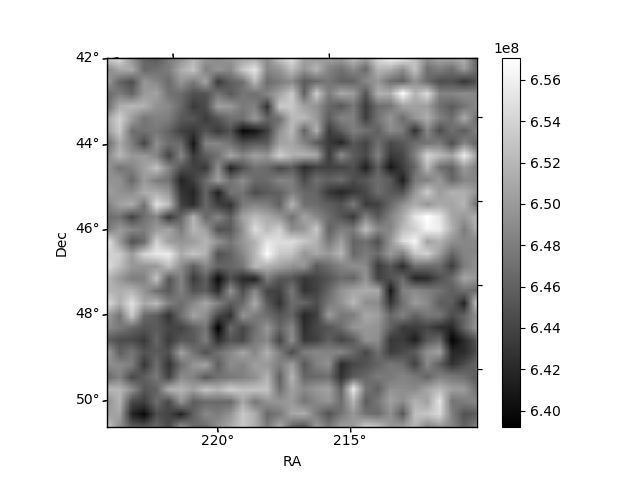
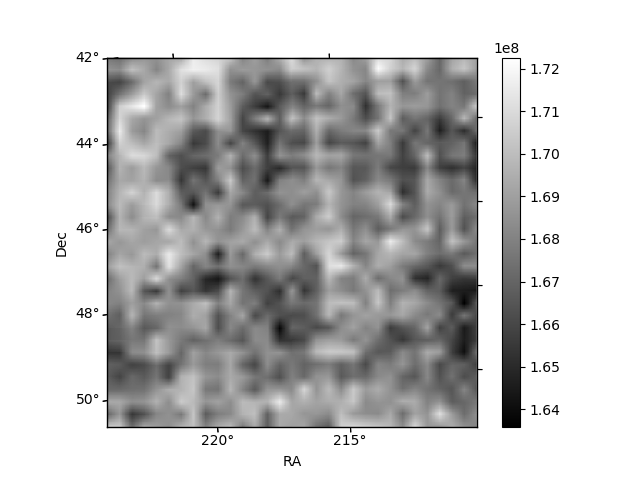
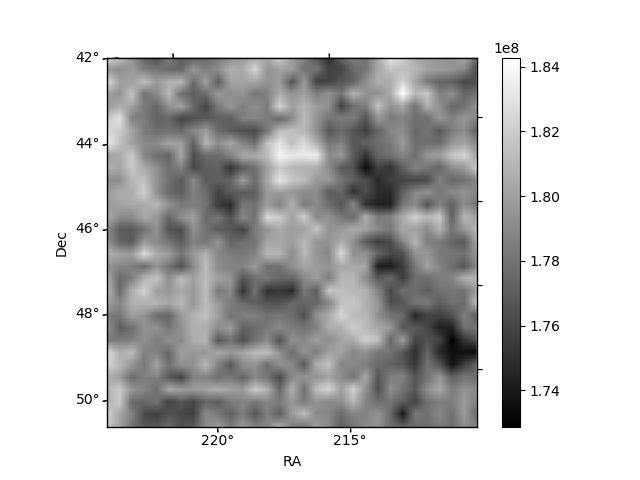
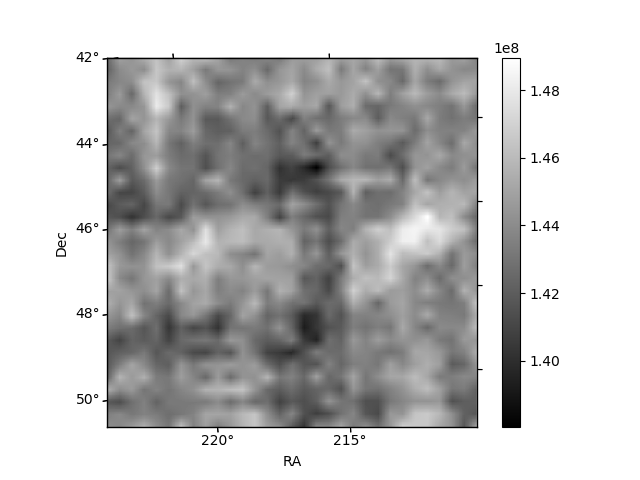
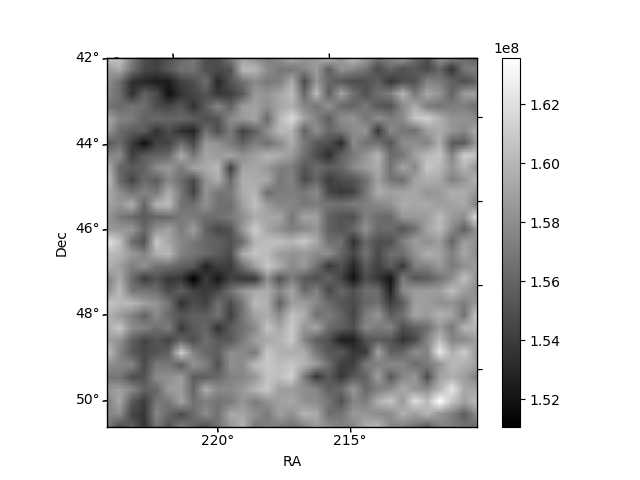
Histogram calculated using DETX and DETY for each event in the final _common_clean file
| Quadrant A | 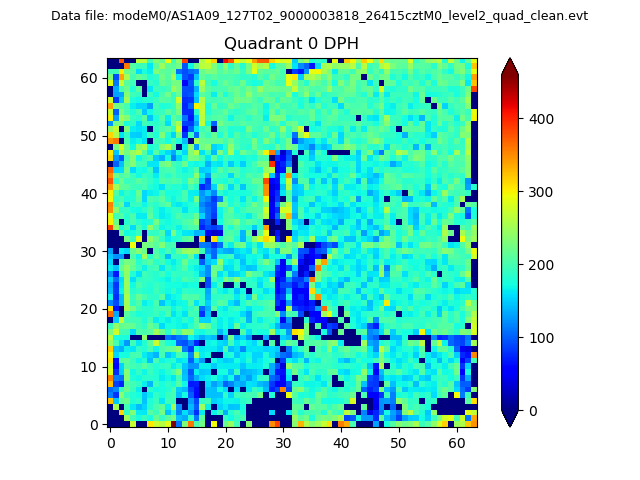 |
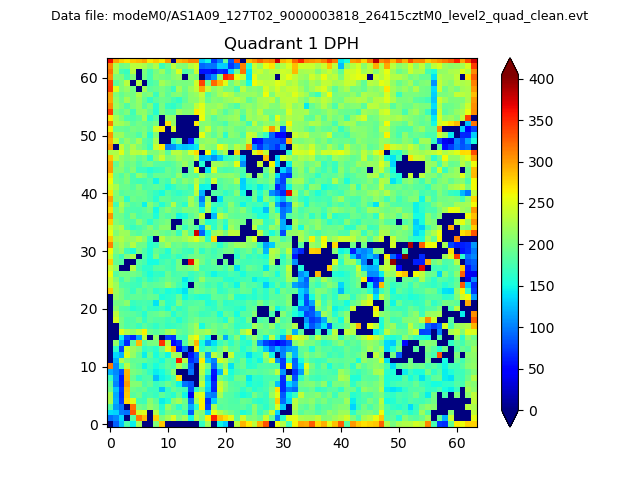 |
Quadrant B |
|---|---|---|---|
| Quadrant D | 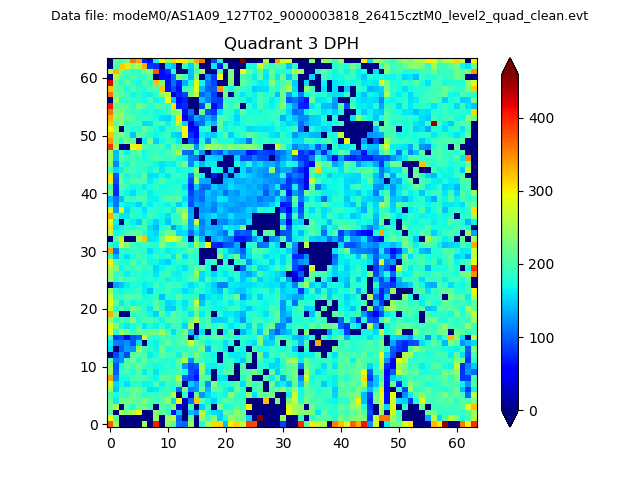 |
 |
Quadrant C |
| Plot type | Count rate plots | Images |
|---|---|---|
| Comparison with Poisson distribution Blue bars denote a histogram of data divided into 1 sec bins. Red curve is a Poisson curve with rate = median count rate of data. |
 |
 |
| Quadrant-wise count rates Data is divided into 100 sec bins |
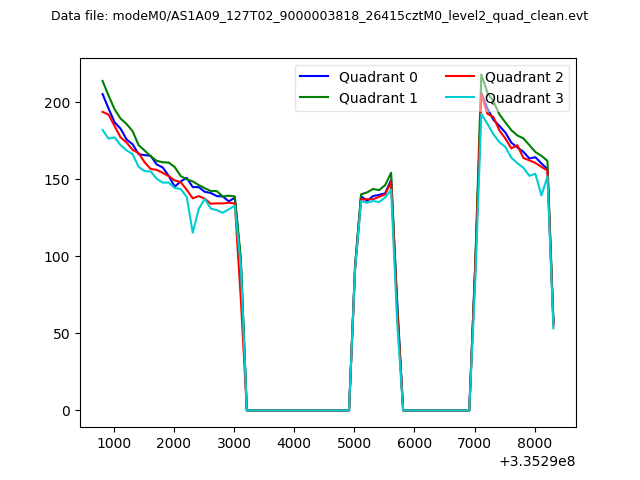 |
|
| Module-wise count rates for Quadrant A Data is divided into 100 sec bins |
 |
 |
| Module-wise count rates for Quadrant B Data is divided into 100 sec bins |
 |
 |
| Module-wise count rates for Quadrant C Data is divided into 100 sec bins |
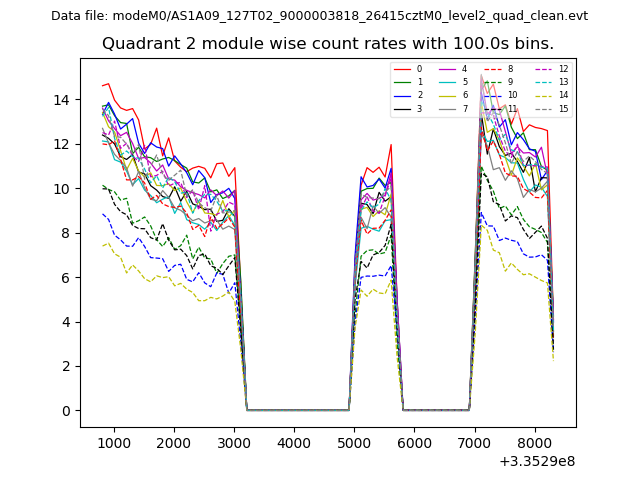 |
 |
| Module-wise count rates for Quadrant D Data is divided into 100 sec bins |
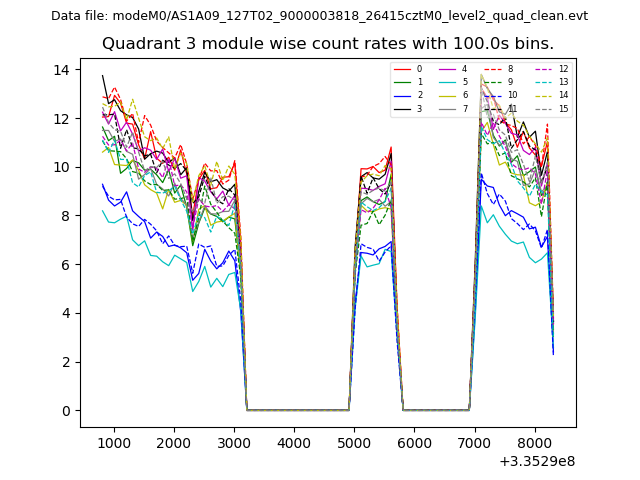 |
 |
| Parameter | Plot |
|---|---|
| CZT HV Monitor |  |
| D_VDD | 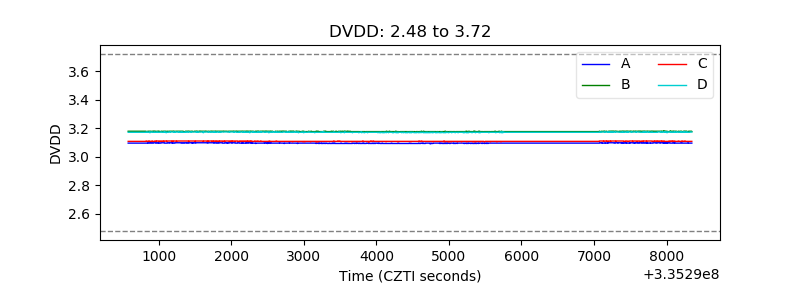 |
| Temperature 1 | 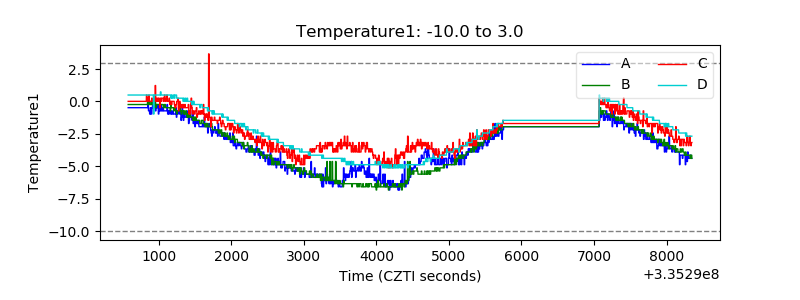 |
| Veto HV Monitor |  |
| Veto LLD |  |
| Alpha Counter | 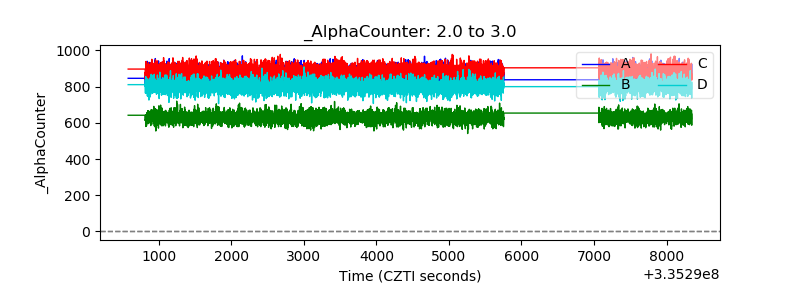 |
| _CPM_Rate | 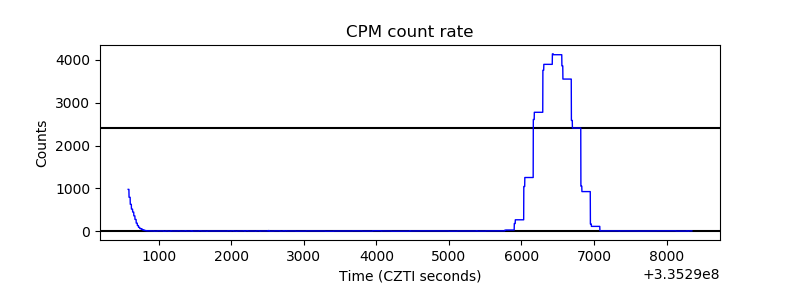 |
| CZT Counter | 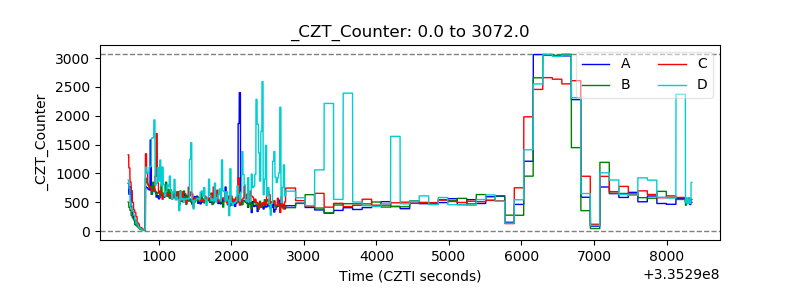 |
| +2.5 Volts monitor | 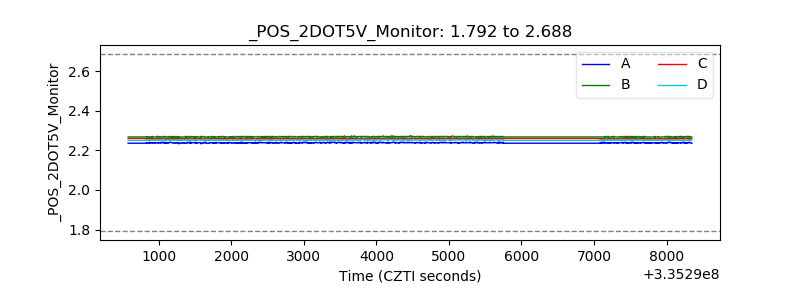 |
| +5 Volts monitor |  |
| _ROLL_ROT |  |
| _Roll_DEC | 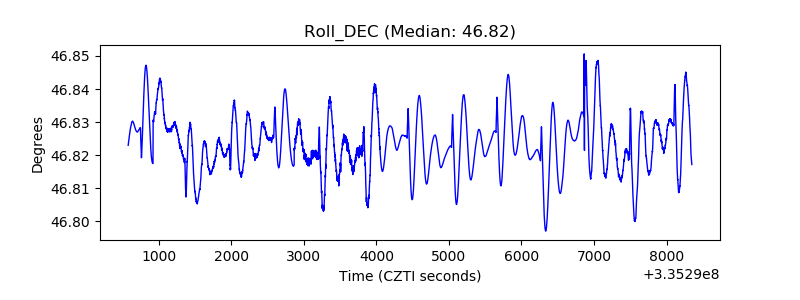 |
| _Roll_RA | 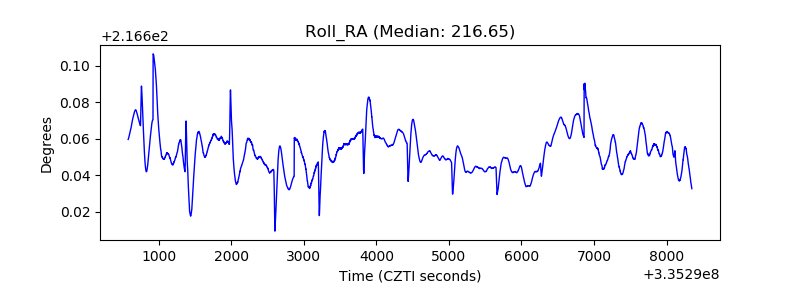 |
| Veto Counter | 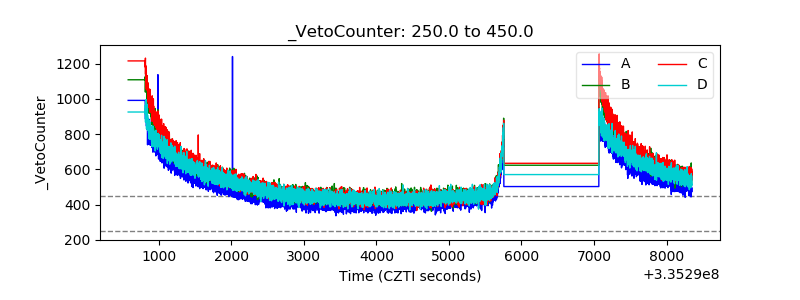 |