| Param | Original file | Final file |
|---|---|---|
| Filename | modeM0/AS1A09_127T02_9000003818_26416cztM0_level2.evt | modeM0/AS1A09_127T02_9000003818_26416cztM0_level2_quad_clean.evt |
| Size (bytes) | 501,940,800 | 101,750,400 |
| Size | 478.7 MB | 97.0 MB |
| Events in quadrant A | 3,089,951 | 674,890 |
| Events in quadrant B | 3,273,534 | 704,416 |
| Events in quadrant C | 3,525,475 | 664,550 |
| Events in quadrant D | 4,904,845 | 617,956 |
| Mode M9 | |||
|---|---|---|---|
| Quadrant | BADHDUFLAG | Total packets | Discarded packets |
| A | 0 | 17 | 0 |
| B | 0 | 18 | 0 |
| C | 0 | 18 | 0 |
| D | 0 | 18 | 0 |
| Mode M0 | |||
|---|---|---|---|
| Quadrant | BADHDUFLAG | Total packets | Discarded packets |
| A | 0 | 12949 | 0 |
| B | 0 | 13496 | 0 |
| C | 0 | 14295 | 0 |
| D | 0 | 18761 | 0 |
| Quadrant | Total seconds | Saturated seconds | Saturation percentage |
|---|---|---|---|
| A | 6009 | 22 | 0.366117% |
| B | 6009 | 32 | 0.532535% |
| C | 6009 | 138 | 2.296555% |
| D | 6009 | 482 | 8.021301% |
Noise dominated data is calculated using 1-second bins in cleaned event files. If a bin has >2000 counts, and if more than 50% of those come from <1% of pixels, then it is considered to be noise-dominated and hence unusable.
| Quadrant | # 1 sec bins | Bins with >0 counts | Bins with >2000 counts | High rate bins dominated by noise | Noise dominated (total time) | Noise dominated (detector-on time) | Marked lightcurve |
|---|---|---|---|---|---|---|---|
| A | 7404 | 6010 | 0 | 0 | 0.00% | 0.00% | 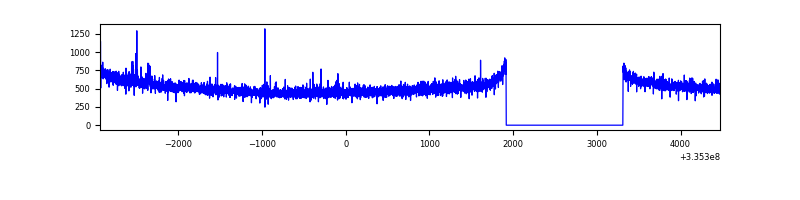 |
| B | 7404 | 6010 | 5 | 5 | 0.07% | 0.08% | 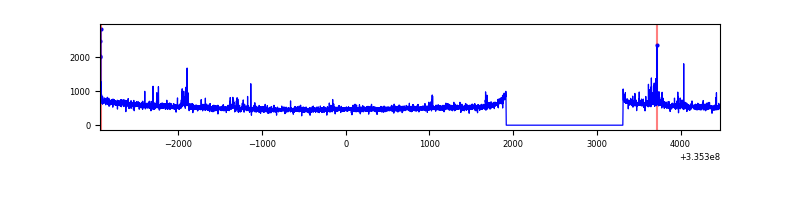 |
| C | 7404 | 6010 | 46 | 46 | 0.62% | 0.77% | 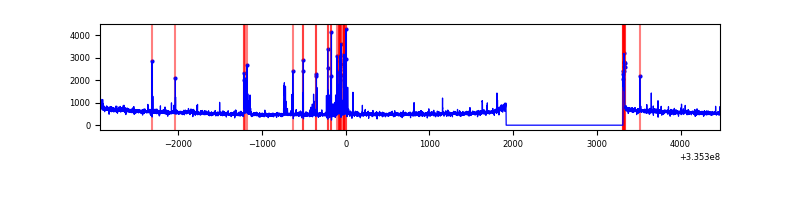 |
| D | 7404 | 6010 | 382 | 382 | 5.16% | 6.36% | 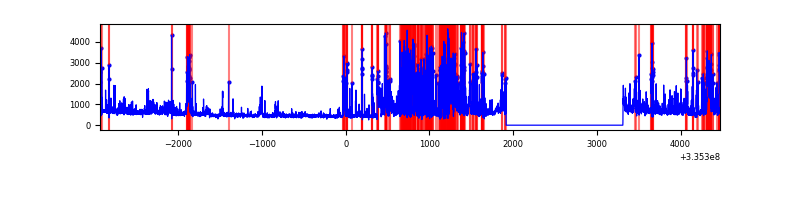 |
Top three noisy pixels from each quadrant. If the there are fewer than three noisy pixels in the level2.evt file, extra rows are filled as -1
| Pixel properties | Quadrant properties | ||||||
|---|---|---|---|---|---|---|---|
| Quadrant | DetID | PixID | Counts | Sigma | Mean | Median | Sigma |
| A | 15 | 192 | 13690 | 81.58 | 796 | 782 | 158.2 |
| A | 13 | 254 | 11086 | 65.12 | 796 | 782 | 158.2 |
| A | 0 | 226 | 7011 | 39.37 | 796 | 782 | 158.2 |
| B | 0 | 244 | 67873 | 453.89 | 808 | 787 | 147.8 |
| B | 14 | 207 | 16616 | 107.09 | 808 | 787 | 147.8 |
| B | 12 | 111 | 16321 | 105.1 | 808 | 787 | 147.8 |
| C | 2 | 16 | 249053 | 1380.6 | 779 | 787 | 179.8 |
| C | 14 | 238 | 125146 | 691.56 | 779 | 787 | 179.8 |
| C | 3 | 233 | 67260 | 369.66 | 779 | 787 | 179.8 |
| D | 1 | 52 | 1469998 | 8260.59 | 754 | 736 | 177.9 |
| D | 7 | 80 | 184189 | 1031.42 | 754 | 736 | 177.9 |
| D | 12 | 233 | 163989 | 917.85 | 754 | 736 | 177.9 |
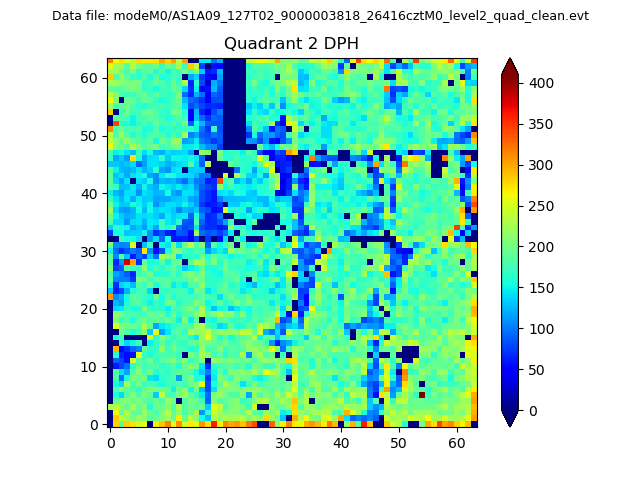
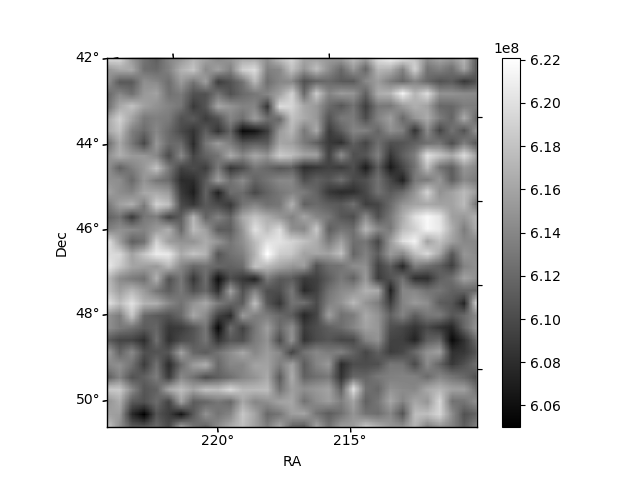
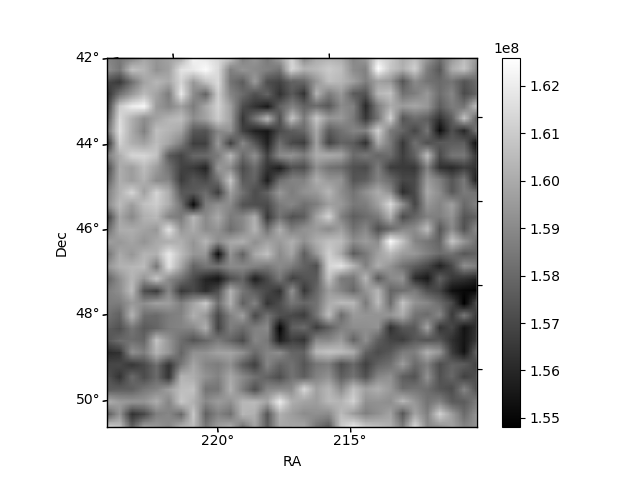
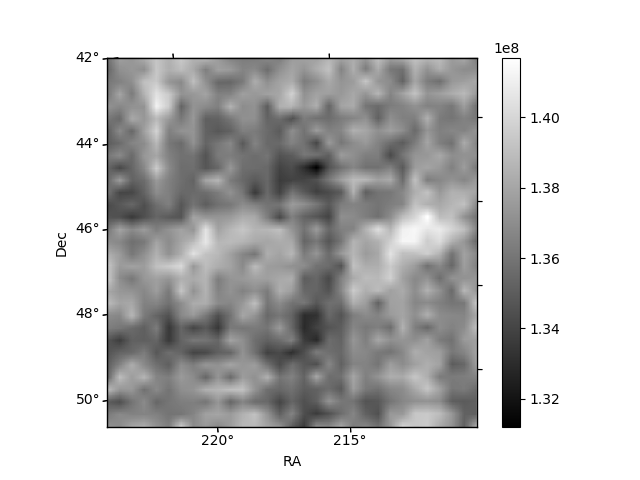
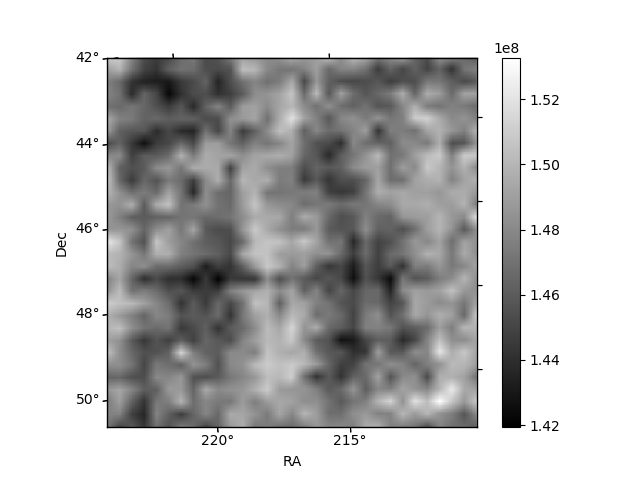
Histogram calculated using DETX and DETY for each event in the final _common_clean file
| Quadrant A | 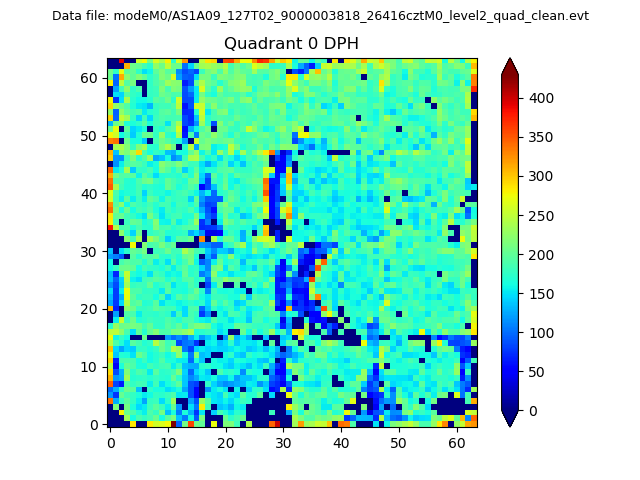 |
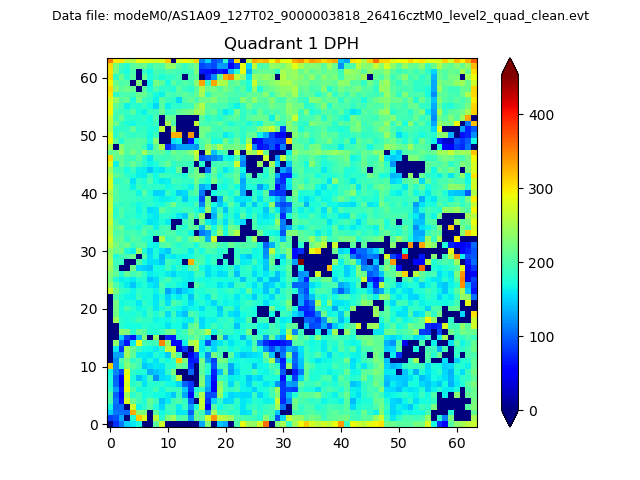 |
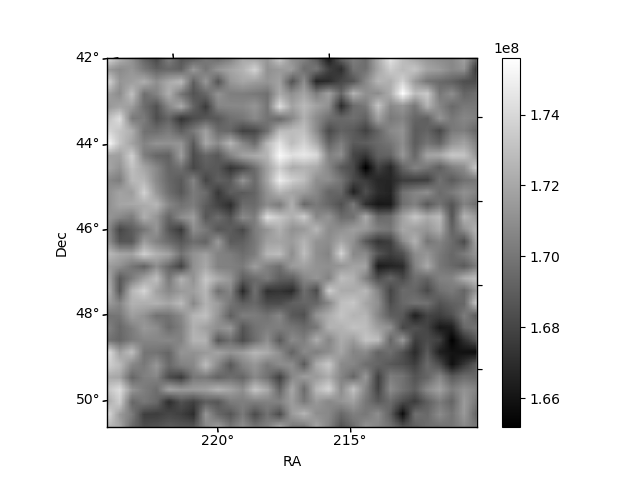
Quadrant B |
|---|---|---|---|
| Quadrant D | 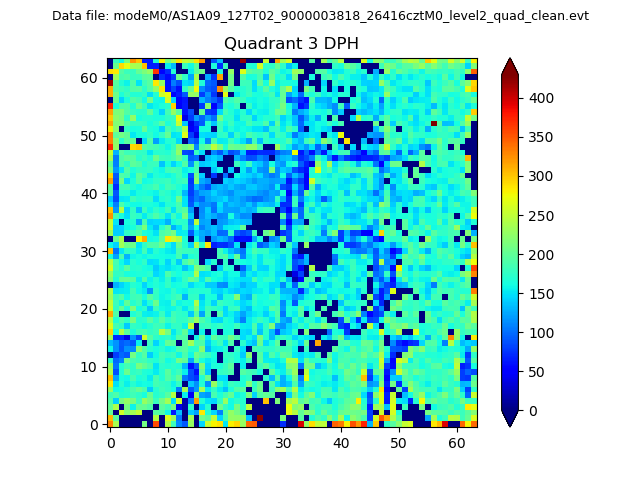 |
 |
Quadrant C |
| Plot type | Count rate plots | Images |
|---|---|---|
| Comparison with Poisson distribution Blue bars denote a histogram of data divided into 1 sec bins. Red curve is a Poisson curve with rate = median count rate of data. |
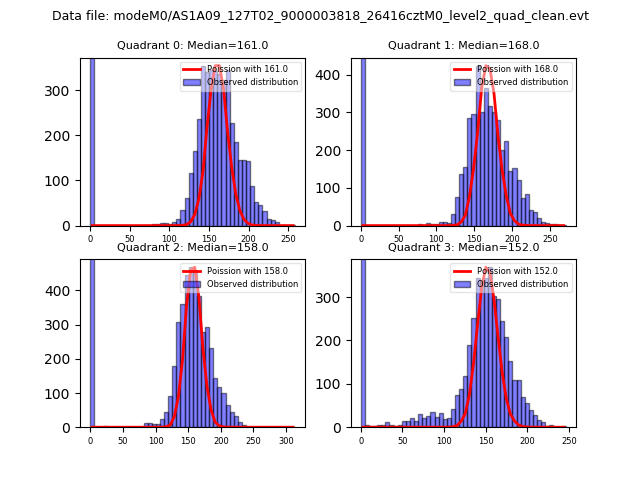 |
 |
| Quadrant-wise count rates Data is divided into 100 sec bins |
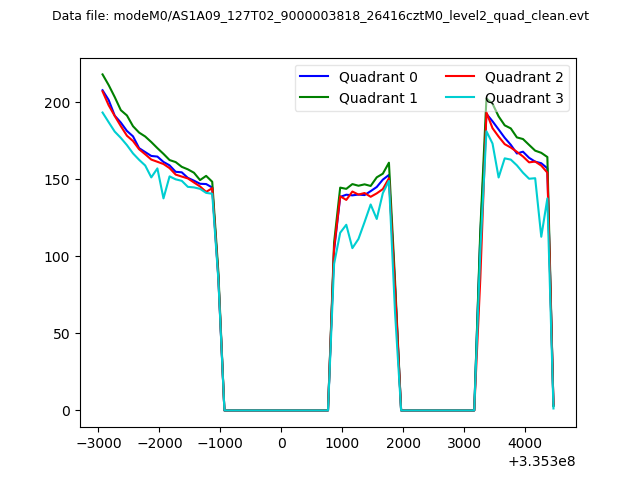 |
|
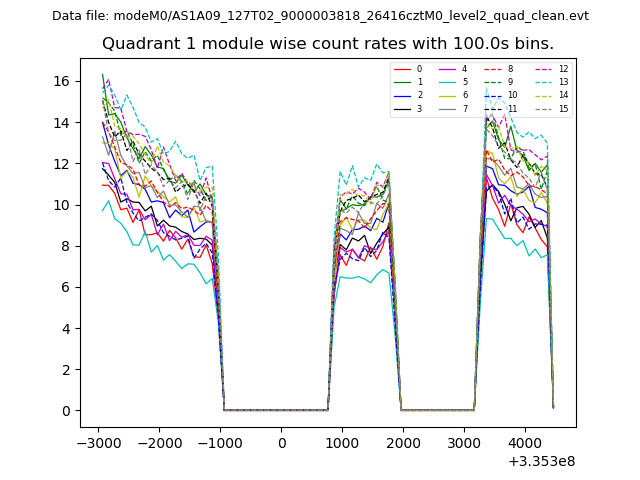
| Module-wise count rates for Quadrant A Data is divided into 100 sec bins |
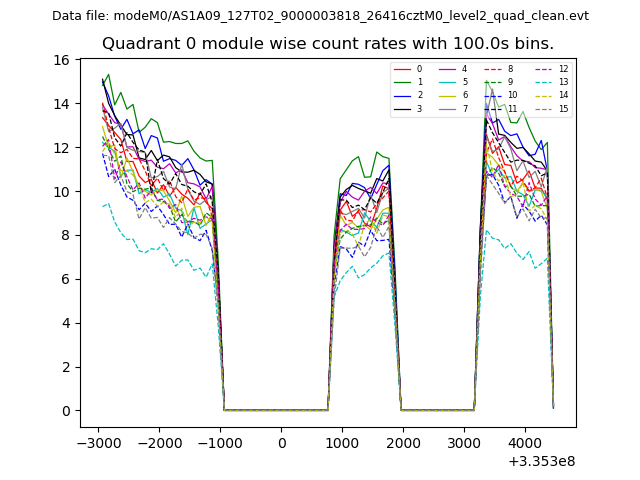 |
 |
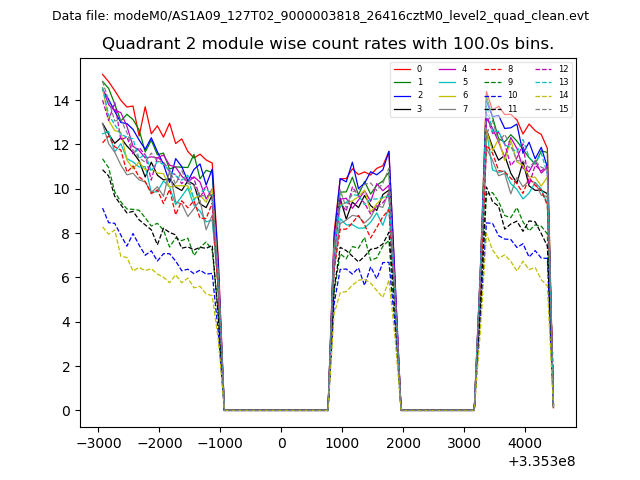
| Module-wise count rates for Quadrant B Data is divided into 100 sec bins |
 |
 |
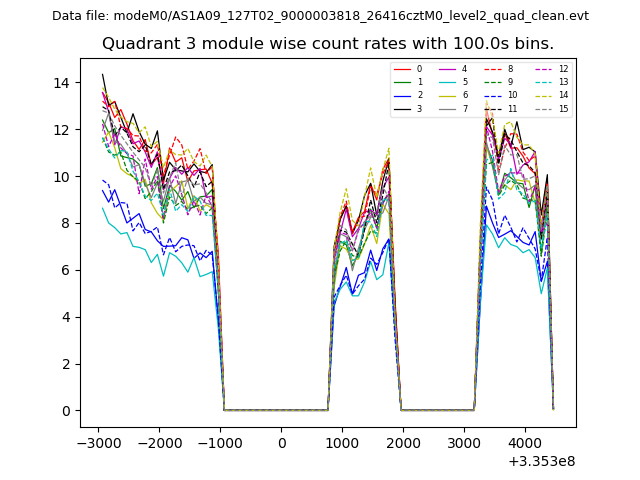
| Module-wise count rates for Quadrant C Data is divided into 100 sec bins |
 |
 |
| Module-wise count rates for Quadrant D Data is divided into 100 sec bins |
 |
 |
| Parameter | Plot |
|---|---|
| CZT HV Monitor | 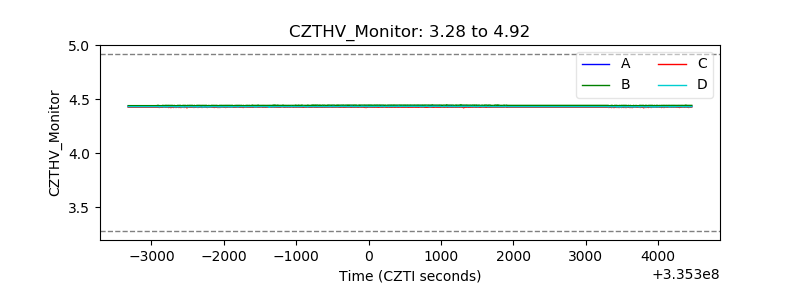 |
| D_VDD | 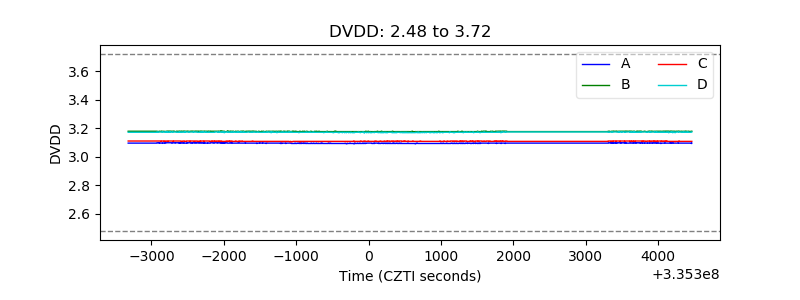 |
| Temperature 1 | 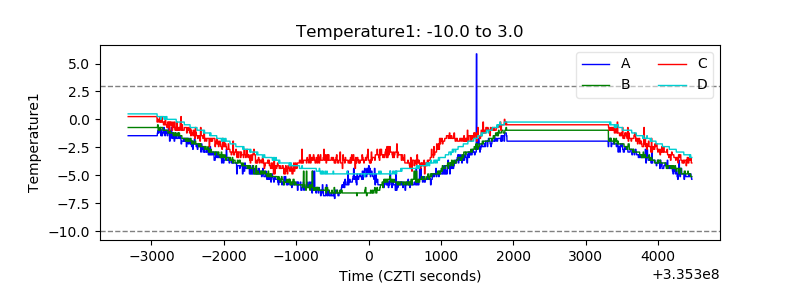 |
| Veto HV Monitor | 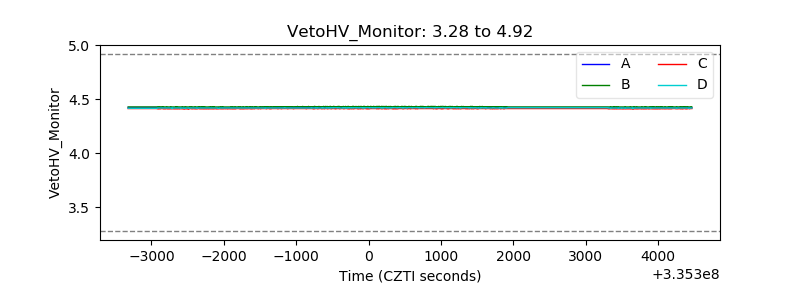 |
| Veto LLD | 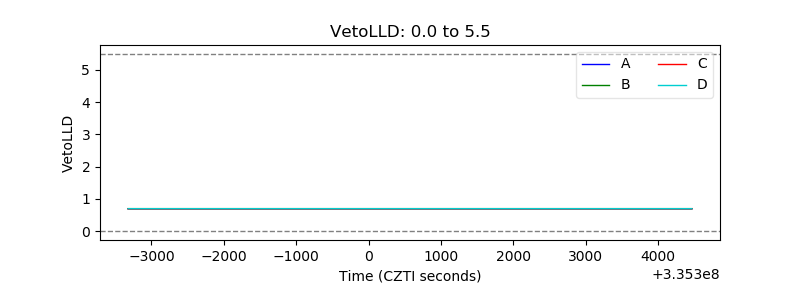 |
| Alpha Counter | 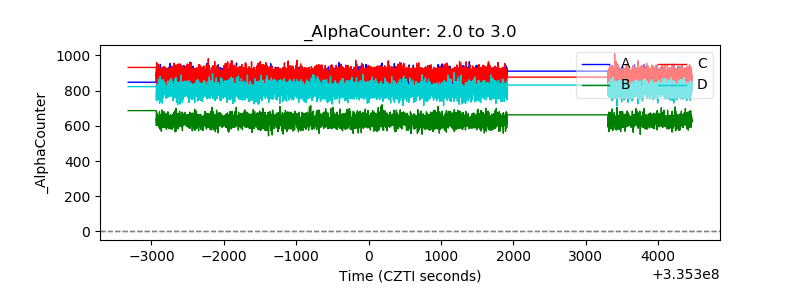 |
| _CPM_Rate | 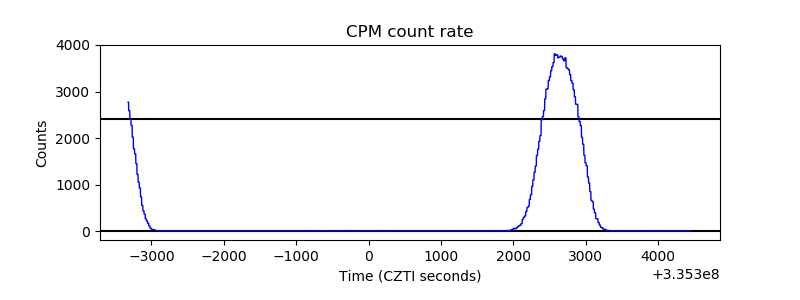 |
| CZT Counter | 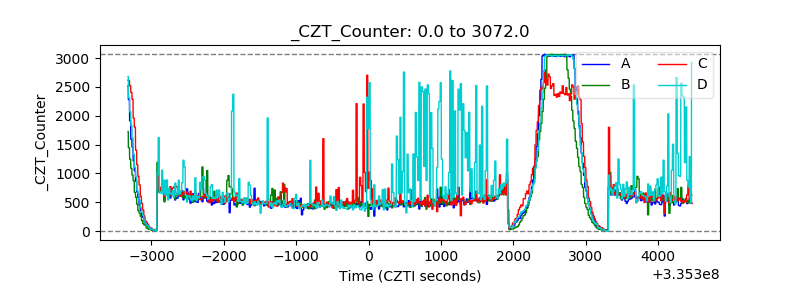 |
| +2.5 Volts monitor |  |
| +5 Volts monitor |  |
| _ROLL_ROT | 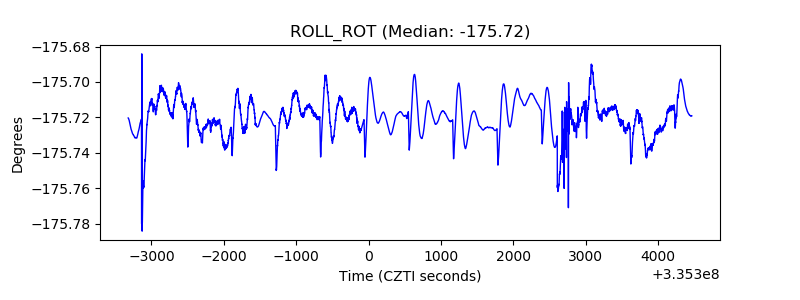 |
| _Roll_DEC | 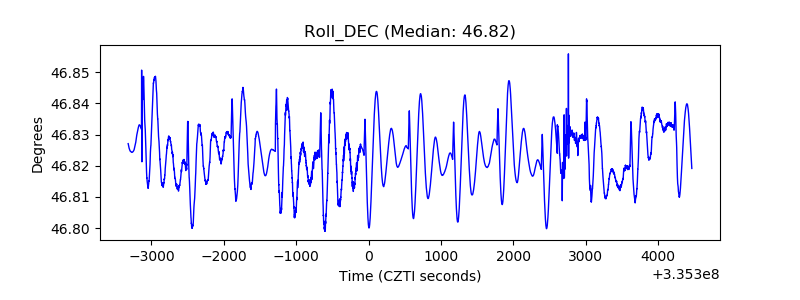 |
| _Roll_RA | 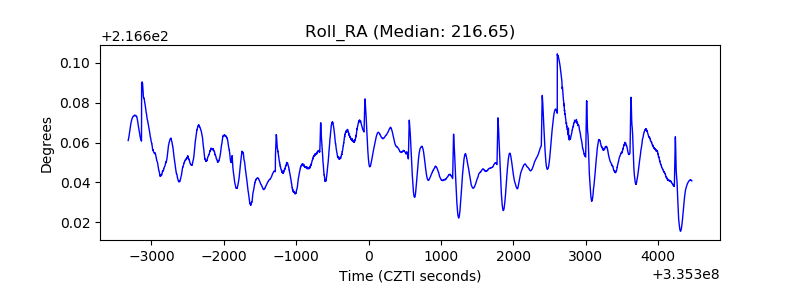 |
| Veto Counter | 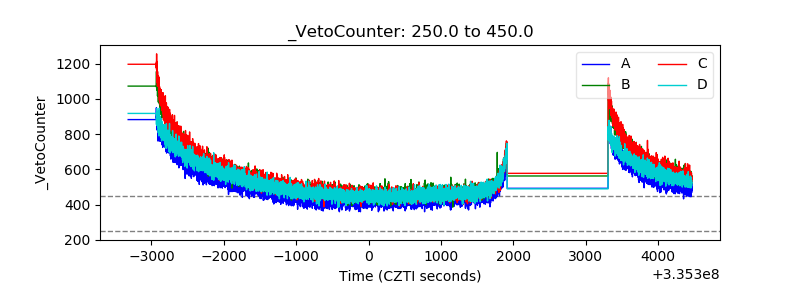 |