| Param | Original file | Final file |
|---|---|---|
| Filename | modeM0/AS1A09_127T02_9000003818_26417cztM0_level2.evt | modeM0/AS1A09_127T02_9000003818_26417cztM0_level2_quad_clean.evt |
| Size (bytes) | 106,937,280 | 28,915,200 |
| Size | 102.0 MB | 27.6 MB |
| Events in quadrant A | 642,072 | 200,890 |
| Events in quadrant B | 714,524 | 211,130 |
| Events in quadrant C | 724,992 | 195,521 |
| Events in quadrant D | 1,075,676 | 180,124 |
| Mode M9 | |||
|---|---|---|---|
| Quadrant | BADHDUFLAG | Total packets | Discarded packets |
| A | 0 | 6 | 0 |
| B | 0 | 7 | 0 |
| C | 0 | 7 | 0 |
| D | 0 | 7 | 0 |
| Mode M0 | |||
|---|---|---|---|
| Quadrant | BADHDUFLAG | Total packets | Discarded packets |
| A | 0 | 2610 | 0 |
| B | 0 | 2879 | 0 |
| C | 0 | 2939 | 0 |
| D | 0 | 4046 | 0 |
| Quadrant | Total seconds | Saturated seconds | Saturation percentage |
|---|---|---|---|
| A | 1159 | 2 | 0.172563% |
| B | 1159 | 3 | 0.258844% |
| C | 1159 | 40 | 3.451251% |
| D | 1159 | 99 | 8.541846% |
Noise dominated data is calculated using 1-second bins in cleaned event files. If a bin has >2000 counts, and if more than 50% of those come from <1% of pixels, then it is considered to be noise-dominated and hence unusable.
| Quadrant | # 1 sec bins | Bins with >0 counts | Bins with >2000 counts | High rate bins dominated by noise | Noise dominated (total time) | Noise dominated (detector-on time) | Marked lightcurve |
|---|---|---|---|---|---|---|---|
| A | 1159 | 1159 | 0 | 0 | 0.00% | 0.00% | 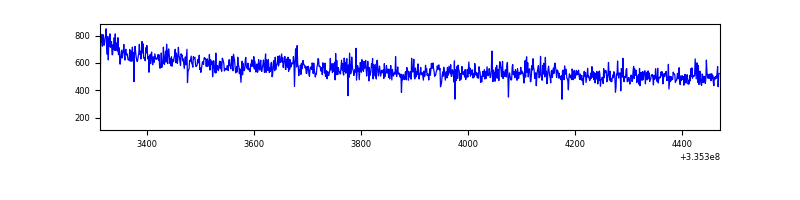 |
| B | 1159 | 1159 | 1 | 1 | 0.09% | 0.09% | 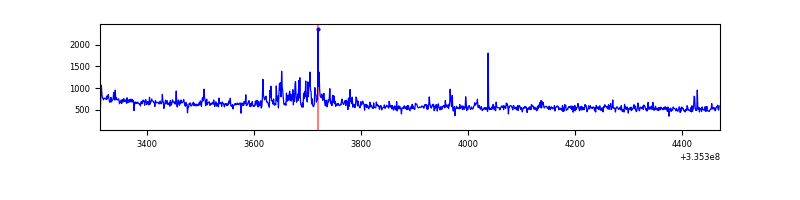 |
| C | 1159 | 1159 | 13 | 13 | 1.12% | 1.12% | 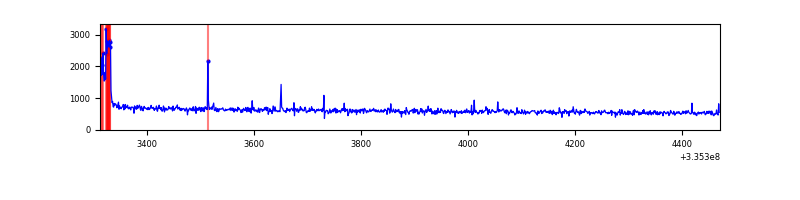 |
| D | 1159 | 1159 | 79 | 79 | 6.82% | 6.82% | 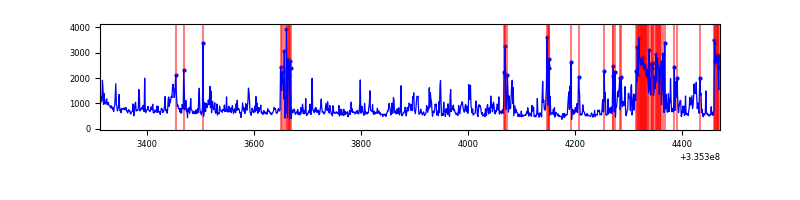 |
Top three noisy pixels from each quadrant. If the there are fewer than three noisy pixels in the level2.evt file, extra rows are filled as -1
| Pixel properties | Quadrant properties | ||||||
|---|---|---|---|---|---|---|---|
| Quadrant | DetID | PixID | Counts | Sigma | Mean | Median | Sigma |
| A | 13 | 254 | 2237 | 59.87 | 165 | 162 | 34.7 |
| A | 15 | 192 | 2028 | 53.84 | 165 | 162 | 34.7 |
| A | 0 | 226 | 1444 | 36.99 | 165 | 162 | 34.7 |
| B | 0 | 244 | 32330 | 990.03 | 170 | 167 | 32.5 |
| B | 4 | 52 | 4873 | 144.86 | 170 | 167 | 32.5 |
| B | 0 | 219 | 3391 | 99.24 | 170 | 167 | 32.5 |
| C | 14 | 238 | 25995 | 655.87 | 163 | 165 | 39.4 |
| C | 0 | 207 | 25890 | 653.21 | 163 | 165 | 39.4 |
| C | 0 | 10 | 16448 | 413.46 | 163 | 165 | 39.4 |
| D | 1 | 52 | 298496 | 7813.01 | 156 | 152 | 38.2 |
| D | 12 | 233 | 75928 | 1984.42 | 156 | 152 | 38.2 |
| D | 12 | 227 | 64885 | 1695.22 | 156 | 152 | 38.2 |
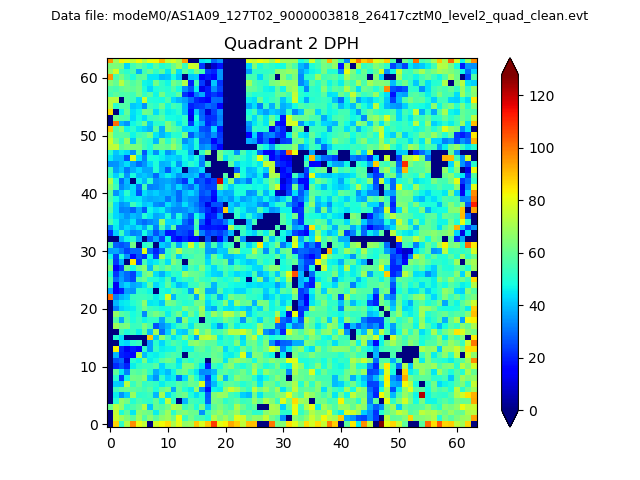
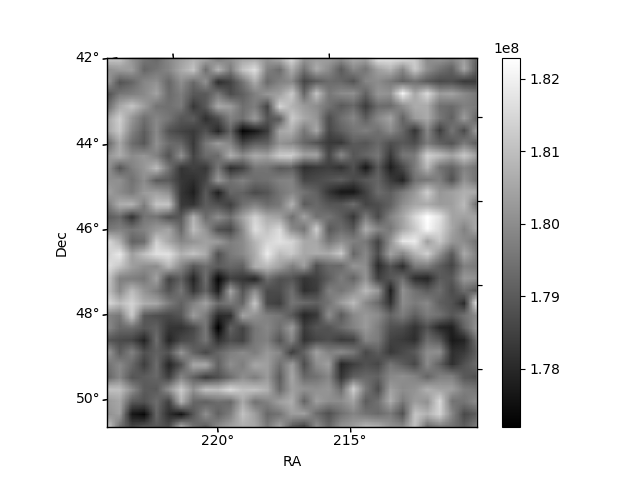
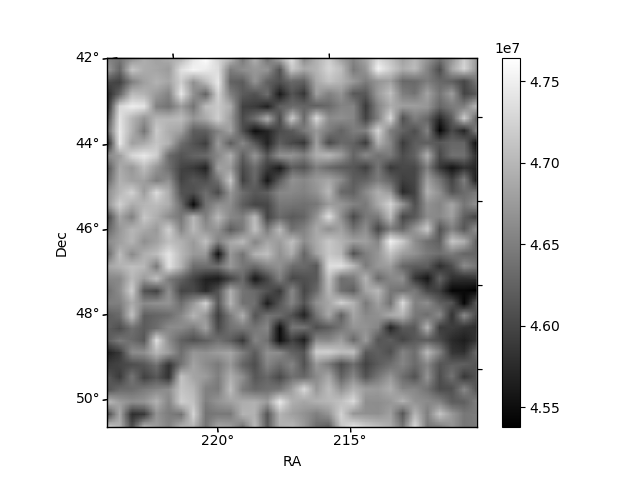
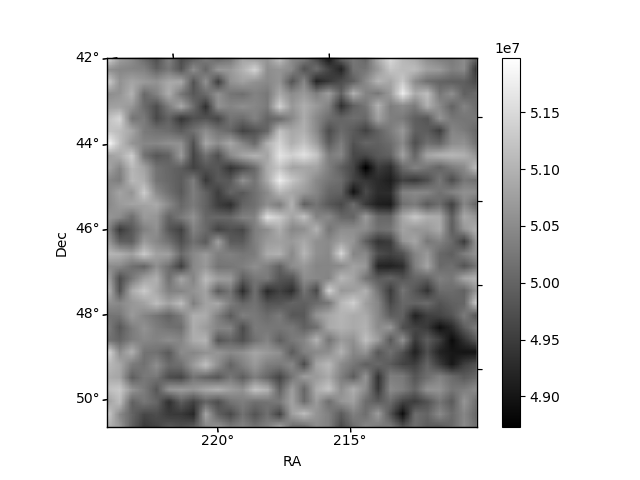
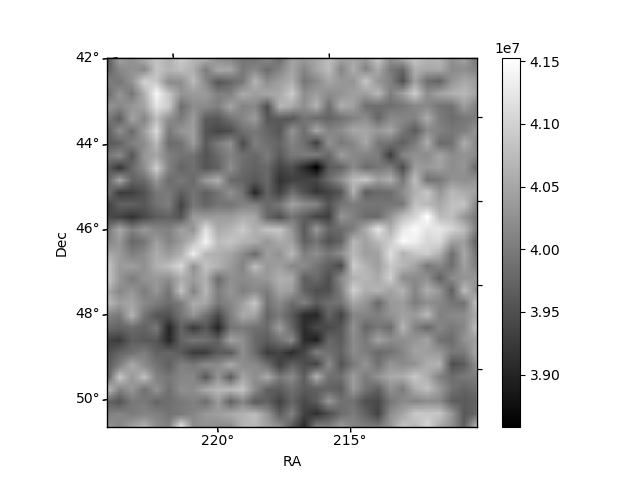
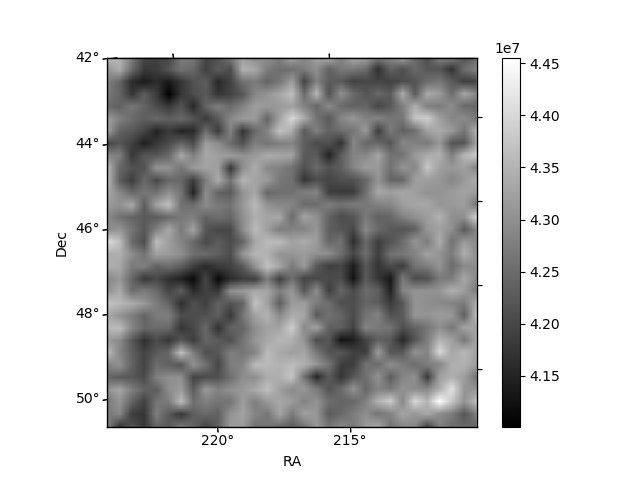
Histogram calculated using DETX and DETY for each event in the final _common_clean file
| Quadrant A | 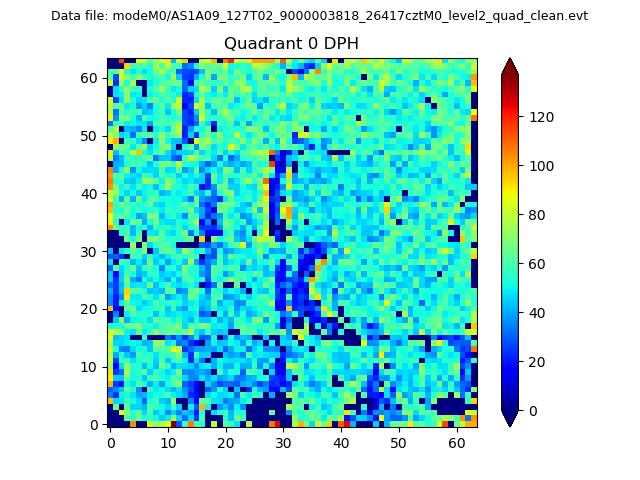 |
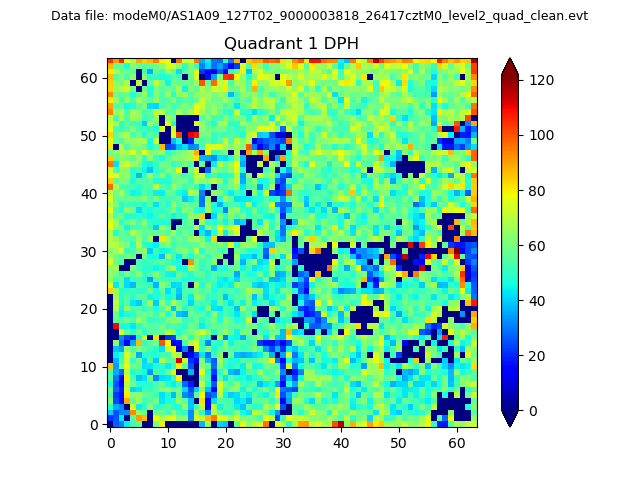 |
Quadrant B |
|---|---|---|---|
| Quadrant D | 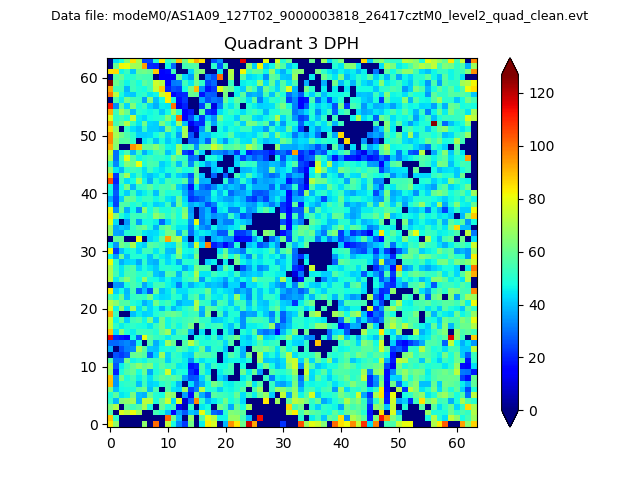 |
 |
Quadrant C |
| Plot type | Count rate plots | Images |
|---|---|---|
| Comparison with Poisson distribution Blue bars denote a histogram of data divided into 1 sec bins. Red curve is a Poisson curve with rate = median count rate of data. |
 |
 |
| Quadrant-wise count rates Data is divided into 100 sec bins |
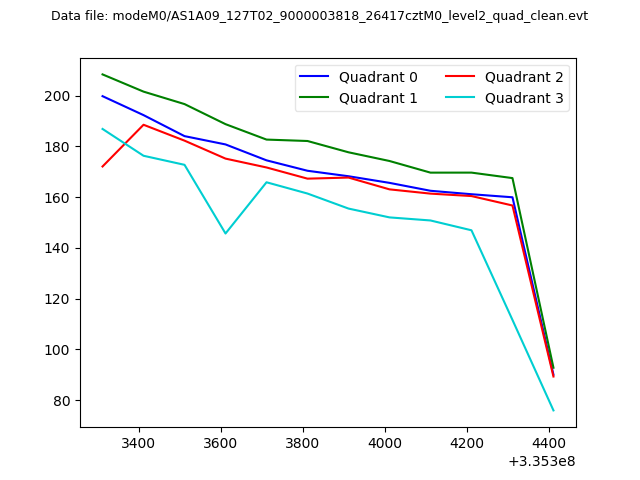 |
|
| Module-wise count rates for Quadrant A Data is divided into 100 sec bins |
 |
 |
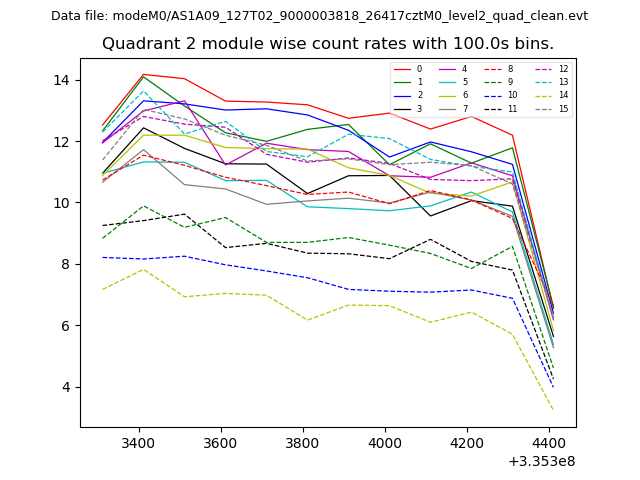
| Module-wise count rates for Quadrant B Data is divided into 100 sec bins |
 |
 |
| Module-wise count rates for Quadrant C Data is divided into 100 sec bins |
 |
 |
| Module-wise count rates for Quadrant D Data is divided into 100 sec bins |
 |
 |
| Parameter | Plot |
|---|---|
| CZT HV Monitor | 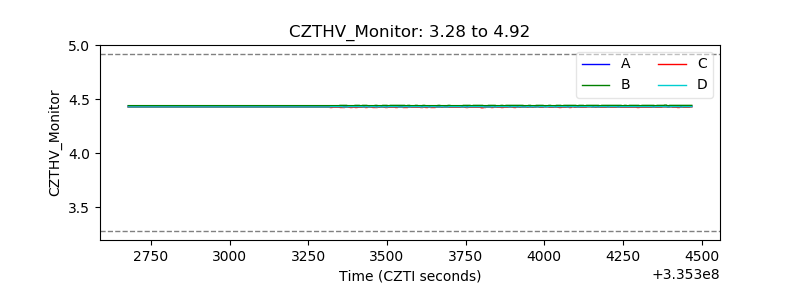 |
| D_VDD | 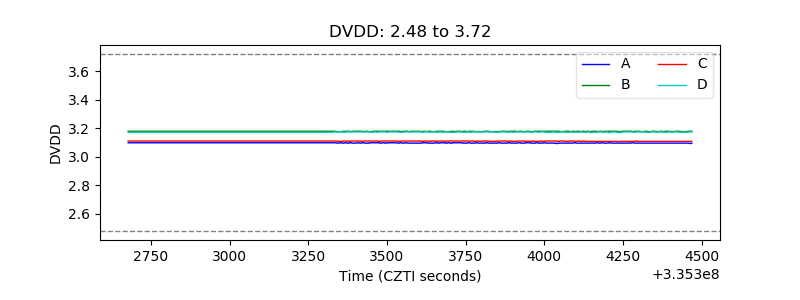 |
| Temperature 1 | 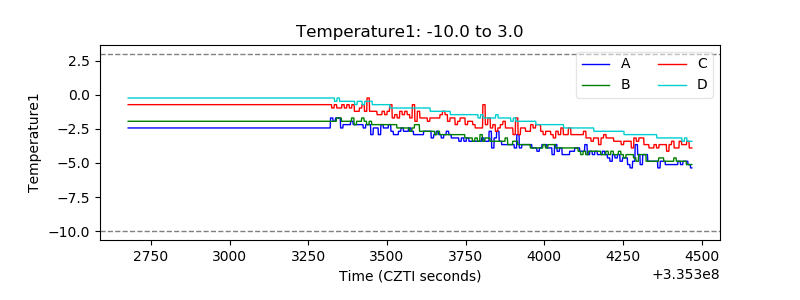 |
| Veto HV Monitor | 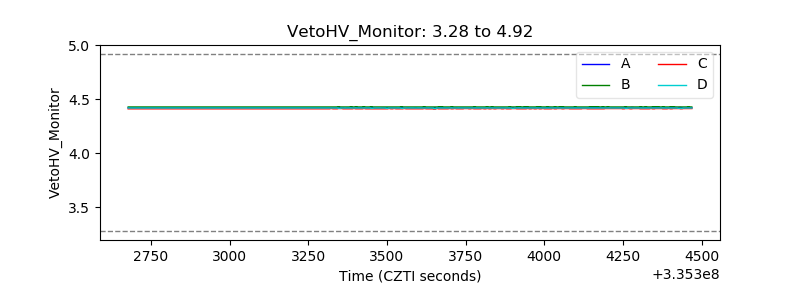 |
| Veto LLD | 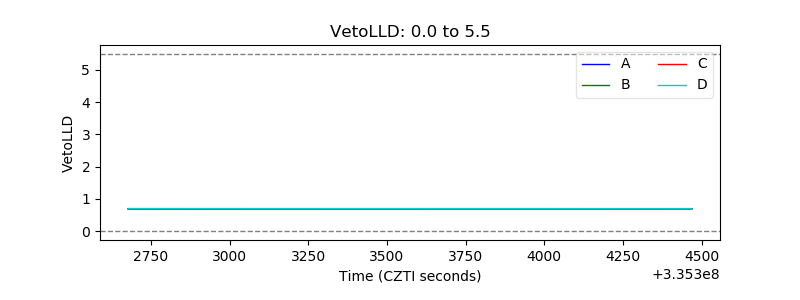 |
| Alpha Counter | 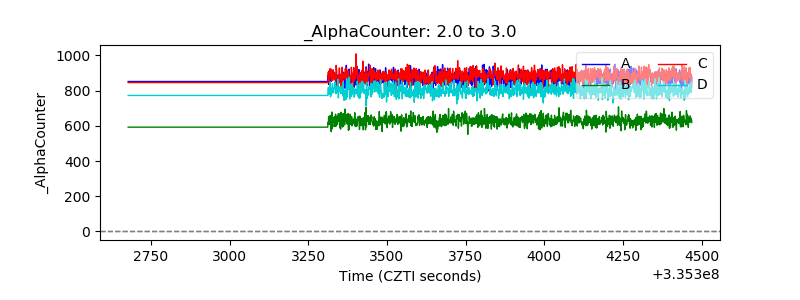 |
| _CPM_Rate | 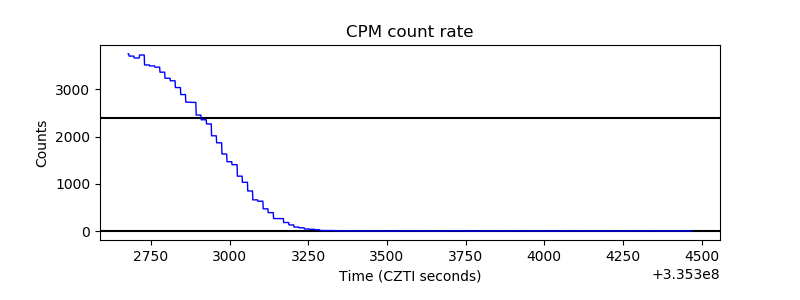 |
| CZT Counter | 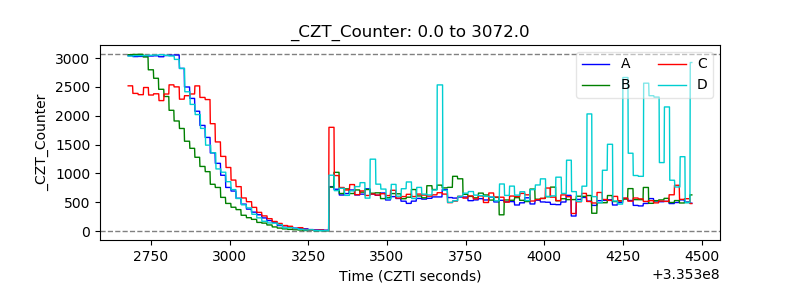 |
| +2.5 Volts monitor |  |
| +5 Volts monitor | 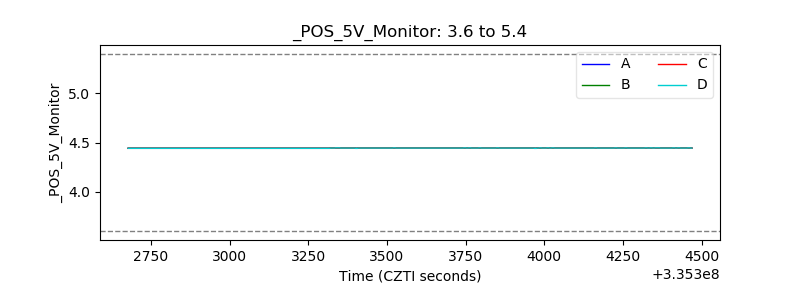 |
| _ROLL_ROT | 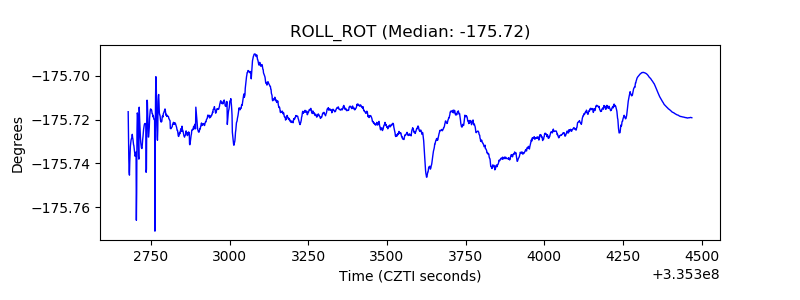 |
| _Roll_DEC | 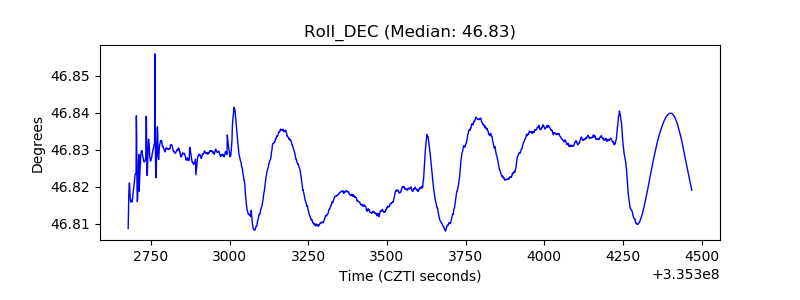 |
| _Roll_RA | 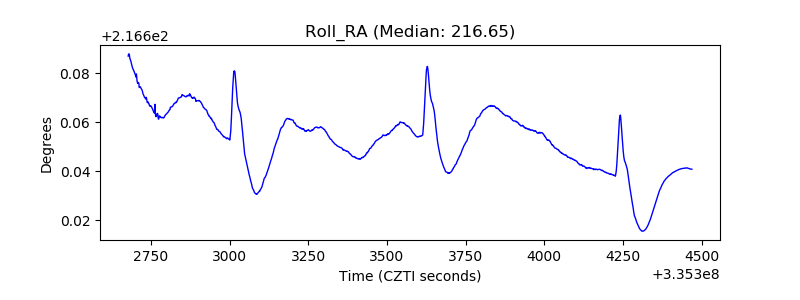 |
| Veto Counter |  |