| Param | Original file | Final file |
|---|---|---|
| Filename | modeM0/AS1A09_127T03_9000003820cztM0_level2.fits | modeM0/AS1A09_127T03_9000003820cztM0_level2_quad_clean.evt |
| Size (bytes) | 586,860,480 | 551,243,520 |
| Size | 559.7 MB | 525.7 MB |
| Events in quadrant A | 3,631,510 | 3,319,338 |
| Events in quadrant B | 3,469,718 | 3,315,885 |
| Events in quadrant C | 3,514,034 | 3,104,544 |
| Events in quadrant D | 2,979,210 | 2,777,069 |
| Mode SS | |||
|---|---|---|---|
| Quadrant | BADHDUFLAG | Total packets | Discarded packets |
| A | 0 | 1240 | 0 |
| B | 0 | 1240 | 0 |
| C | 0 | 1240 | 0 |
| D | 0 | 1240 | 0 |
| Mode M0 | |||
|---|---|---|---|
| Quadrant | BADHDUFLAG | Total packets | Discarded packets |
| A | 0 | 125925 | 0 |
| B | 0 | 130566 | 0 |
| C | 0 | 139371 | 0 |
| D | 0 | 180051 | 0 |
| Mode M9 | |||
|---|---|---|---|
| Quadrant | BADHDUFLAG | Total packets | Discarded packets |
| A | 0 | 87 | 0 |
| B | 0 | 87 | 0 |
| C | 0 | 87 | 0 |
| D | 0 | 87 | 0 |
| Quadrant | Total seconds | Saturated seconds | Saturation percentage |
|---|---|---|---|
| A | 60894 | 625 | 1.026374% |
| B | 60894 | 946 | 1.553519% |
| C | 60894 | 1656 | 2.719480% |
| D | 60894 | 3940 | 6.470260% |
Noise dominated data is calculated using 1-second bins in cleaned event files. If a bin has >2000 counts, and if more than 50% of those come from <1% of pixels, then it is considered to be noise-dominated and hence unusable.
| Quadrant | # 1 sec bins | Bins with >0 counts | Bins with >2000 counts | High rate bins dominated by noise | Noise dominated (total time) | Noise dominated (detector-on time) | Marked lightcurve |
|---|---|---|---|---|---|---|---|
| A | 69644 | 60891 | 0 | 0 | 0.00% | 0.00% |  |
| B | 69644 | 60882 | 0 | 0 | 0.00% | 0.00% | 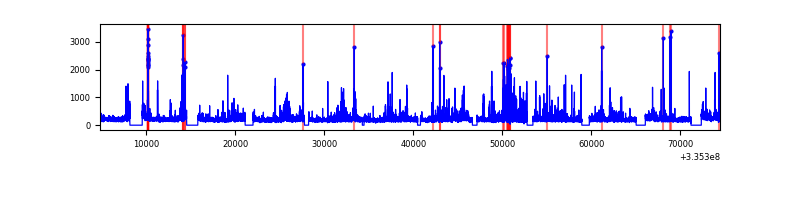 |
| C | 69644 | 60892 | 0 | 0 | 0.00% | 0.00% |  |
| D | 69644 | 60831 | 0 | 0 | 0.00% | 0.00% |  |
Top three noisy pixels from each quadrant. If the there are fewer than three noisy pixels in the level2.evt file, extra rows are filled as -1
| Pixel properties | Quadrant properties | ||||||
|---|---|---|---|---|---|---|---|
| Quadrant | DetID | PixID | Counts | Sigma | Mean | Median | Sigma |
| A | 0 | 29 | 3100 | 9.5 | 946 | 889 | 232.8 |
| A | 7 | 110 | 2904 | 8.66 | 946 | 889 | 232.8 |
| A | 9 | 19 | 2711 | 7.83 | 946 | 889 | 232.8 |
| B | 2 | 9 | 2756 | 10.51 | 919 | 879 | 178.6 |
| B | 2 | 8 | 2285 | 7.87 | 919 | 879 | 178.6 |
| B | 3 | 17 | 2275 | 7.82 | 919 | 879 | 178.6 |
| C | 1 | 81 | 2844 | 8.37 | 927 | 869 | 236.0 |
| C | 1 | 80 | 2798 | 8.17 | 927 | 869 | 236.0 |
| C | 12 | 241 | 2497 | 6.9 | 927 | 869 | 236.0 |
| D | 15 | 46 | 2163 | 6.16 | 851 | 774 | 225.3 |
| D | 6 | 67 | 2153 | 6.12 | 851 | 774 | 225.3 |
| D | 7 | 3 | 2120 | 5.97 | 851 | 774 | 225.3 |
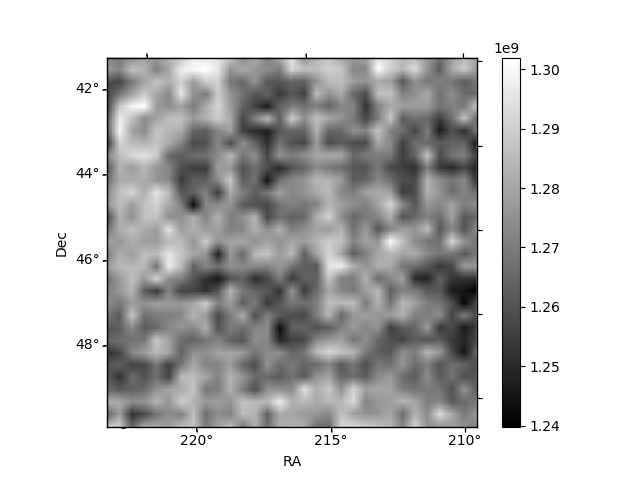
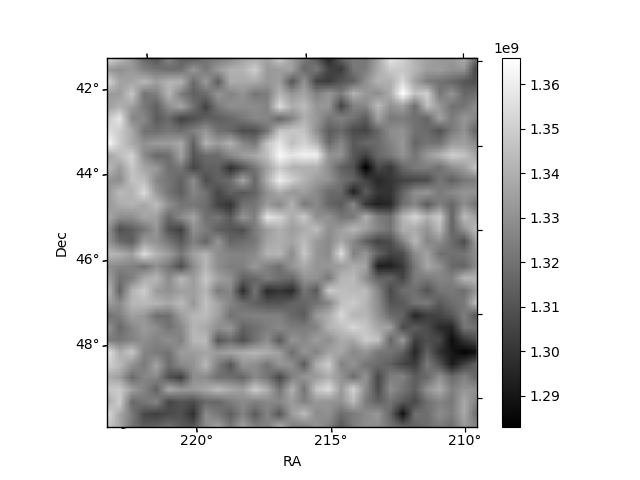
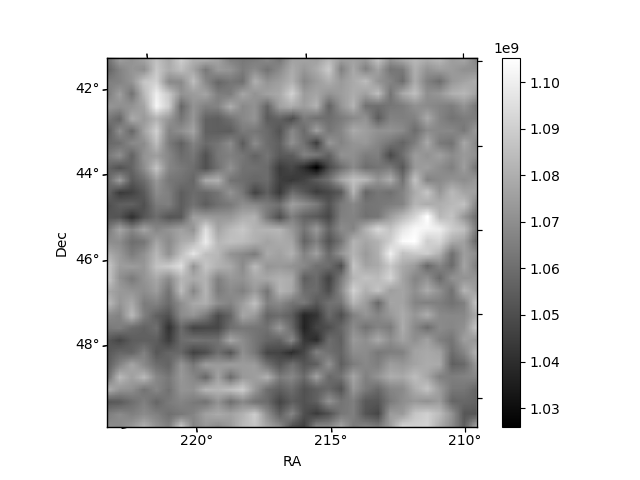
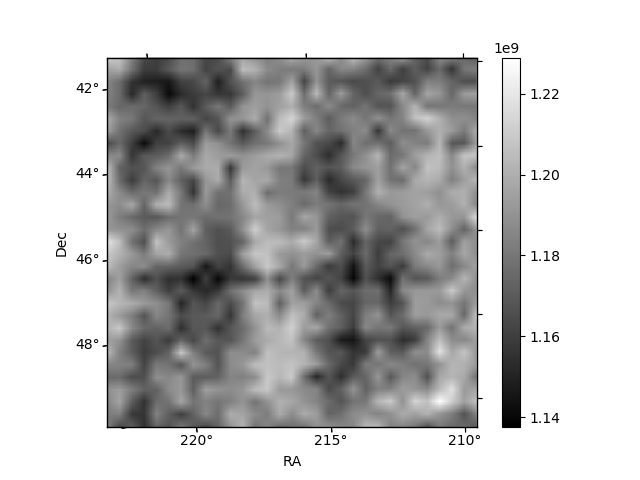
Histogram calculated using DETX and DETY for each event in the final _common_clean file
| Quadrant A |  |
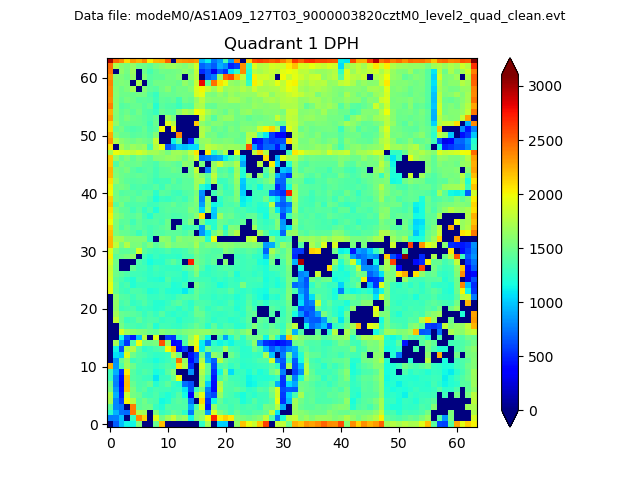 |
Quadrant B |
|---|---|---|---|
| Quadrant D |  |
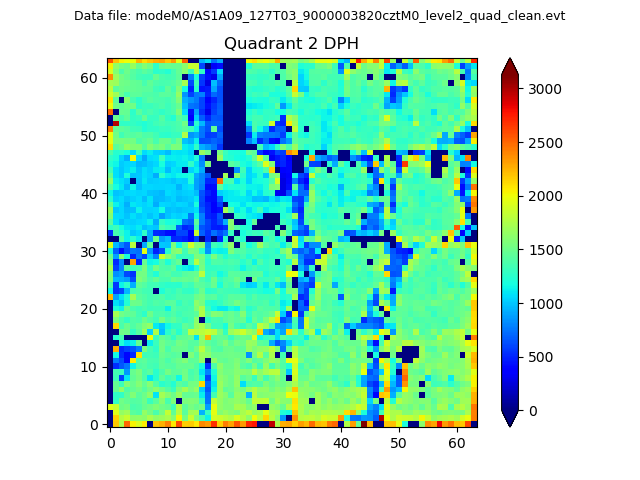 |
Quadrant C |
| Plot type | Count rate plots | Images |
|---|---|---|
| Comparison with Poisson distribution Blue bars denote a histogram of data divided into 1 sec bins. Red curve is a Poisson curve with rate = median count rate of data. |
 |
 |
| Quadrant-wise count rates Data is divided into 100 sec bins |
 |
|
| Module-wise count rates for Quadrant A Data is divided into 100 sec bins |
 |
 |
| Module-wise count rates for Quadrant B Data is divided into 100 sec bins |
 |
 |
| Module-wise count rates for Quadrant C Data is divided into 100 sec bins |
 |
 |
| Module-wise count rates for Quadrant D Data is divided into 100 sec bins |
 |
 |
| Parameter | Plot |
|---|---|
| CZT HV Monitor | 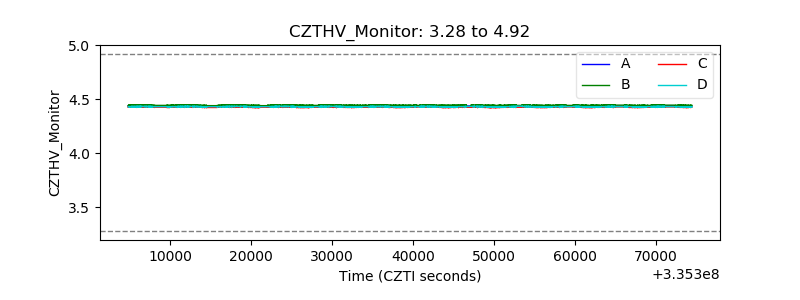 |
| D_VDD | 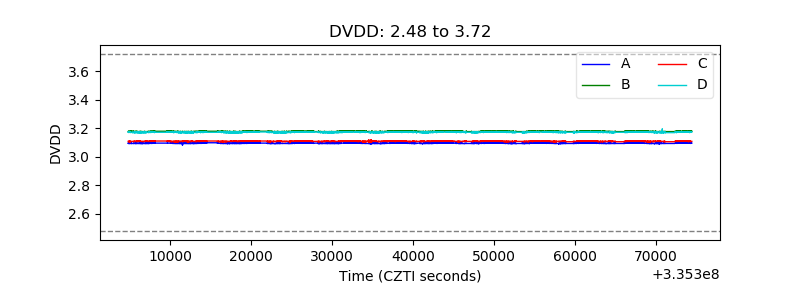 |
| Temperature 1 |  |
| Veto HV Monitor |  |
| Veto LLD |  |
| Alpha Counter |  |
| _CPM_Rate | 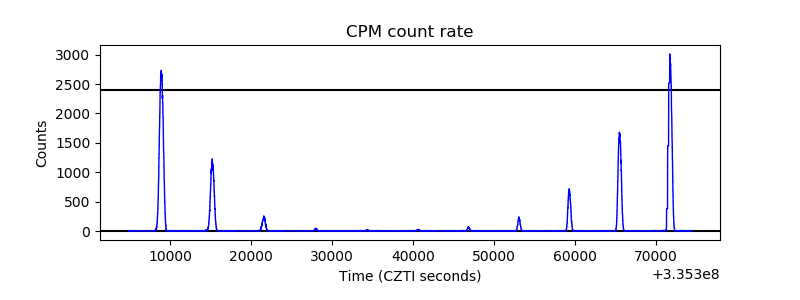 |
| CZT Counter |  |
| +2.5 Volts monitor |  |
| +5 Volts monitor |  |
| _ROLL_ROT |  |
| _Roll_DEC |  |
| _Roll_RA |  |
| Veto Counter |  |