| Param | Original file | Final file |
|---|---|---|
| Filename | modeM0/AS1A09_127T03_9000003820_26417cztM0_level2.evt | modeM0/AS1A09_127T03_9000003820_26417cztM0_level2_quad_clean.evt |
| Size (bytes) | 392,535,360 | 61,793,280 |
| Size | 374.4 MB | 58.9 MB |
| Events in quadrant A | 2,298,615 | 397,533 |
| Events in quadrant B | 2,547,299 | 408,238 |
| Events in quadrant C | 2,658,039 | 384,633 |
| Events in quadrant D | 4,066,892 | 352,826 |
| Mode M0 | |||
|---|---|---|---|
| Quadrant | BADHDUFLAG | Total packets | Discarded packets |
| A | 0 | 9715 | 0 |
| B | 0 | 10300 | 0 |
| C | 0 | 10785 | 0 |
| D | 0 | 15247 | 0 |
| Mode M9 | |||
|---|---|---|---|
| Quadrant | BADHDUFLAG | Total packets | Discarded packets |
| A | 0 | 14 | 0 |
| B | 0 | 14 | 0 |
| C | 0 | 14 | 0 |
| D | 0 | 14 | 0 |
| Quadrant | Total seconds | Saturated seconds | Saturation percentage |
|---|---|---|---|
| A | 4668 | 9 | 0.192802% |
| B | 4668 | 70 | 1.499572% |
| C | 4667 | 119 | 2.549818% |
| D | 4667 | 425 | 9.106492% |
Noise dominated data is calculated using 1-second bins in cleaned event files. If a bin has >2000 counts, and if more than 50% of those come from <1% of pixels, then it is considered to be noise-dominated and hence unusable.
| Quadrant | # 1 sec bins | Bins with >0 counts | Bins with >2000 counts | High rate bins dominated by noise | Noise dominated (total time) | Noise dominated (detector-on time) | Marked lightcurve |
|---|---|---|---|---|---|---|---|
| A | 6058 | 4669 | 0 | 0 | 0.00% | 0.00% | 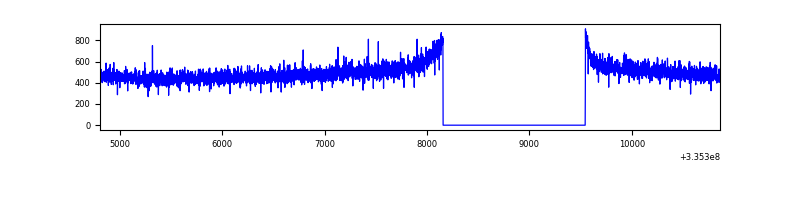 |
| B | 6058 | 4669 | 23 | 23 | 0.38% | 0.49% | 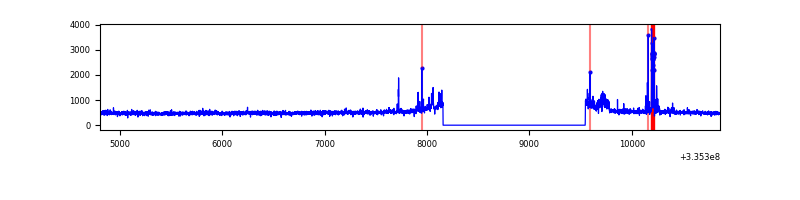 |
| C | 6057 | 4668 | 30 | 30 | 0.50% | 0.64% | 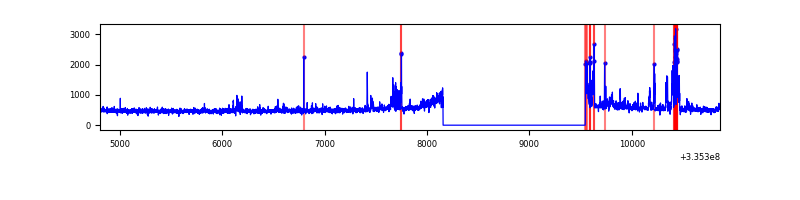 |
| D | 6057 | 4668 | 306 | 306 | 5.05% | 6.56% | 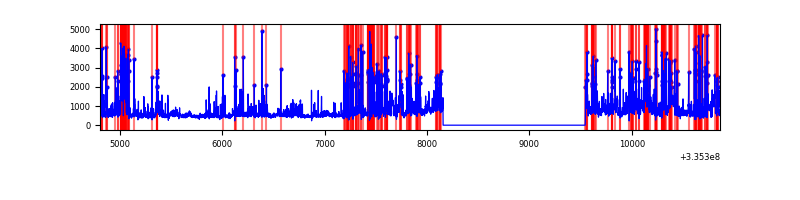 |
Top three noisy pixels from each quadrant. If the there are fewer than three noisy pixels in the level2.evt file, extra rows are filled as -1
| Pixel properties | Quadrant properties | ||||||
|---|---|---|---|---|---|---|---|
| Quadrant | DetID | PixID | Counts | Sigma | Mean | Median | Sigma |
| A | 12 | 189 | 8566 | 67.12 | 594 | 582 | 118.9 |
| A | 13 | 254 | 8155 | 63.67 | 594 | 582 | 118.9 |
| A | 3 | 137 | 5193 | 38.77 | 594 | 582 | 118.9 |
| B | 5 | 172 | 93756 | 840.15 | 597 | 584 | 110.9 |
| B | 0 | 244 | 73470 | 657.23 | 597 | 584 | 110.9 |
| B | 0 | 189 | 22372 | 196.47 | 597 | 584 | 110.9 |
| C | 3 | 233 | 233691 | 1737.41 | 575 | 579 | 134.2 |
| C | 14 | 238 | 94227 | 697.97 | 575 | 579 | 134.2 |
| C | 2 | 16 | 74900 | 553.92 | 575 | 579 | 134.2 |
| D | 1 | 52 | 1268256 | 9563.73 | 553 | 540 | 132.6 |
| D | 7 | 80 | 512304 | 3860.78 | 553 | 540 | 132.6 |
| D | 12 | 233 | 109238 | 820.02 | 553 | 540 | 132.6 |
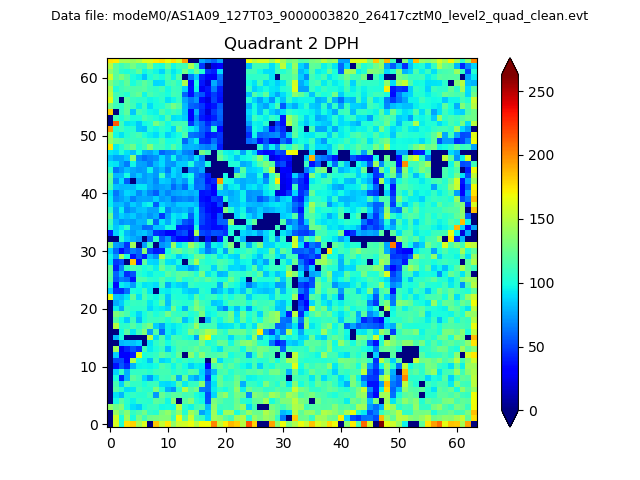
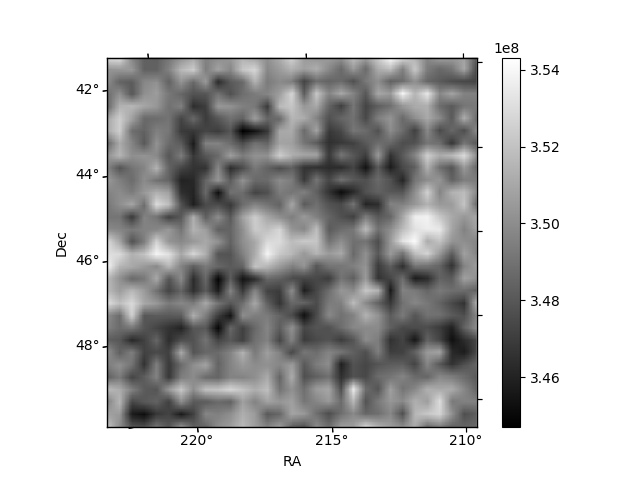
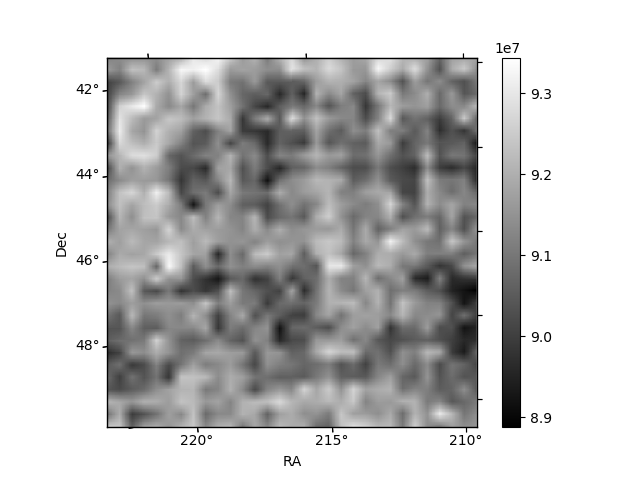
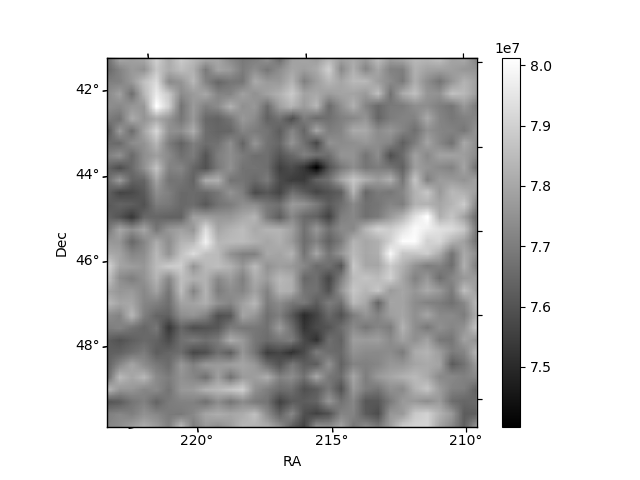
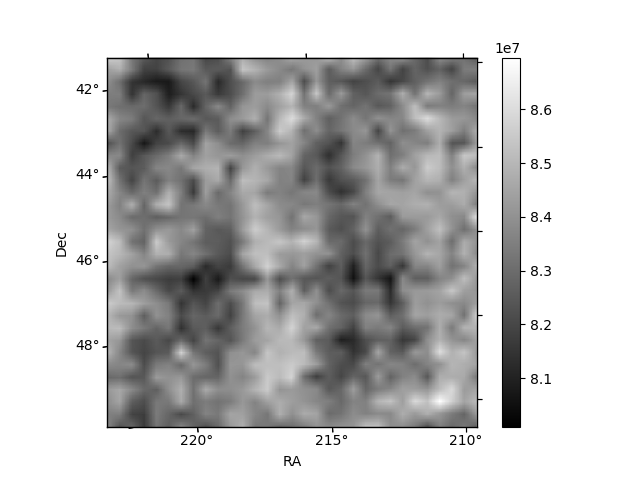
Histogram calculated using DETX and DETY for each event in the final _common_clean file
| Quadrant A | 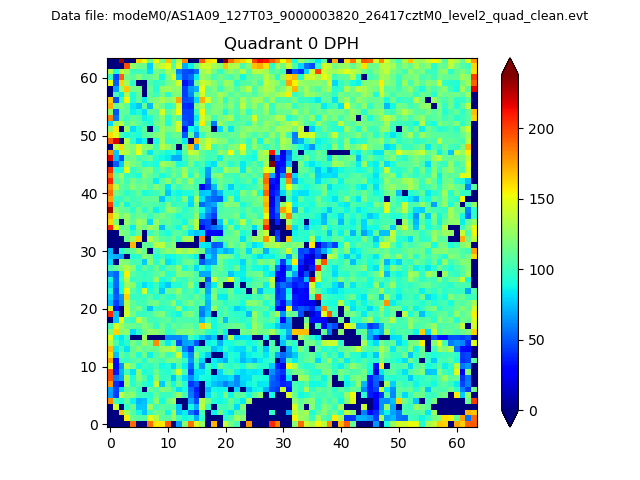 |
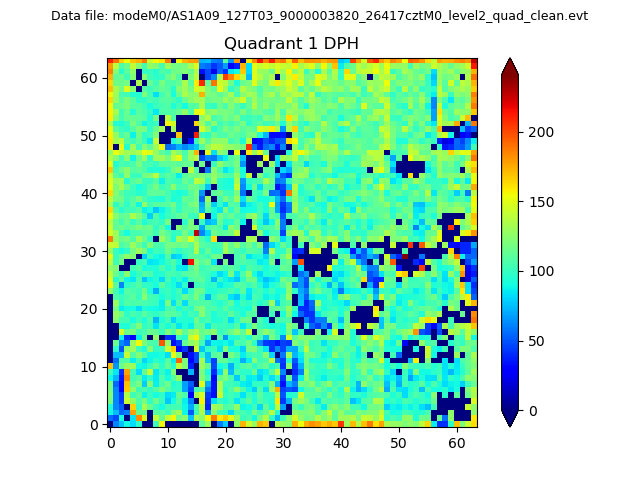 |
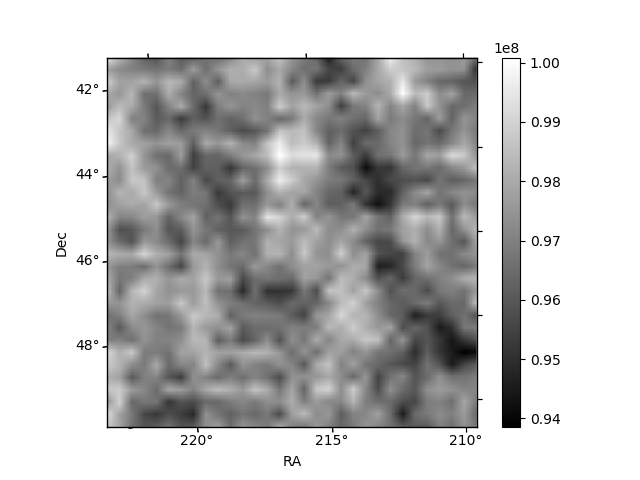
Quadrant B |
|---|---|---|---|
| Quadrant D | 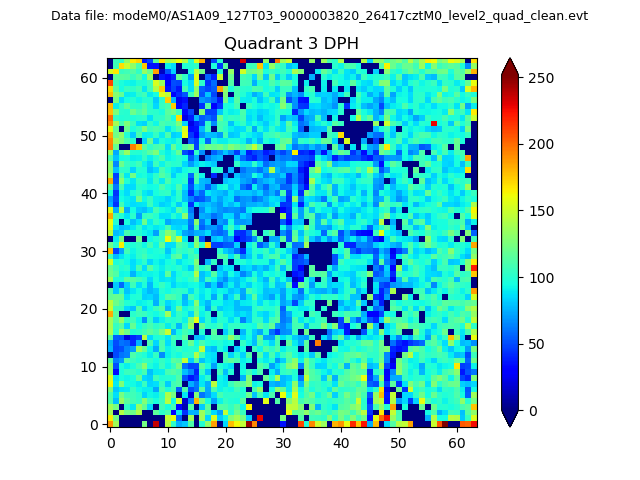 |
 |
Quadrant C |
| Plot type | Count rate plots | Images |
|---|---|---|
| Comparison with Poisson distribution Blue bars denote a histogram of data divided into 1 sec bins. Red curve is a Poisson curve with rate = median count rate of data. |
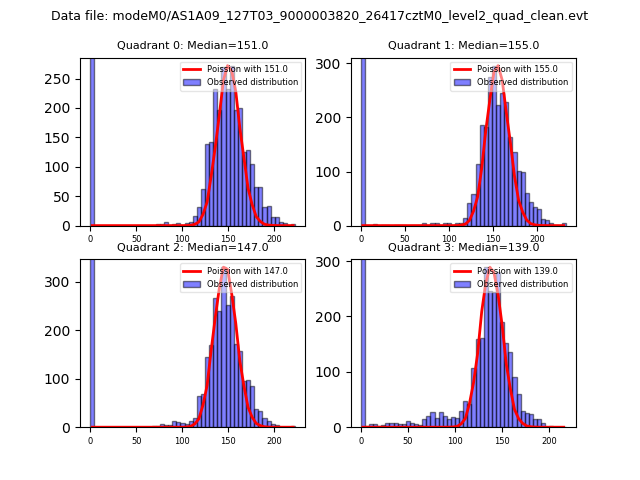 |
 |
| Quadrant-wise count rates Data is divided into 100 sec bins |
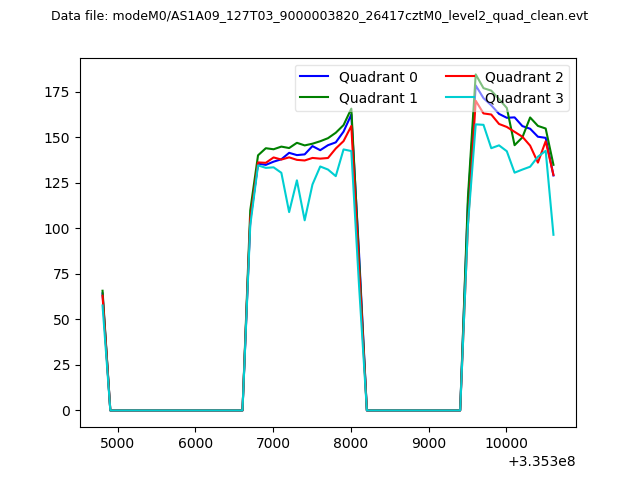 |
|
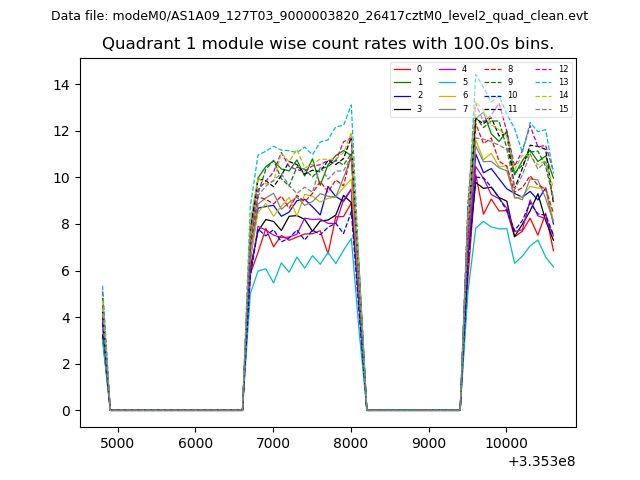
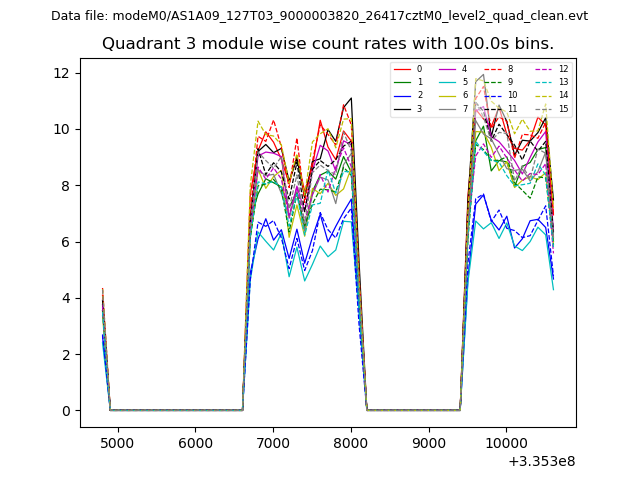
| Module-wise count rates for Quadrant A Data is divided into 100 sec bins |
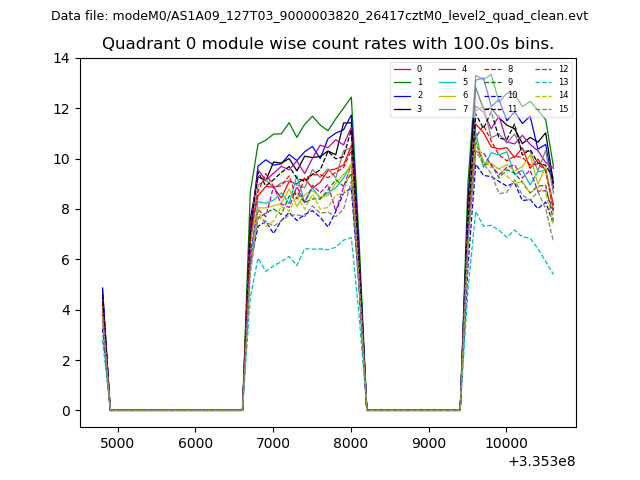 |
 |
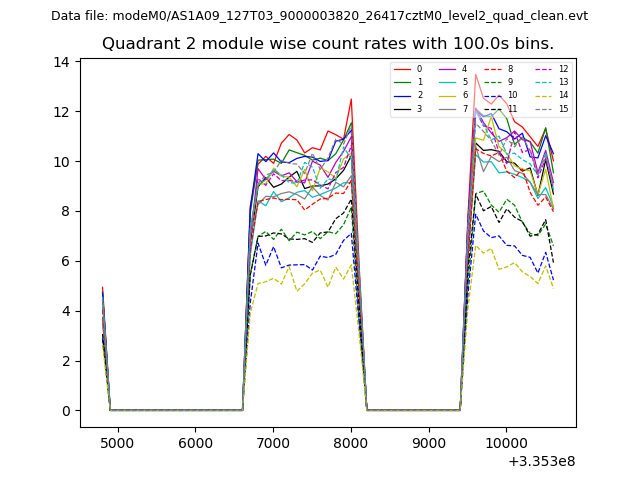
| Module-wise count rates for Quadrant B Data is divided into 100 sec bins |
 |
 |
| Module-wise count rates for Quadrant C Data is divided into 100 sec bins |
 |
 |
| Module-wise count rates for Quadrant D Data is divided into 100 sec bins |
 |
 |
| Parameter | Plot |
|---|---|
| CZT HV Monitor |  |
| D_VDD | 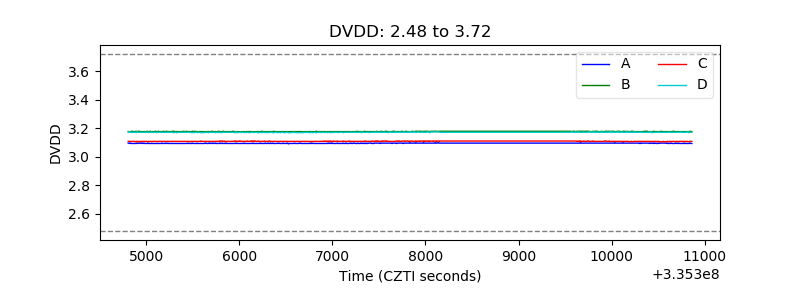 |
| Temperature 1 | 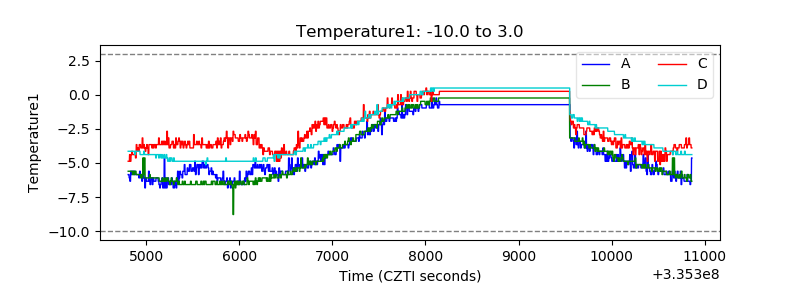 |
| Veto HV Monitor | 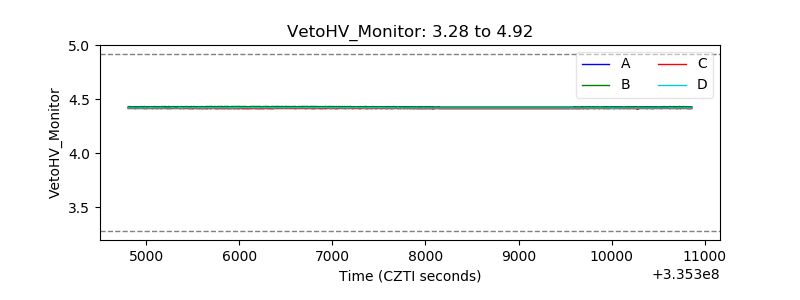 |
| Veto LLD | 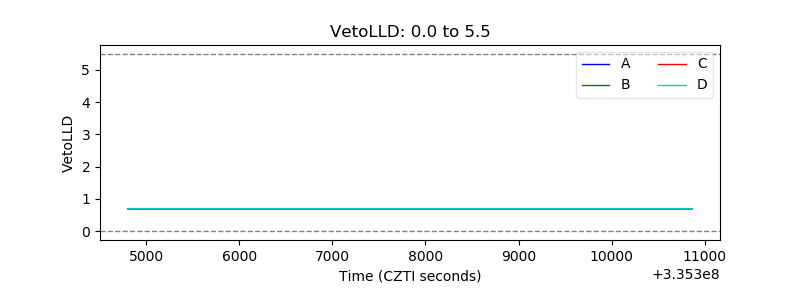 |
| Alpha Counter | 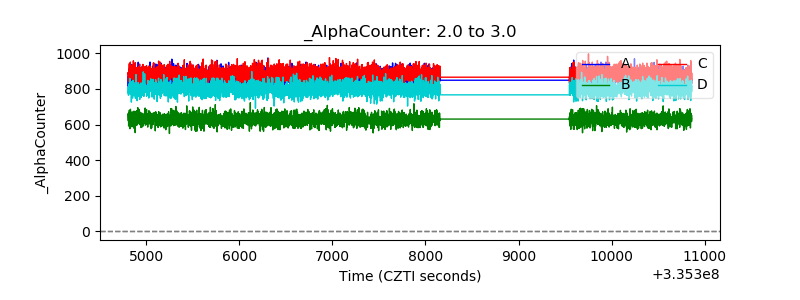 |
| _CPM_Rate | 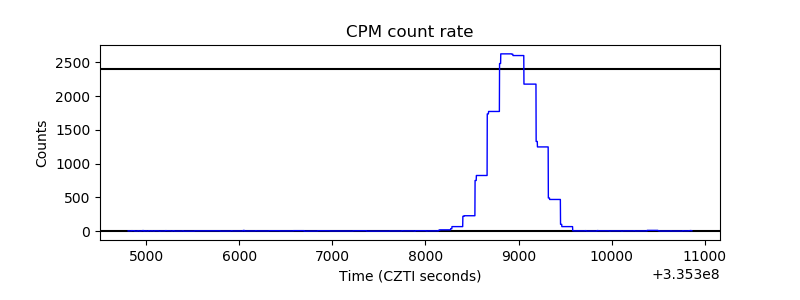 |
| CZT Counter | 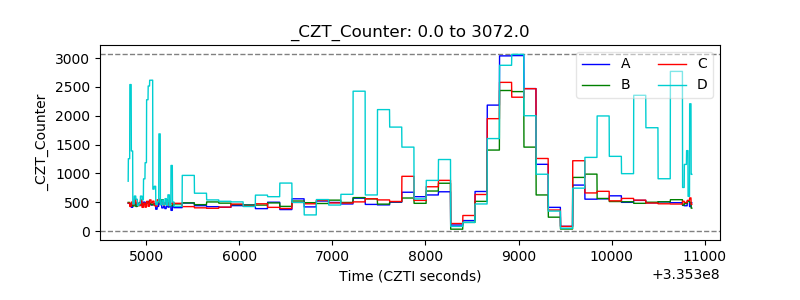 |
| +2.5 Volts monitor |  |
| +5 Volts monitor |  |
| _ROLL_ROT | 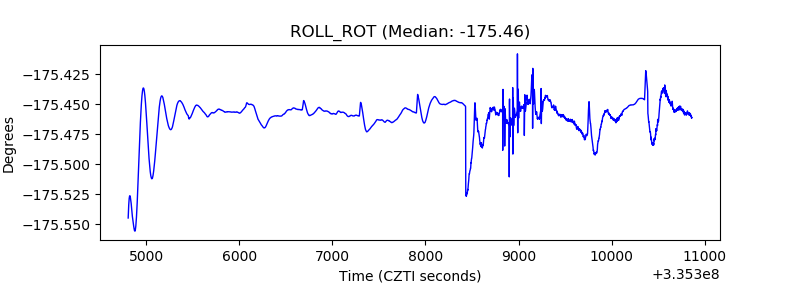 |
| _Roll_DEC |  |
| _Roll_RA | 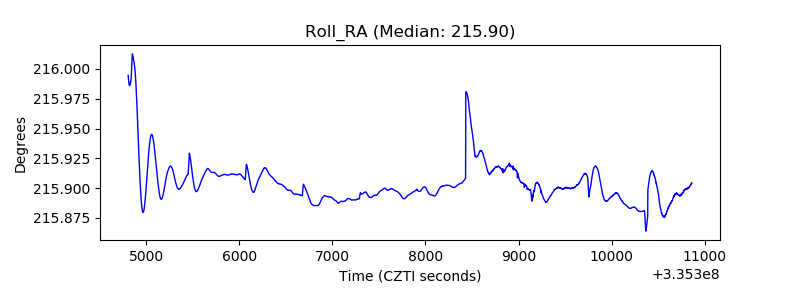 |
| Veto Counter | 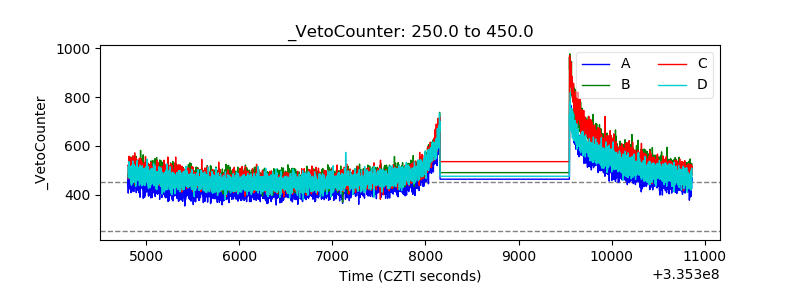 |