| Param | Original file | Final file |
|---|---|---|
| Filename | modeM0/AS1A09_127T03_9000003820_26418cztM0_level2.evt | modeM0/AS1A09_127T03_9000003820_26418cztM0_level2_quad_clean.evt |
| Size (bytes) | 588,749,760 | 87,344,640 |
| Size | 561.5 MB | 83.3 MB |
| Events in quadrant A | 3,065,102 | 575,645 |
| Events in quadrant B | 3,367,227 | 589,055 |
| Events in quadrant C | 3,727,891 | 552,287 |
| Events in quadrant D | 7,246,688 | 491,096 |
| Mode M0 | |||
|---|---|---|---|
| Quadrant | BADHDUFLAG | Total packets | Discarded packets |
| A | 0 | 12986 | 0 |
| B | 0 | 13850 | 0 |
| C | 0 | 14939 | 0 |
| D | 0 | 25953 | 0 |
| Mode M9 | |||
|---|---|---|---|
| Quadrant | BADHDUFLAG | Total packets | Discarded packets |
| A | 0 | 21 | 0 |
| B | 0 | 22 | 0 |
| C | 0 | 22 | 0 |
| D | 0 | 22 | 0 |
| Quadrant | Total seconds | Saturated seconds | Saturation percentage |
|---|---|---|---|
| A | 6259 | 23 | 0.367471% |
| B | 6259 | 91 | 1.453906% |
| C | 6259 | 211 | 3.371146% |
| D | 6259 | 1044 | 16.679981% |
Noise dominated data is calculated using 1-second bins in cleaned event files. If a bin has >2000 counts, and if more than 50% of those come from <1% of pixels, then it is considered to be noise-dominated and hence unusable.
| Quadrant | # 1 sec bins | Bins with >0 counts | Bins with >2000 counts | High rate bins dominated by noise | Noise dominated (total time) | Noise dominated (detector-on time) | Marked lightcurve |
|---|---|---|---|---|---|---|---|
| A | 7514 | 6260 | 0 | 0 | 0.00% | 0.00% | 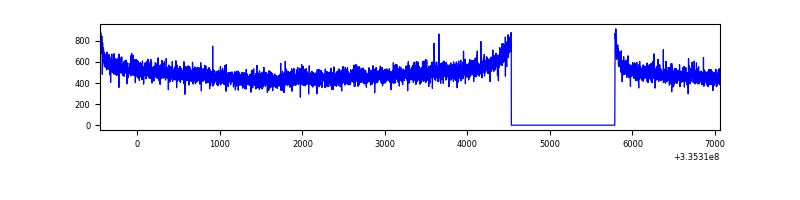 |
| B | 7514 | 6260 | 35 | 35 | 0.47% | 0.56% | 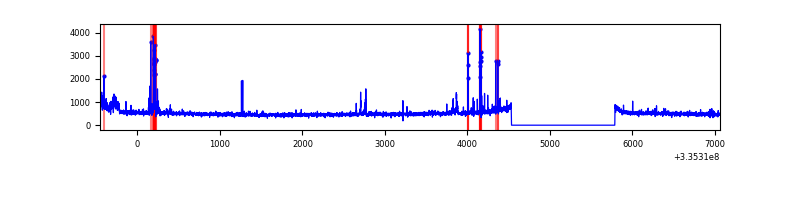 |
| C | 7514 | 6260 | 80 | 80 | 1.06% | 1.28% | 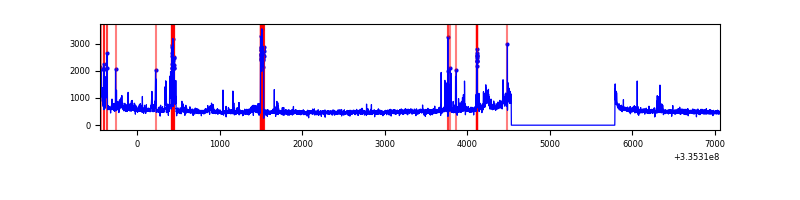 |
| D | 7514 | 6260 | 817 | 817 | 10.87% | 13.05% | 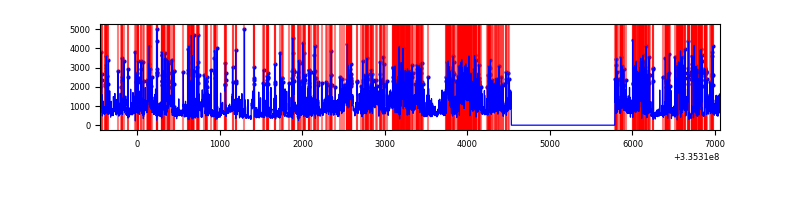 |
Top three noisy pixels from each quadrant. If the there are fewer than three noisy pixels in the level2.evt file, extra rows are filled as -1
| Pixel properties | Quadrant properties | ||||||
|---|---|---|---|---|---|---|---|
| Quadrant | DetID | PixID | Counts | Sigma | Mean | Median | Sigma |
| A | 12 | 189 | 11837 | 70.49 | 791 | 776 | 156.9 |
| A | 13 | 254 | 11118 | 65.91 | 791 | 776 | 156.9 |
| A | 3 | 137 | 6891 | 38.97 | 791 | 776 | 156.9 |
| B | 5 | 172 | 135591 | 922.71 | 794 | 777 | 146.1 |
| B | 0 | 244 | 81063 | 549.5 | 794 | 777 | 146.1 |
| B | 0 | 230 | 23206 | 153.51 | 794 | 777 | 146.1 |
| C | 3 | 233 | 370821 | 2104.31 | 762 | 769 | 175.9 |
| C | 2 | 16 | 235203 | 1333.12 | 762 | 769 | 175.9 |
| C | 14 | 238 | 122882 | 694.4 | 762 | 769 | 175.9 |
| D | 1 | 52 | 3179069 | 18722.58 | 714 | 698 | 169.8 |
| D | 7 | 80 | 689718 | 4058.76 | 714 | 698 | 169.8 |
| D | 12 | 233 | 429046 | 2523.24 | 714 | 698 | 169.8 |
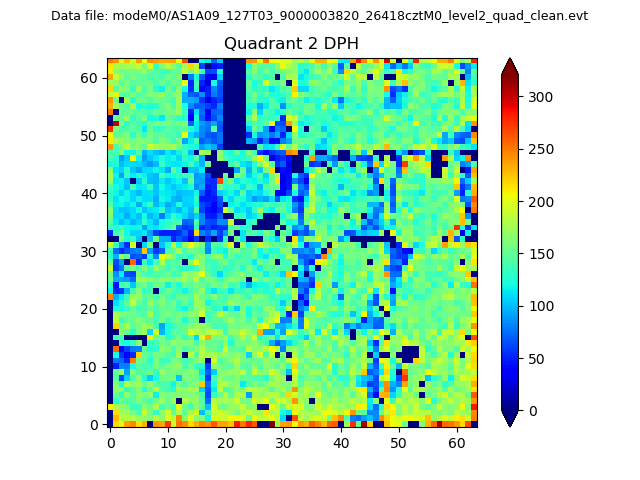
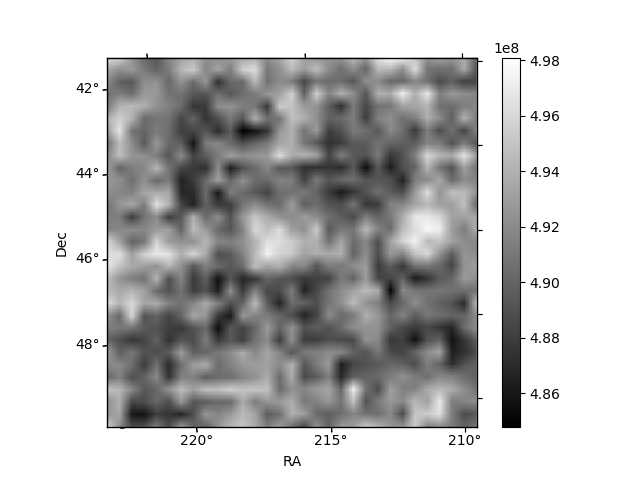
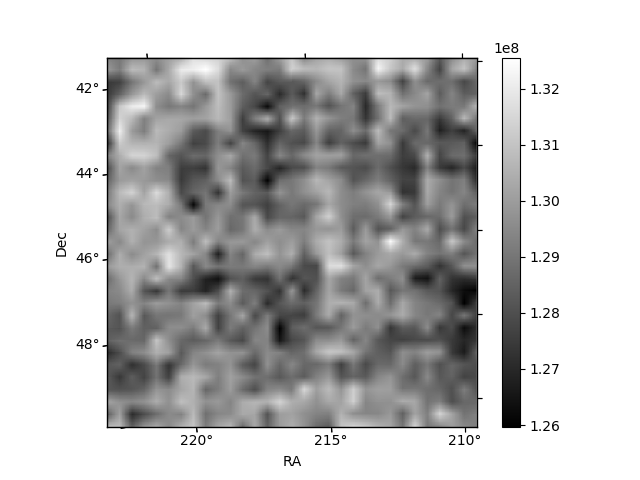
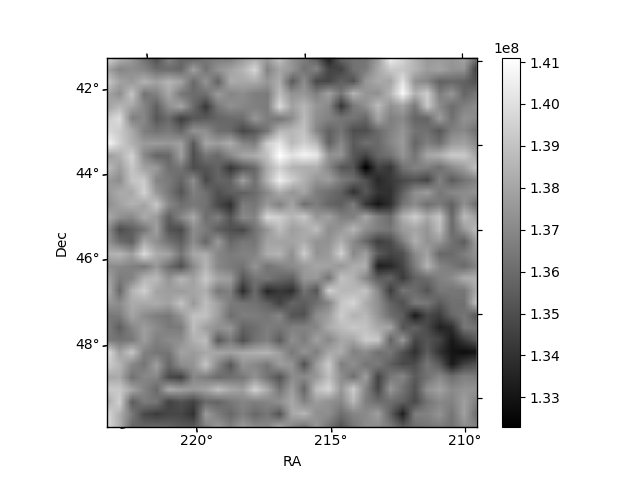
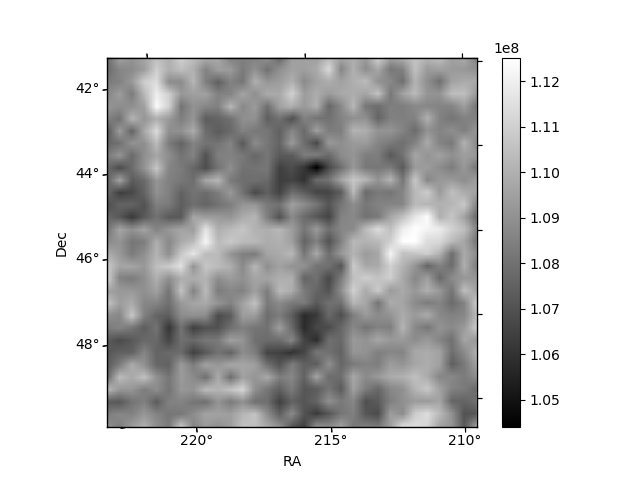
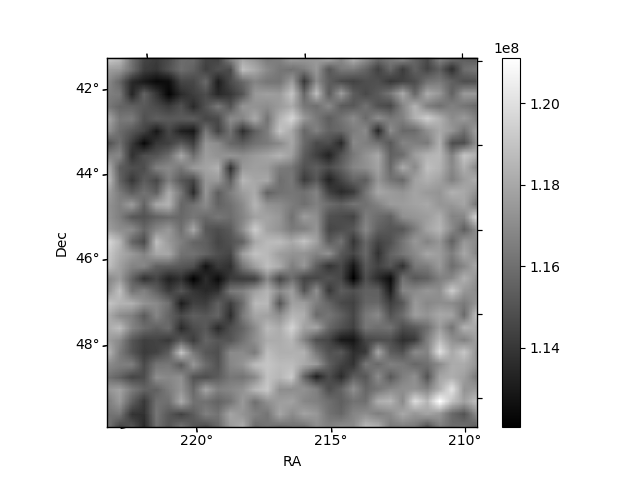
Histogram calculated using DETX and DETY for each event in the final _common_clean file
| Quadrant A | 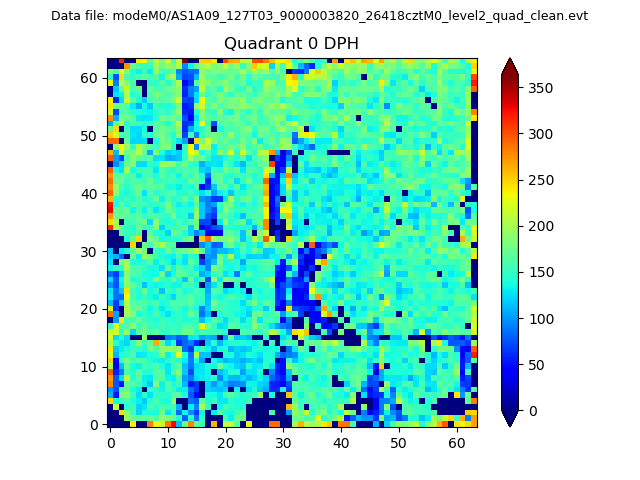 |
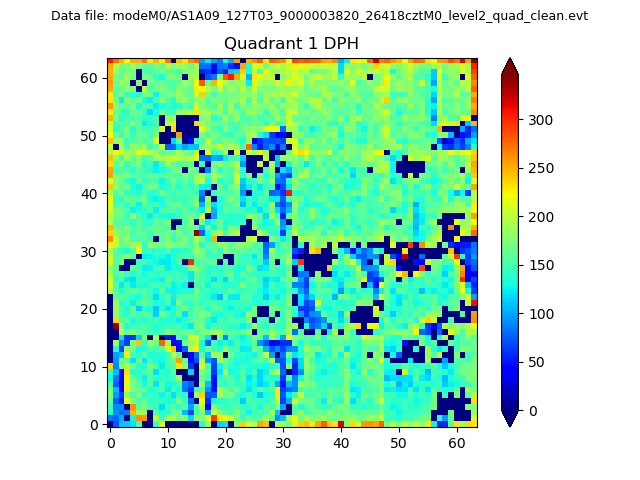 |
Quadrant B |
|---|---|---|---|
| Quadrant D | 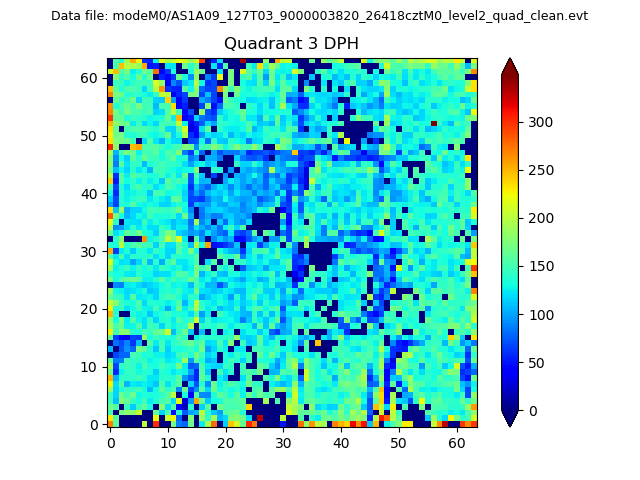 |
 |
Quadrant C |
| Plot type | Count rate plots | Images |
|---|---|---|
| Comparison with Poisson distribution Blue bars denote a histogram of data divided into 1 sec bins. Red curve is a Poisson curve with rate = median count rate of data. |
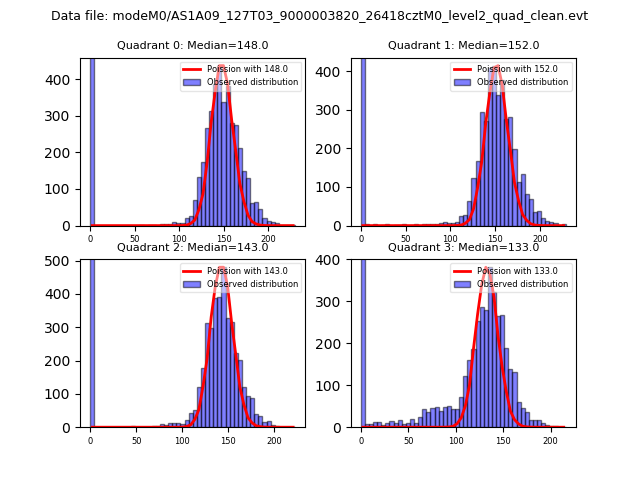 |
 |
| Quadrant-wise count rates Data is divided into 100 sec bins |
 |
|
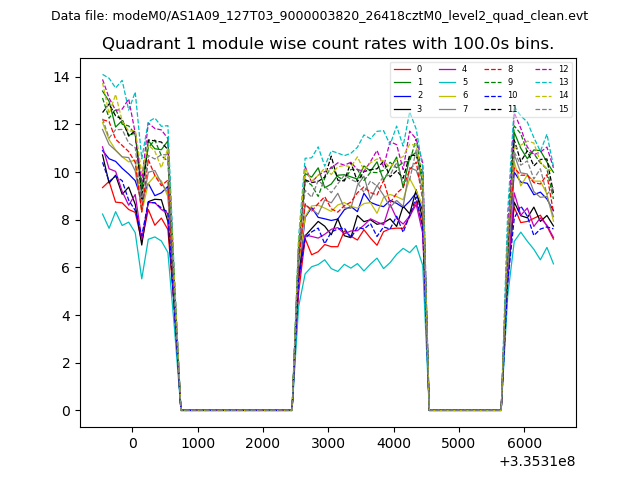
| Module-wise count rates for Quadrant A Data is divided into 100 sec bins |
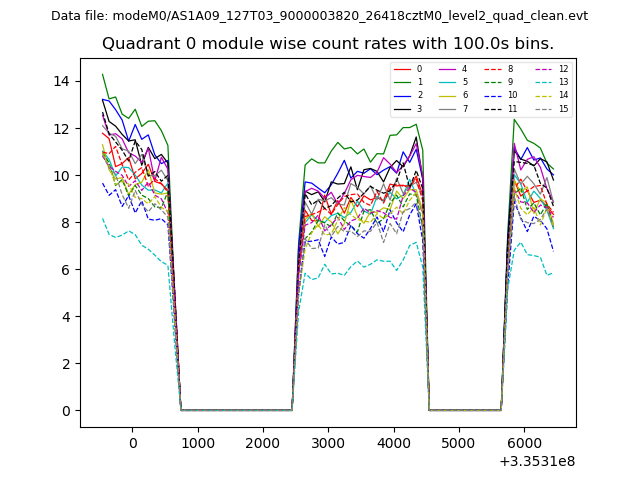 |
 |
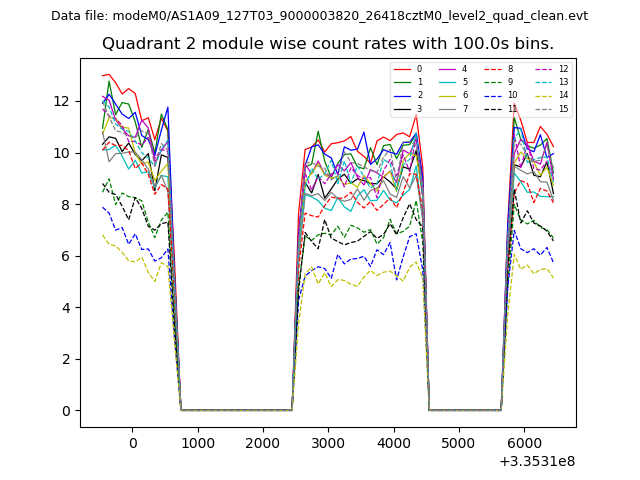
| Module-wise count rates for Quadrant B Data is divided into 100 sec bins |
 |
 |
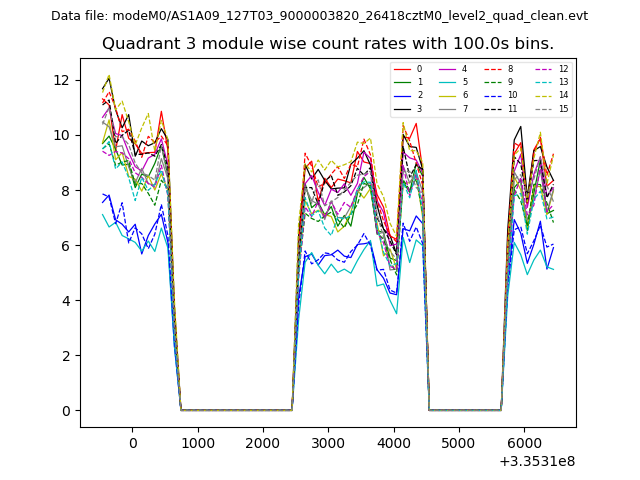
| Module-wise count rates for Quadrant C Data is divided into 100 sec bins |
 |
 |
| Module-wise count rates for Quadrant D Data is divided into 100 sec bins |
 |
 |
| Parameter | Plot |
|---|---|
| CZT HV Monitor | 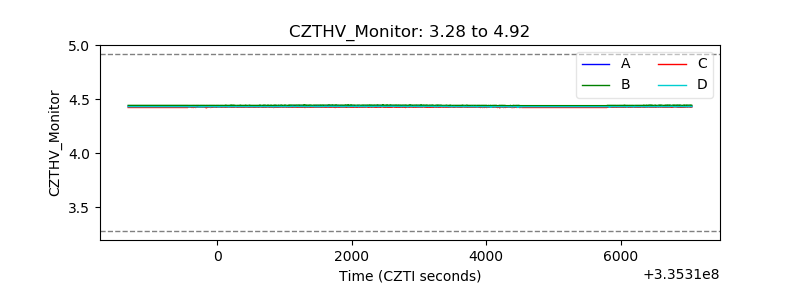 |
| D_VDD | 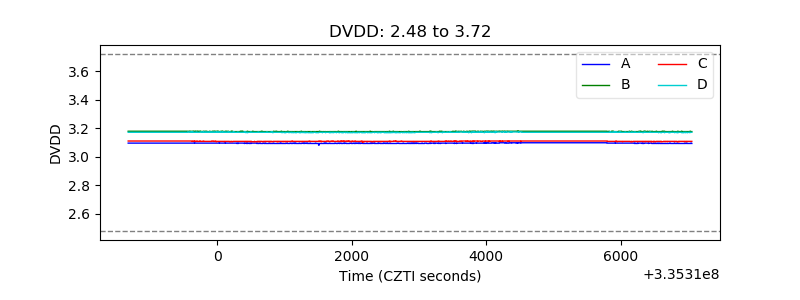 |
| Temperature 1 | 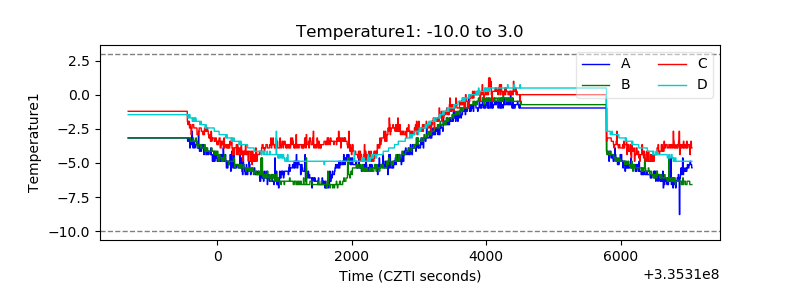 |
| Veto HV Monitor |  |
| Veto LLD | 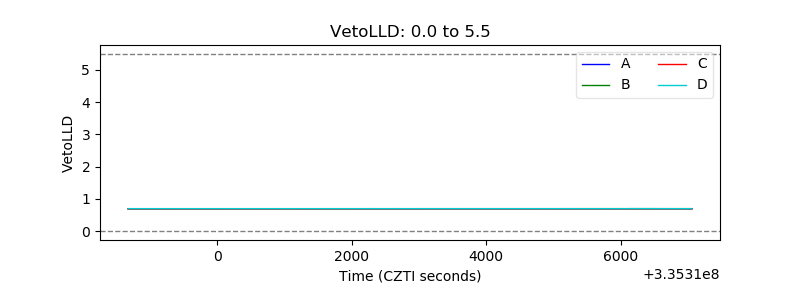 |
| Alpha Counter | 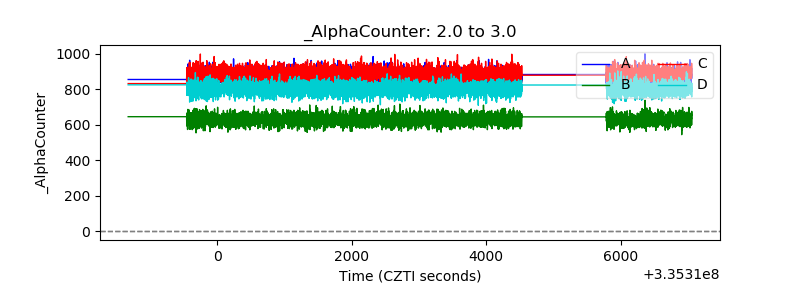 |
| _CPM_Rate |  |
| CZT Counter | 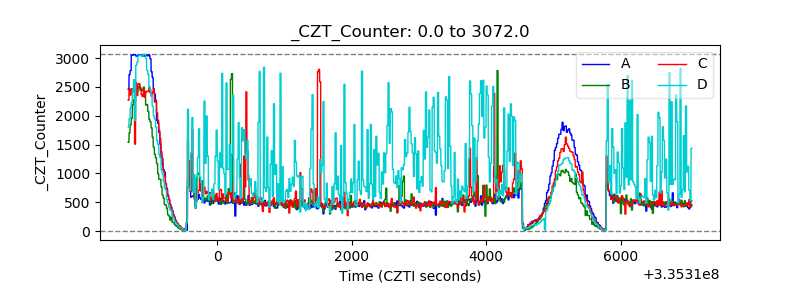 |
| +2.5 Volts monitor | 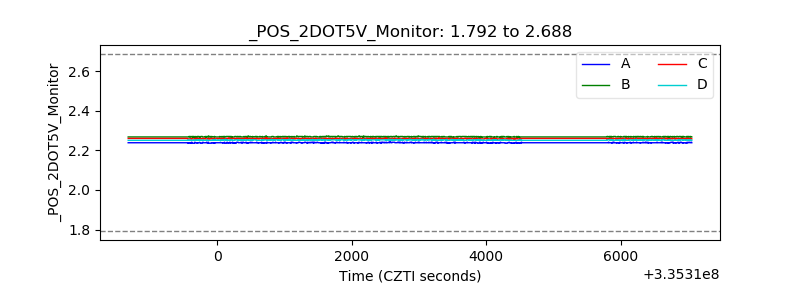 |
| +5 Volts monitor |  |
| _ROLL_ROT | 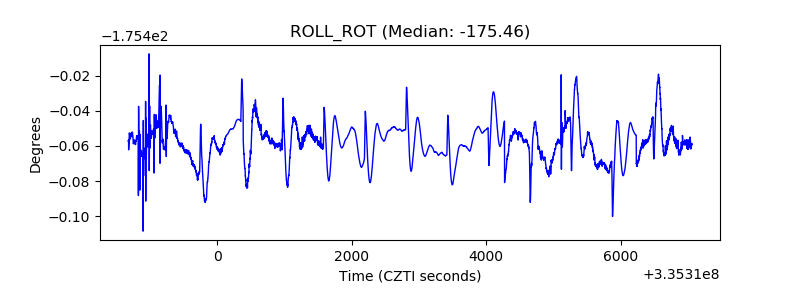 |
| _Roll_DEC | 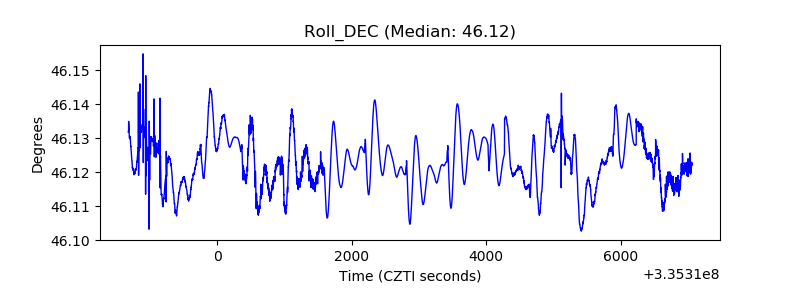 |
| _Roll_RA | 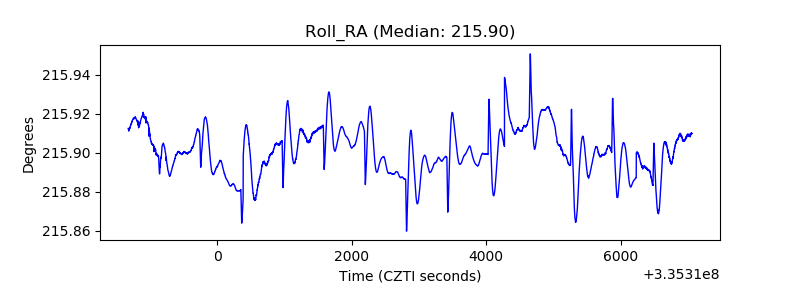 |
| Veto Counter | 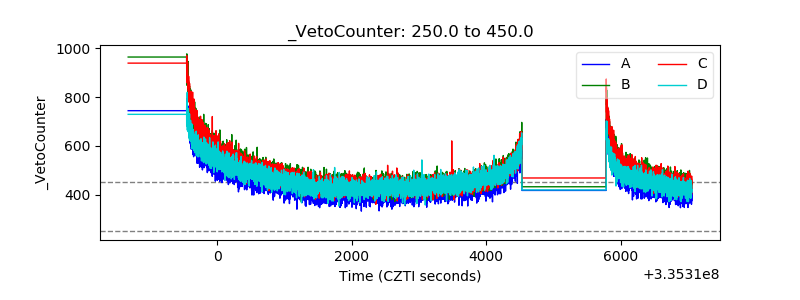 |